European fintech market
•
2 gefällt mir•487 views

A quick overview of the European Fintech Market and a comparison of key strenghts and weaknesses for key countries

Empfohlen
Empfohlen
Weitere ähnliche Inhalte
Was ist angesagt?
Was ist angesagt? (10)
Ähnlich wie European fintech market
Ähnlich wie European fintech market (20)
Kürzlich hochgeladen
Kürzlich hochgeladen (20)
European fintech market
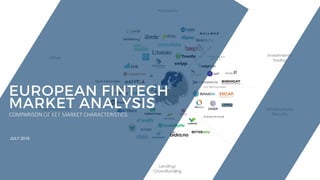
- 1. JULY 2016 COMPARISON OF KEY MARKET CHARACTERISTICS
- 2. EUROPEAN FINTECH INVESTMENT OVERVIEW Note: Nordic investment size and number of investment is based on a 2 year period from 2014 until March 2016 SOURCES: KPMG, Eurostat, Accenture Analysis, CB Insights, Own Analysis 875 356 176 278 12 61 51 21 8 10 0 10 20 30 40 50 60 70 0 100 200 300 400 500 600 700 800 900 1000 UK & Ireland Nordics Germany Netherlands France Total Investment (EURm) # of Fintech Investments UK & IRELAND NORDICS NETHERLANDS GERMANY FRANCE
- 3. UK & IRELAND NORDICS NETHERLANDS GERMANY EUROPEAN FINTECH CHARACTERISTICS VC FINTECH FUNDING FINTECH DEALS CORPORATE INCOME TAX REGULATIVE INCENTIVES DIGITAL INFRASTRUCTURE LABOR COST CONSUMER PRICE INDEX ECO-SYSTEM DEMOGRAPHICS GOVERNMENTAL FINTECH ADOPTION FRANCE €875m €356m* $278m €176m $12m 61 51 8 21 10 High Very High High Medium Medium 20% ~20-25% 25% 29,72% 25% Note: Nordic investment size and number of investment is based on a 2 year period from 2014 until March 2016 €25,7 €35-41 €34,1 €32,2 35,1 115 123-139 111 102 110 The Digital Economy and Society Index 0,61 0,68 0,67 0,57 0,51 Very High Medium High Medium Low # number of Fintech deals in 2015 Fntech investments in 2015 in EUR Corporate collaboration and consumer adoption Indicates living cost in selected countries EU 18 = Index 100 Estimated hourly labor costs 2015 Corporate income Tax from Eurostat Tax Schemes, startup Regulative system & Financial regulative VERY ATTRACTIVE LESS ATTRACTIVE SOURCES: KPMG, Eurostat, Accenture Analysis, CB Insights, Own Analysis