
Empfohlen
Weitere ähnliche Inhalte
Ähnlich wie BC Check-Up 2018
Ähnlich wie BC Check-Up 2018 (20)
Kürzlich hochgeladen
Kürzlich hochgeladen (20)
BC Check-Up 2018
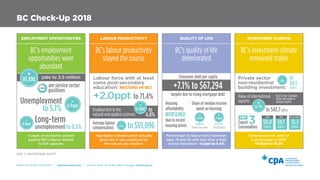
- 1. CHECK UP ON BC’s ECONOMY • www.bccheckup.com • Contact: Vivian Tse, Public Affairs Manager, vtse@bccpa.ca ppt = percentage point BC’s employment opportunities were abundant jobs to 2.5 million 4 years of economic growth pushed BC’s labour market to full capacity Government net debt as a percentage of GDP: +0.9ppt to 15.2% Percentage of labour force between ages 19 and 25 with less than a high school education: -0.1ppt to 5.4% Aggregate compensation actually grew but it was outpaced by the rate of job creation Employment in the natural and applied sciences: Value of international exports: Consumer debt per capita largely due to rising mortgage debt BC’s labour productivity stayed the course BC’s quality of life deteriorated BC’s investment climate remained stable + 87,300 are service sector positions Unemployment to 5.1% – 0.9ppt – 0.2ppt + 12.7% – 0.1% Long-term unemployment to 0.5% – 0.1ppt Labour force with at least some post-secondary education: RECORD IN BC! +2.0ppt to 71.4% Private sector non-residential building investment: to 6.8% to $4.5 billion to $43.7billion to $55,096Average labour compensation: Housing affordability due to record housing prices Export Commodities Share of median income spent on housing: Due to low Canadian dollar and spike in energy exports +7.1% to $67,294 + 2.3ppt + 7.3ppt Vancouver Victoria WORSENED 3to 80.6% to 59.4% – 2.6% TOP ENERGY $9.7 billion WOOD $5.3 billion METALLIC MINERAL $11.0 billion LABOUR PRODUCTIVITY QUALITY OF LIFE INVESTMENT CLIMATEEMPLOYMENT OPPORTUNITIES BC Check-Up 2018
- 2. CHECK UP ON BC’s ECONOMY • www.bccheckup.com • Contact: Vivian Tse, Public Affairs Manager, vtse@bccpa.ca Moderated growth is expected throughout 2018 and 2019. Housing activity is expected to slow down as a result of new policies and shifting demands. Uncertainty over trade relations will continue to have some impact on BC’s exporters, especially softwood lumber exporters. Recent policy changes in BC, including the new employer health tax, speculation tax, and the community benefits agreement, will also affect BC’s economy. GDP Growth Rate Forecast Goods: +16,800 Services: +10,400 Dec 17-June 18 + 2.4% + 27,300 Jobs Outlook 2018-2019
- 3. CHECK UP ON BC’s ECONOMY • www.bccheckup.com • Contact: Vivian Tse, Public Affairs Manager, vtse@bccpa.ca 2016-2017 CHANGE in BC EMPLOYMENT UNEMPLOYMENT RATE + 87,300 – 0.9ppt ON 7,128,000 BC 2,466,800 AB 2,286,900 18,416,400 AB 7.8% ON 6.0% BC 5.1% 6.3% BC’S EMPLOYMENT OPPORTUNITIES WERE ABUNDANT BC British Columbia Canada AB Alberta ON Ontario ppt = percentage point LONG-TERM UNEMPLOYMENT RATE – 0.1ppt AB 1.2% ON 0.7% BC 0.5% 0.7% Employment Opportunities
- 4. CHECK UP ON BC’s ECONOMY • www.bccheckup.com • Contact: Vivian Tse, Public Affairs Manager, vtse@bccpa.ca Four years of strong economic growth pushed BC’s labour market to full capacity, as employment grew by an impressive 87,300 new jobs in 2017, reaching a total of 2.47 million. Unemployment also fell to 5.1%, below the national average of 6.3%. Improved labour market conditions also drew many people back to work, with the labour participation rate rising to 65.3%, the highest level since 2010. This also led to a decline of 0.1ppt in BC’s long-term unemployment rate to 0.5%. Labour market: Full capacity ! Employment Opportunities Employment: + 3.7% Unemployment: – 0.9ppt Labour Force Participation: + 1.4ppt
- 5. CHECK UP ON BC’s ECONOMY • www.bccheckup.com • Contact: Vivian Tse, Public Affairs Manager, vtse@bccpa.ca 2016-2017 CHANGE in BC EDUCATIONAL ATTAINMENT EMPLOYMENT IN THE SCIENCES LABOUR COMPENSATION PER EMPLOYEE + 2.0ppt – 0.2ppt – 0.1% ON 73.7% BC 71.4% AB 70.5% 73.4% ON 8.5% AB 8.0% BC 6.8% 6.3% AB $72,479 ON $60,501 BC $55,096 $58,874 BC’S LABOUR PRODUCTIVITY STAYED THE COURSE BC British Columbia Canada AB Alberta ON Ontario ppt = percentage point Labour Productivity
- 6. CHECK UP ON BC’s ECONOMY • www.bccheckup.com • Contact: Vivian Tse, Public Affairs Manager, vtse@bccpa.ca A higher level of education in the workforce implies better employment prospects and compensation, as well as improved business productivity. In 2017, the share of BC’s labour force with at least some post- secondary education grew to 71.4%. But a deeper look at employment, specifically in the natural and applied sciences, says otherwise. Workers in these knowledge-based fields boost innovation and long-term business productivity, and this indicator fell for a second consecutive year in BC to 6.8%. Wages: Low ! Labour Productivity Labour Compensation per Employee AB 72K BC 55K ON 61K CAN 59K
- 7. CHECK UP ON BC’s ECONOMY • www.bccheckup.com • Contact: Vivian Tse, Public Affairs Manager, vtse@bccpa.ca BC British Columbia Canada AB Alberta ON Ontario 2016-2017 CHANGE in BC YOUTH AT RISK – 0.1ppt AB 8.3% ON 5.8% BC 5.4% 7.2% *Percentage share of median pre-tax household income required to cover the cost of mortgage payment (principal and interest), property taxes, and utilities based on the median market price for an overall aggregate of housing types. CONSUMER DEBT PER CAPITA HOUSING AFFORDABILITY* + 7.1% + 2.3ppt + 7.3ppt BC $67,294 ON $55,570 AB $53,576 $56,609 BC Vancouver 80.6% ON Toronto 75.2% BC Victoria 59.4% AB Calgary 41.6% 47.52% Vancouver Victoria BC’S QUALITY OF LIFE DETERIORATED ppt = percentage point Quality of Life
- 8. CHECK UP ON BC’s ECONOMY • www.bccheckup.com • Contact: Vivian Tse, Public Affairs Manager, vtse@bccpa.ca BC’s average labour compensation was low while its consumer debt per capita is high. This, combined with high housing prices and rising interest rates, affected BC’s quality of life. In 2017, the share of labour force aged 19-24 with less than a high school education fell to 5.4%. There has been a steady decline over the past five years, reflecting an increase in high school completion rates and likely better employment prospects for young workers. ! Quality of Life BC AB ON CAN Growth in Consumer Debt Debt: High 8.4%
- 9. CHECK UP ON BC’s ECONOMY • www.bccheckup.com • Contact: Vivian Tse, Public Affairs Manager, vtse@bccpa.ca 2016-2017 CHANGE in BC PRIVATE SECTOR NON- RESIDENTIAL BUILDING INVESTMENT (MILLIONS) VALUE OF EXPORTS PER WORKER GOVERNMENT NET DEBT AS A % OF GDP – 2.6% + 9.7% + 0.9ppt ON $15,728 AB $7,123 BC $4,531 $38,543 AB $40,358 ON $26,365 BC $16,805 $25,531 ON 37.1% BC 15.2% AB 6.0% 30.4% BC’S INVESTMENT CLIMATE REMAINED STABLE BC British Columbia Canada AB Alberta ON Ontario ppt = percentage point Investment Climate
- 10. CHECK UP ON BC’s ECONOMY • www.bccheckup.com • Contact: Vivian Tse, Public Affairs Manager, vtse@bccpa.ca Despite following four successive years of strong economic growth, 2017 was less than stellar for BC’s investment climate. After six years of positive growth, private sector non-residential building investment declined to $4.5 billion. While the value of exports per worker saw a 9.7% gain to reach $16,805, BC significantly lagged behind the Canadian average and other comparison jurisdictions. BC’s government net debt as a percentage of GDP increased to 15.2%, but it remained one of the best performers among our comparison jurisdictions. Business Interest: Average !Private Sector Non-Residential Building Investment: – 2.6% Value of Exports per Worker: + 9.7% Government Net Debt as a % of GDP: + 0.9ppt Investment Climate
- 11. CHECK UP ON BC’s ECONOMY • www.bccheckup.com • Contact: Vivian Tse, Public Affairs Manager, vtse@bccpa.ca Educational attainment: The percentage of the labour force aged 25 to 64 with post-secondary accreditation. Employment in the sciences: the share of employment in the natural and applied sciences. Labour compensation per employee: compensation received by an individual for work done, including employers’ social contributions, before deducting government transfers. Consumer debt per capita: includes both personal and mortgage debt. Youth at risk: the percentage of the labour force aged 19-24 lacking a high school diploma. RBC housing affordability index: the proportion of median pre-tax household income required to service the cost of mortgage payment, property taxes, and utilities based on the median market price for an overall aggregate of housing types in a given market. Private sector investment in non- residential infrastructure: investments in non-residential building construction, excluding expenditure on residential construction and engineering work. Value of exports per worker: the ratio of the inflation-adjusted value of exports to the number of workers. Government net debt as a percentage of GDP: the ratio of government net debt to GDP and measures the fiscal position of a provincial government. Data for BC Check-Up is obtained from Statistics Canada and supplemented with information from other credible published sources. Job creation: the annual change in the number of employed workers. Unemployment rate: the share of unemployed persons in the labour force, which is defined as people ages 15 and older who are employed or actively looking for work. Long-term unemployment: the share of the labour force out of work for 52 weeks or more. LABOUR PRODUCTIVITY QUALITY OF LIFE INVESTMENT CLIMATEEMPLOYMENT OPPORTUNITIES Definitions