1. Kristie DeHeer | 5/27/2015 |
Project Advisor:
Dave MacLean
Data provided by:
Trish LeBlanc
Andrew Hannam
NASA
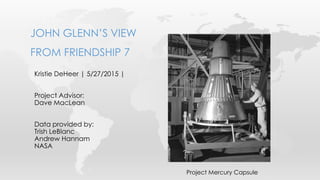
JOHN GLENN’S VIEW
FROM FRIENDSHIP 7
Project Mercury Capsule
2. • On February 20, 1962 John Glenn became the
first U.S. astronaut to orbit the earth.
• The objectives of this mission were to place a
man into the earth’s orbit, observe his reactions
the to space environment and to return him
safely to earth where he could be easily
retrieved.
• In just 4 hours, 55 minutes and 23 seconds the
Mercury-Atlas spacecraft (Friendship 7) orbited
the earth three times before landing in the
ocean.
• This mission was so important because it made
NASA and the U.S. (‘Merica) strong contenders
against Russia in the space race.
• The Mercury-Atlas spacecraft was nicknamed
Friendship 7 by John’s children.
BACKGROUND
Launch of Friendship 7
3. • The map used for this project was one of two charts that John
Glenn took with him in the Friendship 7 shuttle.
• The W. K. Morrison Special Collection received this map from Dr.
John E. Dornbach who produced this map for the Aeronautical
Chart and Information Center.
• John E. Dornbach eventually became Director of the Earth
Resources branch at NASA.
SOME HISTORY OF THIS MAP
4. • The original map from the W. K. Morrison Special Collection was
scanned into a .tif image file.
• Because the map was given to me as a image file with no spatial
context it needed to be georeferenced.
• Initially I tried to georeference the image by using the latitude and
longitudinal lines on the map, and then adding the coordinates in
manually. This method was not successful because the projection
needed to be declared before georeferencing could take place.
TASKS FOR THIS PROJECT
5.
6. • ArcGIS Online uses the Mercator Auxiliary Sphere projection.
Before georeferencing could take place this projection was
assigned to the .tif image so that it could be uploaded into
ArcGIS Online.
• The projected coordinate system used was:
WGS_1984_Web_Mercator_Auxiliary_Sphere
• The image was then georeferenced using an ESRI base map
for orientation.
• Now the image was ready to be uploaded into ArcGIS Online
as a tiled mapping service.
GEOREFERENCING
7. Kristie DeHeer | 5/15/2015 |
JOHN GLEN’S VIEW FROM FRIENDSHIP7
GEOREFERENCED MAP COMPARED TO BASE MAP
8. • The map was shared as a service that was composed of tiles to
be used for tiled mapping.
• The visible range for the tiles was set from
1:591,657,528 to 1:1,128.
• It was not necessary to make the map scale larger because the
quality of the image was not very high and the image became
grainy in appearance when zoomed in too far.
• Smaller test sections were required to ensure settings were
correct before uploading the full map.
• Within ArcGIS Online, the tiles were published down to 1:577,791
scale
GENERATING TILES AS A WEB SERVICE
9.
10. Attribute table for Orbital
tracks, digitized tracks can be
seen above.
DIGITIZING ORBITAL TRACKS
11. Attribute table for Stations,
digitized stations can be
seen above.
DIGITIZING STATION INFORMATION
12. Attribute table for flight times.
Digitized time markers can be
seen above.
DIGITIZING FLIGHT TIMES
13. • In order to try and display what John Glenn might of seen
from the window of Friendship 7, photos had to be
collected along the orbital track of the shuttle.
• The National Aeronautics and Space Administration (NASA)
allows the public to access and search through astronaut
photography of the earth from the year 1961 to the
present.
• It is possible to search for images by geographical features
(volcano, river etc.), using NASA photo ID’s (which include
mission number, roll id and, frame numbers) or you can
search by map area.
COLLECTING PHOTOS
21. LINK TO WEB MAPPING APPLICATION
http://bit.ly/GlennPlusISS
22. Garber, Steve. The Friendship 7 Mission: A Major Achievement and a Sign of
More to Come. NASA, 22 Feb. 2010. Web. 26 May 2015.
<http://grin.hq.nasa.gov/ABSTRACTS/GPN-2000-000686.html>.
Garber, Steve. "Friendship 7 - Home." Friendship 7 - Home. NASA, 22 Feb. 2010.
Web. 23 May 2015.<http://history.nasa.gov/friendship7/>.
Hahn, Michael. "GPN-2000-000382 - Project Mercury - Capsule #2." GPN-2000-
000382 - Project Mercury - Capsule #2. NASA, 13 May 2010. Web. 26 May
2015. <http://grin.hq.nasa.gov/ABSTRACTS/GPN-2000-000382.html>.
DeHeer, Kristie. "John Glenn's View Fom Friendship 7." John Glenn's View Fom
Friendship 7. ArcGIS Online, 26 May 2015. Web.
<https://cogsnscc.maps.arcgis.com/apps/Viewer/index.html?appid=44fad5f
36bc842388176e68c2671bef2>.
Digital reproduction from the W. K. Morrison Special Collection of the J. B. Hall
Library at the NSCC Centre of Geographic Sciences.
http://nscc.cairnrepo.org/islandora/object/nscc:291
Dornbach, J. E. (1961). Mercury Orbit Chart MOC-3. St. Louis, MO: United
States Air Force. Aeronautical Chart and Information Center.
REFERENCES:
In the image you can see the Mercury-Atlas capsule that John Glenn orbited the earth in. It looks very spacious.
Trying to georeference but not succeeding
Comparing coastlines to judge the accuracy of my georeferencing
Because this map covers the majority of the globe and because it has multiple zoom levels it took a very long time to publish this service in full.
This is an image of the map once it has been uploaded into ArcGIS Online. With a base map turned on.
The next step was to begin making new shapefiles for items found on the map that I wanted to incorporate into my online map. An empty attribute table was created to store information about the orbital tracks. Then, the orbital tracks were traced over the georeferenced map as polylines using the Create Features tool and the attribute table was filled with the information used to identify which track was which. This new shapefile was then shared as a service and added to the map in ArcGIS Online as a feature layer, the same was done for the Stations and the Flight Times, which I will talk about next.
Next I digitized the communication stations as a point feature class. These stations were used to keep in radio contact with John Glenn during his flight. For this new shapefile the full name of the station was collected, its initials and the frequencies that it broadcasts in were added to the new attribute table
The map contained time markers along the orbital tracks. These time makers displayed the hours and minutes into the flight that had passed at particular points along the orbit. These were digitized as points and an attribute table was created to store the hours and minutes recorded from the time markers.
For this project I collected photo’s by map area along the orbital tracks of Friendship 7. This is done by drawing a rectangle around the area of interest and then beginning the query for photo’s. In this example I am searching for photos of Nova Scotia.
There are a few options for viewing query results. They can be viewed in a text table, in an image gallery, as pins on a map or with coolIris which is an interactive gallery that allows you to rapidly view photos for selection. For this project I chose to view queries in a text table with thumbnails. This allowed for images to be previewed without actually clicking on them, while also being able to see information about the image like when it was taken, which country or region it is showing and what features are present in the photograph.
Once a photo is selected from the query results page more information about the image can be found, along with links to higher resolution images. For this project I was interested in collecting information about the NASA photo ID, the focal length of the camera used, the date and time the image was taken, the URL to the highest resolution image available, as well as the photo center point, so that I could add the correct coordinates of the photo to my map.
A google form was created to store photo information and coordinates. Google forms can be added in ArcGIS Online by selecting the option “add layer from web” and by adding the form as a Comma Separated Value file. This is a snippet of the google form that I used in my project. Google forms are live so every time that I made a change on the form it would be updated on my map after the next refresh interval.
In order to use the google form within ArcGIS online the URL was copied from the google form by clicking “Publish to the web” under the file options. The URL needed to be adjusted so that ArcGIS Online could use it. These are a few examples of URL’s that were edited, the last URL is the one that worked for this project. To learn how to edit google form URL’s so that they are compatible with ArcGIS Online I had to take advantage of ArcGIS Resources and find an article about using google documents in ArcGIS Online.
Once the google form was added as a layer to the online map the points appeared on the map where their latitude and longitude designated. On this slide you can see an example of the popup that was created from adding the google form as a layer, as well as the points that were generated on the map. The popup is a little plain, and doesn’t preview the image that it has a link to… new and improved popups were needed.
In order to create more visually appealing popups I placed stickpin markers over the imported locations from the google form. I was then able to configure the popup to contain the same information as before, but with a thumbnail image that would also link to the full resolution image from NASA.