Southern California EV Statistical Information - 2009 to 2020
•
0 gefällt mir•681 views

The Southern California region contains over 44% of California's population and is home to Los Angeles County and surrounding counties. Los Angeles County alone contains over 10 million residents, making it more populous than all but 9 U.S. states. As of 2009, building energy use and employee commutes accounted for the majority of Los Angeles County's municipal greenhouse gas emissions at 35% and 33% respectively. Looking ahead to 2020, emissions are forecasted to rise across all sectors if no additional actions are taken.

Empfohlen
Weitere ähnliche Inhalte
Mehr von CALSTART
Mehr von CALSTART (20)
Kürzlich hochgeladen
Kürzlich hochgeladen (20)
Southern California EV Statistical Information - 2009 to 2020
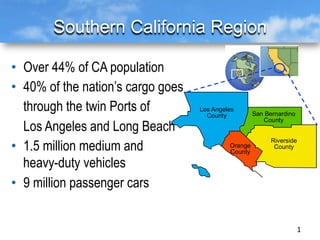
- 1. Southern California Region 1 Los Angeles County Orange County Riverside County San Bernardino County • Over 44% of CA population • 40% of the nation’s cargo goes through the twin Ports of Los Angeles and Long Beach • 1.5 million medium and heavy-duty vehicles • 9 million passenger cars
- 2. County of Los Angeles • The County is 4,061 square miles in size. • The County has almost 10.4 million residents - 28% of State’s population. • Population has grown 900,000 in the last decade. • The County is larger population than all but 9 states. • 101,000 employees. 2
- 3. Base Line The County has: • More than 2,200 buildings. • About 14,000 vehicles & pieces of equipment. • Uses 14 million gallons of various fuels. • 101,000 employees. 3
- 4. Los Angeles County 2009 Municipal GHG Inventory Building Energy Use 35% Cogeneration Facilities 16%Vehicle Fleet 10% Other Sources* 4% Employee Commute 33% Street Lights, Traffic Signals, and Outdoor Lighting 2% * Other sources include Owned Landfills, Refrigerants, Wastewater Treatment Plants, Water Pumps, Miscellaneous (Ammunition, Ethylene Oxide, CO2, and Acetylene), Waste Generation, and Water Consumption. 4
- 5. L. A. County 2020 BAU Forecast and 2009 Municipal GHG Inventory Comparison 0 50,000 100,000 150,000 200,000 250,000 300,000 350,000 400,000 450,000 500,000 Building Energy Use Cogeneration Facilities Vehicle Fleet Street Lights, Traffic Signals, and Outdoor Lighting Employee Commute Other Sources* Emissions(MTCO2e) 2009 Inventory 2020 BAU Forecast * Other sources include Owned Landfills, Refrigerants, Wastewater Treatment Plants, Water Pumps, Miscellaneous (Ammunition, Ethylene Oxide, CO2, and Acetylene), Waste Generation, and Water Consumption. 5
- 6. Barriers/Issues: • Cost Recovery: Ø If too much, employees won’t purchase Plug-Ins or use infrastructure; Ø If too little – a gift of public moneys. • Employee Equity. 6