Weitere ähnliche Inhalte
Ähnlich wie Providence Village TX - Housing Market Report - August 2010
Ähnlich wie Providence Village TX - Housing Market Report - August 2010 (17)
Mehr von Valarie Littles (20)
Kürzlich hochgeladen (20)
Providence Village TX - Housing Market Report - August 2010
- 1. Valarie Littles Ultima Real Estate
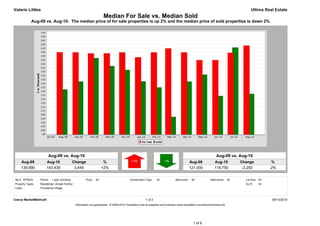
Median For Sale vs. Median Sold
Aug-09 vs. Aug-10: The median price of for sale properties is up 2% and the median price of sold properties is down 2%
Aug-09 vs. Aug-10 Aug-09 vs. Aug-10
Aug-09 Aug-10 Change % Aug-09 Aug-10 Change %
139,990 143,435 3,445 +2% 121,000 118,750 -2,250 -2%
MLS: NTREIS Period: 1 year (monthly) Price: All Construction Type: All Bedrooms: All Bathrooms: All Lot Size: All
Property Types: Residential: (Single Family) Sq Ft: All
Cities: Providence Village
Clarus MarketMetrics® 1 of 2 09/13/2010
Information not guaranteed. © 2009-2010 Terradatum and its suppliers and licensors (www.terradatum.com/about/licensors.td).
1 of 6
- 2. Valarie Littles Ultima Real Estate
Median For Sale vs. Median Sold
Aug-09 vs. Aug-10: The median price of for sale properties is up 2% and the median price of sold properties is down 2%
For Sale # Properties Sold # Properties Price
Time Period Median For Sale Median Sold Difference
Aug-10 143,435 81 118,750 6 -24,685
Jul-10 139,700 80 142,450 8 2,750
Jun-10 136,000 85 117,625 8 -18,375
May-10 135,950 79 128,600 11 -7,350
Apr-10 139,900 78 124,988 13 -14,912
Mar-10 142,000 77 106,950 8 -35,050
Feb-10 139,900 71 122,000 5 -17,900
Jan-10 137,445 62 125,100 4 -12,345
Dec-09 139,900 51 130,975 6 -8,925
Nov-09 139,450 48 132,986 6 -6,465
Oct-09 139,400 53 137,050 16 -2,350
Sep-09 139,925 60 125,000 9 -14,925
Aug-09 139,990 59 121,000 11 -18,990
Clarus MarketMetrics® 2 of 2 09/13/2010
Information not guaranteed. © 2009-2010 Terradatum and its suppliers and licensors (www.terradatum.com/about/licensors.td).
2 of 6
- 3. Valarie Littles Ultima Real Estate
Supply & Demand by Month
Aug-09 vs. Aug-10: The number of for sale properties is up 37% and the number of sold properties is down 45%
Aug-09 vs. Aug-10 Aug-09 vs. Aug-10
Aug-09 Aug-10 Change % Aug-09 Aug-10 Change %
59 81 22 +37% 11 6 -5 -45%
MLS: NTREIS Period: 1 year (monthly) Price: All Construction Type: All Bedrooms: All Bathrooms: All Lot Size: All
Property Types: Residential: (Single Family) Sq Ft: All
Cities: Providence Village
Clarus MarketMetrics® 1 of 2 09/13/2010
Information not guaranteed. © 2009-2010 Terradatum and its suppliers and licensors (www.terradatum.com/about/licensors.td).
3 of 6
- 4. Valarie Littles Ultima Real Estate
Supply & Demand by Month
Aug-09 vs. Aug-10: The number of for sale properties is up 37% and the number of sold properties is down 45%
# Properties Average DOM # Properties Average DOM
Time Period For Sale For Sale Sold Sold
Aug-10 81 97 6 44
Jul-10 80 112 8 72
Jun-10 85 117 8 39
May-10 79 131 11 76
Apr-10 78 132 13 88
Mar-10 77 142 8 37
Feb-10 71 151 5 75
Jan-10 62 151 4 90
Dec-09 51 168 6 92
Nov-09 48 172 6 48
Oct-09 53 166 16 75
Sep-09 60 158 9 95
Aug-09 59 150 11 79
Clarus MarketMetrics® 2 of 2 09/13/2010
Information not guaranteed. © 2009-2010 Terradatum and its suppliers and licensors (www.terradatum.com/about/licensors.td).
4 of 6
- 5. Valarie Littles Ultima Real Estate
Months Supply of Inventory
Aug-09 vs. Aug-10: The average months supply of inventory is up 125%
Aug-09 vs. Aug-10
Aug-09 Aug-10 Change %
4.0 9.0 5.0 +125%
MLS: NTREIS Period: 1 year (monthly) Price: All Construction Type: All Bedrooms: All Bathrooms: All Lot Size: All
Property Types: Residential: (Single Family) Sq Ft: All
Cities: Providence Village
Clarus MarketMetrics® 1 of 2 09/13/2010
Information not guaranteed. © 2009-2010 Terradatum and its suppliers and licensors (www.terradatum.com/about/licensors.td).
5 of 6
- 6. Valarie Littles Ultima Real Estate
Months Supply of Inventory
Aug-09 vs. Aug-10: The average months supply of inventory is up 125%
# Units For Sale # UC Units UC Average
Time Period Last Day of Month During Month MSI DOM
Aug-10 63 7 9.0 56
Jul-10 63 7 9.0 67
Jun-10 64 9 7.1 58
May-10 62 5 12.4 77
Apr-10 60 10 6.0 56
Mar-10 56 11 5.1 106
Feb-10 52 13 4.0 76
Jan-10 55 4 13.8 20
Dec-09 42 6 7.0 112
Nov-09 39 5 7.8 96
Oct-09 37 7 5.3 68
Sep-09 40 14 2.9 75
Aug-09 44 11 4.0 55
Clarus MarketMetrics® 2 of 2 09/13/2010
Information not guaranteed. © 2009-2010 Terradatum and its suppliers and licensors (www.terradatum.com/about/licensors.td).
6 of 6