Weitere ähnliche Inhalte Ähnlich wie Metro Atlanta Q310 Market Report (3) (20) 1. Office Market
Atlanta 3Q10
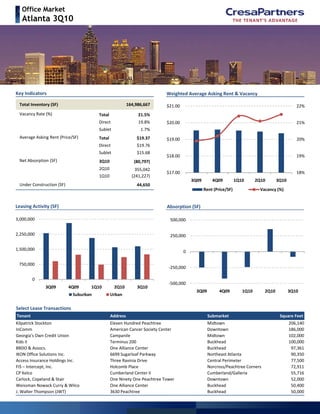
Key Indicators Weighted Average Asking Rent & Vacancy
T t l I t (SF) 164 986 667
19%
20%
21%
22%
$18 00
$19.00
$20.00
$21.00 Total Inventory (SF) 164,986,667
Vacancy Rate (%) Total 21.5%
Direct 19.8%
Sublet 1.7%
Average Asking Rent (Price/SF) Total $19.37
Direct $19.76
Sublet $15.68
18%
19%
$17.00
$18.00
3Q09 4Q09 1Q10 2Q10 3Q10
Rent (Price/SF) Vacancy (%)
Net Absorption (SF) 3Q10 (80,797)
2Q10 355,042
1Q10 (241,227)
Under Construction (SF) 44,650
Absorption (SF)Leasing Activity (SF)
0
250,000
500,000
Absorption (SF)Leasing Activity (SF)
1,500,000
2,250,000
3,000,000
‐500,000
‐250,000
3Q09 4Q09 1Q10 2Q10 3Q10
0
750,000
3Q09 4Q09 1Q10 2Q10 3Q10
Suburban Urban
Select Lease Transactions
Tenant Address Submarket Square Feet
Kilpatrick Stockton Eleven Hundred Peachtree Midtown 206,140
InComm American Cancer Society Center Downtown 186,000
Georgia's Own Credit Union Campanile Midtown 102,000
Kids II Terminus 200 Buckhead 100,000
BBDO & Assocs. One Alliance Center Buckhead 97,361
IKON Office Solutions Inc. 6699 Sugarloaf Parkway Northeast Atlanta 90,350
Access Insurance Holdings Inc. Three Ravinia Drive Central Perimeter 77,500g ,
FIS – Intercept, Inc. Holcomb Place Norcross/Peachtree Corners 72,911
CP Kelco Cumberland Center II Cumberland/Galleria 55,716
Carlock, Copeland & Stair One Ninety One Peachtree Tower Downtown 52,000
Weissman Nowack Curry & Wilco One Alliance Center Buckhead 50,400
J. Walter Thompson (JWT) 3630 Peachtree Buckhead 50,000
2. Total
Inventory
(SF)
Qtrly Net
Absorption
(SF)
Direct
Vacancy
Rate
Sublet
Vacancy
Rate
Total
Vacancy
Rate
Direct Avg.
Asking Rent
(Price/SF)
Sublet Avg.
Asking Rent
(Price/SF)
Total Avg.
Asking Rent
(Price/SF)
Urban 52,107,643 283,510 21.8% 1.6% 23.4% $22.12 $16.73 $21.71
Class A 38,929,980 323,520 24.4% 1.9% 26.3% $23.29 $17.14 $22.78
Class B 13,177,663 (40,010) 14.1% 0.6% 14.8% $16.91 $13.50 $16.74
Submarket Statistics Office Market | Atlanta 3Q10
Downtown 18,320,859 27,157 18.0% 1.9% 19.8% $18.72 $15.94 $18.44
Class A 13,116,195 26,950 20.3% 2.6% 22.9% $19.94 $15.97 $19.43
Class B 5,204,664 207 12.0% 0.1% 12.1% $14.97 $12.50 $14.97
Midtown 14,681,256 (1,959) 25.6% 1.6% 27.3% $22.96 $15.78 $22.47
Class A 11,123,345 27,936 29.5% 1.6% 31.1% $23.75 $17.19 $23.39
Class B 3,557,911 (29,895) 13.5% 1.6% 15.2% $17.79 $12.73 $17.04
Midtown West 386,125 2,669 23.9% 2.9% 26.9% $17.78 $16.59 $17.55
Class A 77,104 0 26.7% 0.0% 26.7% $16.26 ‐ $16.26
Class B 309,021 2,669 23.3% 3.6% 26.9% $18.95 $16.59 $18.25
Buckhead 18,719,403 255,643 22.8% 1.3% 24.1% $24.38 $18.75 $24.04
Class A 14,613,336 268,634 24.5% 1.6% 26.1% $25.54 $18.91 $25.08
Class B 4,106,067 (12,991) 16.7% 0.3% 17.0% $18.68 $15.68 $18.62
Suburban 112,320,080 (364,307) 18.7% 1.8% 20.5% $18.63 $15.34 $18.28
Class A 53,426,981 (104,825) 18.0% 2.4% 20.4% $21.23 $16.08 $20.45
Class B 58,893,099 (259,482) 19.4% 1.2% 20.7% $16.02 $13.19 $15.85
Airport/South Atlanta 4,539,451 (49,535) 18.9% 0.9% 19.8% $17.49 $16.13 $17.46
Class A 669,741 3,618 37.2% 2.7% 39.9% $20.29 $16.13 $20.00
Class B 3,869,710 (53,153) 15.7% 0.6% 16.4% $16.00 ‐ $16.00
Central Perimeter 23,705,683 (192,769) 19.6% 1.9% 21.5% $21.28 $16.44 $20.92
Class A 17,622,305 (75,581) 19.5% 1.9% 21.5% $22.49 $17.61 $22.09
Class B 6,083,378 (117,188) 19.9% 1.7% 21.6% $17.97 $11.87 $17.62
Cumberland/Galleria 22,313,346 (22,811) 17.5% 2.1% 19.6% $19.12 $15.60 $18.68
Class A 13,825,491 (35,074) 15.1% 2.9% 18.0% $21.47 $16.30 $20.52
Class B 8,487,855 12,263 21.4% 1.0% 22.4% $16.10 $10.55 $15.88
Decatur 1,850,828 847 12.7% 0.0% 12.7% $20.21 ‐ $20.21
Class A 570,469 9,626 15.1% 0.0% 15.1% $22.12 ‐ $22.12
Class B 1,280,359 (8,779) 11.7% 0.0% 11.7% $18.52 ‐ $18.52
East Cobb 1,164,405 (18,106) 16.7% 0.9% 17.6% $14.65 $15.84 $14.70
Class A 0 0 0.0% 0.0% 0.0% $0.00 $0.00 $0.00
Class B 1,164,405 (18,106) 16.7% 0.9% 17.6% $14.65 $15.84 $14.70
I‐20 East/Conyers 1,586,426 (24,356) 13.4% 0.0% 13.4% $16.52 ‐ $16.52
Class A 54,338 0 46.5% 0.0% 46.5% $20.98 ‐ $20.98
Class B 1,532,088 (24,356) 12.2% 0.0% 12.2% $15.97 ‐ $15.97
l‐20West/Douglasville 1,082,523 (4,672) 12.2% 0.3% 12.6% $17.86 $22.00 $17.91
Class A 0 0 0.0% 0.0% 0.0% $0.00 $0.00 $0.00
Class B 1,082,523 (4,672) 12.2% 0.3% 12.6% $17.86 $22.00 $17.91
I‐85/Northeast 7,204,601 (50,990) 12.9% 1.5% 14.4% $17.42 $13.65 $17.03
Class A 1,443,006 14,345 13.7% 0.5% 14.2% $18.64 $15.63 $18.03
Class B 5,761,595 (65,335) 12.7% 1.7% 14.4% $17.14 $12.24 $16.75
l‐85/l‐285/Gwinnett 11,389,155 16,259 20.6% 0.4% 21.0% $17.66 $14.52 $17.49
Class A 3,297,023 (30,999) 27.3% 0.5% 27.8% $20.28 $14.38 $19.77
Class B 8,092,132 47,258 17.1% 0.3% 17.5% $15.46 $15.52 $15.46
Marietta/Kennesaw 4,515,952 17,013 17.1% 1.3% 18.4% $17.14 $15.99 $17.01
Class A 1,204,540 (4,274) 17.0% 2.1% 19.1% $21.18 $15.49 $20.03
Class B 3,311,412 21,287 17.1% 1.1% 18.2% $15.99 $16.37 $16.02
Norcross/Peachtree Corners 7,357,456 (26,324) 28.2% 1.5% 29.7% $15.69 $12.98 $15.37
Class A 2,083,906 (11,574) 20.7% 1.2% 21.8% $19.49 $13.14 $18.53
Class B 5,273,550 (14,750) 31.2% 1.7% 32.8% $14.23 $12.88 $14.09
North Fulton 22,410,933 (8,107) 18.1% 3.3% 21.4% $17.55 $14.25 $17.01
Class A 12,209,337 25,088 15.6% 4.1% 19.7% $20.05 $14.40 $18.78
Class B 10,201,596 (33,195) 21.1% 2.4% 23.5% $15.04 $13.80 $14.92
Northlake/Stone Mountain 3,199,321 (756) 20.4% 0.3% 20.7% $17.44 $14.99 $17.37
Class A 446,825 0 17.9% 1.1% 19.0% $19.59 $15.54 $19.10
Class B 2,752,496 (756) 20.8% 0.2% 21.0% $17.07 $13.75 $17.03
Atlanta 164,427,723 (80,797) 19.8% 1.7% 21.5% $19.76 $15.68 $19.37
Class A 92,356,961 218,695 20.7% 2.2% 22.9% $22.15 $16.38 $21.44
Class B 72,070,762 (299,492) 18.5% 1.1% 19.5% $16.18 $13.24 $16.01
* Costar ‐ Excludes non‐core markets and buildings