
Empfohlen
Weitere ähnliche Inhalte
Ähnlich wie Daily Report-May 5.pdf
Ähnlich wie Daily Report-May 5.pdf (20)
Mehr von BluechipInvestment
Mehr von BluechipInvestment (20)
Kürzlich hochgeladen
Kürzlich hochgeladen (20)
Daily Report-May 5.pdf
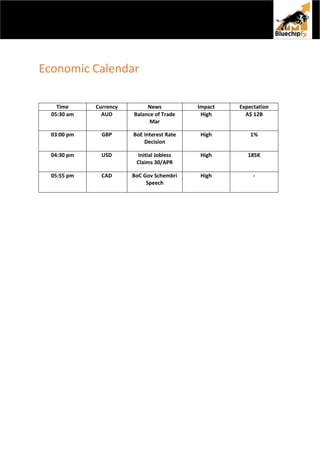
- 1. Economic Calendar Time Currency News Impact Expectation 05:30 am AUD Balance of Trade Mar High A$ 12B 03:00 pm GBP BoE Interest Rate Decision High 1% 04:30 pm USD Initial Jobless Claims 30/APR High 185K 05:55 pm CAD BoC Gov Schembri Speech High -
- 2. AUD/USD TREND: Bearish Technical Outlook: On the daily chart, AUD/USD indicate that buyers are interested to enter in the pair for a shorter duration. It is reaching towards its important resistance zone of 0.7320 still the 200-day exponential moving average capped immediate upside move. Indicators Daily chart Status RSI 46.77 Bearish STOCHASTIC 47.38 Bearish MACD Below midline Bearish 200 EMA 0.7317 Bearish Outlook Bearish Strategy Action Entry Target 1 Target 2 Stop Loss Buy 0.7220 0.7250 0.7280 0.7180
- 3. NZD/USD TREND: Bearish Technical Outlook: NZD/USD started the session on lower note as it breaks below 0.6450. Further it is inching lower to test 0.6400. A sell on rise opportunity is what traders would be looking for. Indicators Daily chart Status RSI 36 Bearish STOCHASTIC 31 Bearish MACD Below midline Bearish 200 EMA 0.6820 Bearish Outlook Bearish Strategy Action Entry Target 1 Target 2 Stop Loss Sell 0.6430 0.6400 0.6370 0.6460
- 4. EUR/USD TREND: Bearish Technical Outlook: EUR/USD looks dull as the fresh trading session begins. For short term, the currency pair is looking neutral either of the directions may extends. The larger picture stipulating that bears are driving the spot and would continue to maintained the oversold zone. Indicators Daily chart Status RSI 38.39 Bearish STOCHASTIC 30.90 Bearish MACD Below mid line Bearish 200 EMA 1.1289 Bearish Outlook Bearish Strategy Action Entry Target 1 Target 2 Stop Loss Sell 1.0620 1.0590 1.0560 1.0650 .
- 5. GBP/USD TREND: Bearish Technical Outlook: GBP/USD is trading with negative sentiments and slips below the psychological level of 1.2600, with intraday low of 1.2542. Strong bounce back from support zone was seen in previous trading session. Interested one should take entry above the level of $1.2640. Indicators Daily chart Status RSI 34.59 Bearish STOCHASTIC 23.04 Bearish MACD Below midline Bearish 200 EMA 1.3352 Bearish Outlook Bearish Strategy Action Entry Target 1 Target 2 Stop Loss Buy 1.2560 1.2590 1.2620 1.2530
- 6. USD/JPY TREND: Bullish Technical Outlook: USD/JPY is in correction mood after a long stint of Bull run. The pair is oscillating in a range of 128.30 -131.30 price level. It may start a bull journey after accumulating heavy volume from support zone to fly again. Indicators Daily chart Status RSI 64.40 Bullish STOCHASTIC 59 Bullish MACD Above midline Bullish 200 EMA 116.68 Bullish Outlook Bullish Strategy Action Entry Target 1 Target 2 Stop Loss Buy 129.30 129.60 120.90 129.0
- 7. USD/CAD TREND: Bullish Technical Outlook: On daily chart, the overall picture is looking bullish but heavy liquidation was seen near its sturdy resistance zone of 1.2915. Breakage and sustaining above the mentioned level would generate more buying opportunities. Indicators Daily chart Status RSI 52 Bullish STOCHASTIC 59 Bullish MACD Above midline Bullish 200 EMA 1.2654 Bullish Outlook Bullish Strategy Action Entry Target 1 Target 2 Stop Loss Buy 1.2730 1.2760 1.2790 1.2700
- 8. USD/CHF TREND: Bullish Technical Outlook: USD/CHF unlock the day on a dim note. As the previous day closing candlestick confirms selling pressure, and profit booking from upward direction. In a short term, a slight correction could be seen in the spot to initiate long position. Indicators Daily chart Status RSI 72 Bullish STOCHASTIC 71 Bullish MACD Above midline Bullish 200 EMA 0.9279 Bullish Outlook Bullish Strategy Action Entry Target 1 Target 2 Stop Loss Buy 0.9730 0.9760 0.9790 0.9700
- 9. GOLD TREND: Neutral Technical Outlook: XAU/USD started today’s session on a cheerful note. A strong upside momentum was seen in the previous trading session as the yellow metal is getting support from 200-day EMA. Currently, it is trading near $1900 level and consolidation on these surface may initiate buying prospects. Indicators Daily chart Status RSI 45.76 Bearish STOCHASTIC 34.61 Bearish MACD Below midline Bearish 200 EMA $1,861.40 Bullish Outlook Neutral Strategy Action Entry Target 1 Target 2 Stop Loss Buy $1,900 $1,910 $1,920 $1,890