1. Benjamin Gibson
11/14/14
BIO 332
Data assignment #4
1. In the summer flounder fishery, fisheries scientists strive for a fishing mortality rate of
F0.1 because it is much more sustainable than Fmax which allows much more prolonged
exploitation of the fishery. One might look at the differences Fmax and F0.1 have and think
that F0.1 is worse than Fmax due to the decreased yield per recruit, however, where it lacks
in yield per recruit it gains in spawning stock biomass (table 1). If the yield per recruit is
decreased enough, the spawning stock biomass will increase, allowing that stock to
remain at relatively healthy levels (fig. 1).
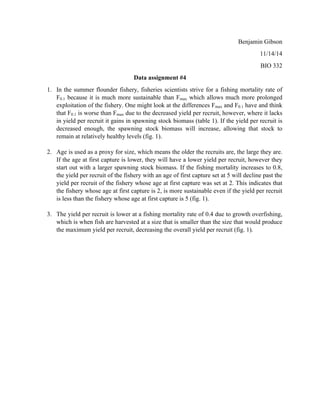
2. Age is used as a proxy for size, which means the older the recruits are, the large they are.
If the age at first capture is lower, they will have a lower yield per recruit, however they
start out with a larger spawning stock biomass. If the fishing mortality increases to 0.8,
the yield per recruit of the fishery with an age of first capture set at 5 will decline past the
yield per recruit of the fishery whose age at first capture was set at 2. This indicates that
the fishery whose age at first capture is 2, is more sustainable even if the yield per recruit
is less than the fishery whose age at first capture is 5 (fig. 1).
3. The yield per recruit is lower at a fishing mortality rate of 0.4 due to growth overfishing,
which is when fish are harvested at a size that is smaller than the size that would produce
the maximum yield per recruit, decreasing the overall yield per recruit (fig. 1).
2. tc = 2 Y/R (kg) SSB/R (kg)
Fmax 0.19 0.49 3.17
F0.1 0.13 0.47 4.10
tc = 5 Y/R (kg) SSB/R (kg)
Fmax 0.23 0.52 2.81
F0.1 0.16 0.48 3.68
Table 1. Stock data for a population of summer flounder at set ages at first capture (tc; years),
including the fishing mortality rate that maximizes yield per recruit (Fmax), the fishing mortality
where Y/R is 1/10th
of the origin’s slope (F0.1), the yield per recruit (Y/R; kg), spawning stock
biomass (SSB; kg).
3. 0.0
0.1
0.2
0.3
0.4
0.5
0.6
0.0
0.2
0.4
0.6
0.8
Y/R
(kg)
F
Tc
=
2
Tc
=
5
0
2
4
6
8
10
12
0.0
0.2
0.4
0.6
0.8
SSB/R
(kg)
F
Tc
=
2
Tc
=
5
A
B
Figure 1. (A) Yield per recruit (Y/R; kg) as a function of fishing mortality (F) in a
population of summer flounder comparing two different ages at first capture (tc; 2 and 5
years). (B) Spawning stock biomass (SSB; kg) as a function of fishing mortality (F) in a
population of summer flounder comparing two different ages at first capture (tc; 2 and 5
years). Recruitment ages when 2 is the age at first capture (tc = 2), stock contained 2-16 year
old summer flounder, and recruitment ages when 5 is the age at first capture (tc = 5), stock
contained 5-16 year old summer flounder.