Bay Area Economic Profile Chapter 4
•
1 gefällt mir•3,352 views

The Northern California Megaregion consists of 21 counties divided into two coastal and two inland regions. Unlike other megaregions, the Northern California Megaregion saw higher employment growth than population growth from 2008 to 2017. The four regions have different industry mixes. In San Francisco and Silicon Valley, job growth has far outpaced the permitting of new housing units. Home prices have risen substantially across the megaregion but are much higher in the core areas than outlying counties. The Bay Area has experienced net domestic out-migration in the last three years while Sacramento and the Northern San Joaquin Valley have seen migration increases. Many workers in the megaregion now commute long distances.

Empfohlen
Empfohlen
Weitere ähnliche Inhalte
Ähnlich wie Bay Area Economic Profile Chapter 4
Ähnlich wie Bay Area Economic Profile Chapter 4 (20)
Kürzlich hochgeladen
Kürzlich hochgeladen (20)
Bay Area Economic Profile Chapter 4
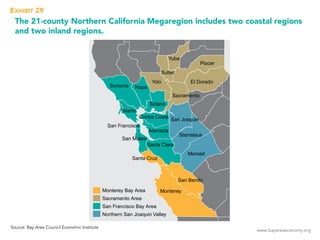
- 1. www.bayareaeconomy.org The 21-county Northern California Megaregion includes two coastal regions and two inland regions. EXHIBIT 29 Source: Bay Area Council Economic Institute
- 2. www.bayareaeconomy.org Unlike the Texas Triangle and Cascadia megaregions, the Northern California Megaregion’s employment growth rate was higher than its population growth rate between 2008 and 2017. EXHIBIT 30 Note: GRP=Gross Regional Product Source: Moody’s Analytics Analysis: Bay Area Council Economic Institute
- 3. www.bayareaeconomy.org The four regions within the Northern California Megaregion differ in their industry mixes. EXHIBIT 31 Source: California Employment Development Department Analysis: Bay Area Council Economic Institute
- 4. www.bayareaeconomy.org In San Francisco and Silicon Valley, growth in the number of housing units lags far behind job growth. 0 50,000 100,000 150,000 200,000 Jobs AddedHousing Units Permitted Yolo County Sacramento County San Joaquin Valley Placer County San Francisco Silicon Valley 200,364 Jobs Added Compared to Housing Units Permitted, 2007–2017 72,887 28,813 146,787 19,902 18,500 14,118 14,268 26,895 13,800 4,994 4,600 EXHIBIT 32 Sources: Association of Bay Area Governments Regional Housing Need Allocation Progress Reports; U.S. Department of Housing and Urban Development State of the Cities Data Systems; BLS Quarterly Census of Employment and Wages; California Employment Development Department; U.S. Census Bureau Building Permits Survey Analysis: Bay Area Council Economic Institute
- 5. www.bayareaeconomy.org Home prices have increased substantially across Northern California Megaregion counties, but wide gaps exist between the core and outlying areas. 730 525 636 853 1,121 2017 Santa Clara 20142005 +31% 20122009 374 178 177 268 333 Sacramento 484 298 284 378 452 +20% Placer 866 742 771 1,081 1,433 San Francisco +33% 656 381 430 650 855 +32% Alameda 389 159 169 254 343 +35% San Joaquin Median Home Prices in Key Northern California Megaregion Counties, $ Thousands 2009 2017201420122005 2009 20172014201220052009 20172014201220052009 2017201420122005 +24% EXHIBIT 33 Note: Data represents annual average median home price estimate in 2013 dollars. Data Source: National Association of Realtors, Moody’s Analytics Analysis: Bay Area Council Economic Institute and McKinsey & Company
- 6. www.bayareaeconomy.org The Bay Area’s domestic migration has turned negative in the last three years. EXHIBIT 34 Source: California Department of Finance Demographic Research Unit Analysis: Bay Area Council Economic Institute
- 7. www.bayareaeconomy.org In contrast to and partially as a result of out-migration from the Bay Area, the Sacramento Area and the Northern San Joaquin Valley have experienced net domestic migration increases in the past few years. EXHIBIT 35 Source: California Department of Finance Demographic Research Unit Analysis: Bay Area Council Economic Institute
- 8. www.bayareaeconomy.org A growing number of workers in the Northern California Megaregion are commuting long distances. EXHIBIT 36 Source: U.S. Census Bureau American Community Survey 2016 One-Year Estimates Analysis: Bay Area Council Economic Institute