Livingston Parish Louisiana Home Sales April 2013 vs April 2014
•
0 gefällt mir•403 views

Livingston Parish Louisiana Home Sales April 2013 vs April 2014 Based on information from Greater Baton Rouge Association of REALTORS® \MLS for period 04/01/2013 to 04/30/2013 to 04/01/2014 to 04/30/2014, extracted on 05/18/2014.

Empfohlen
Empfohlen
Weitere ähnliche Inhalte
Was ist angesagt?
Was ist angesagt? (20)
Andere mochten auch
Andere mochten auch (20)
Ähnlich wie Livingston Parish Louisiana Home Sales April 2013 vs April 2014
Ähnlich wie Livingston Parish Louisiana Home Sales April 2013 vs April 2014 (13)
Mehr von Bill Cobb, Appraiser
Mehr von Bill Cobb, Appraiser (20)
Kürzlich hochgeladen
Kürzlich hochgeladen (20)
Livingston Parish Louisiana Home Sales April 2013 vs April 2014
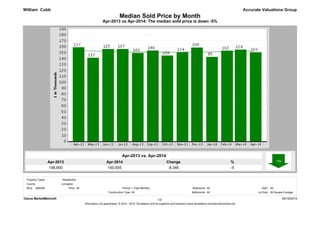
- 1. Apr-2014 150,555 Apr-2013 158,900 % -5 Change -8,345 Apr-2013 vs Apr-2014: The median sold price is down -5% Median Sold Price by Month Accurate Valuations Group Apr-2013 vs. Apr-2014 William Cobb Clarus MarketMetrics® 05/19/2014 Information not guaranteed. © 2014 - 2015 Terradatum and its suppliers and licensors (www.terradatum.com/about/licensors.td). 1/2 MLS: GBRAR Bedrooms: All All Construction Type: All1 Year Monthly SqFt: Bathrooms: Lot Size:All All Square Footage Period:All County: Property Types: : Residential Livingston Price:
- 2. Median Sold Price by Month Apr-2013 vs Apr-2014: The median sold price is down -5% Accurate Valuations GroupWilliam Cobb Sold Median Price Units Avg DOMTime Period Apr-14 150,555 150 104 Mar-14 155,000 124 122 Feb-14 153,250 102 102 Jan-14 142,700 85 89 Dec-13 158,500 108 80 Nov-13 150,524 124 91 Oct-13 145,000 109 101 Sep-13 153,464 140 84 Aug-13 149,450 160 94 Jul-13 156,000 137 77 Jun-13 156,000 125 90 May-13 141,250 132 93 Apr-13 158,900 137 74 Clarus MarketMetrics® 05/19/2014 Information not guaranteed. © 2014 - 2015 Terradatum and its suppliers and licensors (www.terradatum.com/about/licensors.td). 22/
- 3. Apr-2013 vs Apr-2014: The median price of for sale properties is up 2% and the median price of sold properties is down -5% Accurate Valuations Group Apr-2013 vs. Apr-2014 159,250 2 William Cobb 162,000 Apr-2014 Median For Sale vs Median Sold ChangeApr-2013 % 2,750 Apr-2013 Apr-2014 % 158,900 -5 Apr-2013 vs. Apr-2014 150,555 Change -8,345 Clarus MarketMetrics® 05/19/2014 Information not guaranteed. © 2014 - 2015 Terradatum and its suppliers and licensors (www.terradatum.com/about/licensors.td). 1/2 MLS: GBRAR Bedrooms: All All Construction Type: All1 Year Monthly SqFt: Bathrooms: Lot Size:All All Square Footage Period:All County: Property Types: : Residential Livingston Price:
- 4. Median For Sale vs Median Sold Apr-2013 vs Apr-2014: The median price of for sale properties is up 2% and the median price of sold properties is down -5% Accurate Valuations GroupWilliam Cobb For SaleMedian SoldMedian For Sale # Properties # PropertiesSold Price Difference Time Period Apr-14 943 150162,000 150,555 -11,445 Mar-14 947 124160,000 155,000 -5,000 Feb-14 904 102159,900 153,250 -6,650 Jan-14 889 85155,000 142,700 -12,300 Dec-13 910 108155,265 158,500 3,235 Nov-13 985 124157,900 150,524 -7,376 Oct-13 1,045 109159,000 145,000 -14,000 Sep-13 1,014 140159,000 153,464 -5,536 Aug-13 1,012 160155,950 149,450 -6,500 Jul-13 987 137156,500 156,000 -500 Jun-13 964 125156,450 156,000 -450 May-13 925 132157,900 141,250 -16,650 Apr-13 920 137159,250 158,900 -350 Clarus MarketMetrics® Information not guaranteed. © 2014 - 2015 Terradatum and its suppliers and licensors (www.terradatum.com/about/licensors.td). 05/19/201422/
- 5. Apr-2014 150 Apr-2013 137 % 9 Change 13 Apr-2013 vs Apr-2014: The number of Sold properties is up 9% Sold Properties by Month Accurate Valuations Group Apr-2013 vs. Apr-2014 William Cobb Clarus MarketMetrics® 05/19/2014 Information not guaranteed. © 2014 - 2015 Terradatum and its suppliers and licensors (www.terradatum.com/about/licensors.td). 1/2 MLS: GBRAR Bedrooms: All All Construction Type: All1 Year Monthly SqFt: Bathrooms: Lot Size:All All Square Footage Period:All County: Property Types: : Residential Livingston Price:
- 6. Sold Properties by Month Apr-2013 vs Apr-2014: The number of Sold properties is up 9% Accurate Valuations GroupWilliam Cobb Time Period Units Median Price Avg DOM Apr-14 150,555150 104 Mar-14 155,000124 122 Feb-14 153,250102 102 Jan-14 142,70085 89 Dec-13 158,500108 80 Nov-13 150,524124 91 Oct-13 145,000109 101 Sep-13 153,464140 84 Aug-13 149,450160 94 Jul-13 156,000137 77 Jun-13 156,000125 90 May-13 141,250132 93 Apr-13 158,900137 74 Clarus MarketMetrics® 05/19/2014 Information not guaranteed. © 2014 - 2015 Terradatum and its suppliers and licensors (www.terradatum.com/about/licensors.td). 22/
- 7. Apr-2014 200 Apr-2013 141 % 42 Change 59 Apr-2013 vs Apr-2014: The number of Under Contract properties is up 42% Under Contract Properties by Month Accurate Valuations Group Apr-2013 vs. Apr-2014 William Cobb Clarus MarketMetrics® 05/19/2014 Information not guaranteed. © 2014 - 2015 Terradatum and its suppliers and licensors (www.terradatum.com/about/licensors.td). 1/2 AllBathrooms: SqFt: All : Residential All Square FootageConstruction Type: Lot Size:GBRAR Livingston Period: 1 Year Monthly Price: MLS: All AllAll Property Types: Bedrooms: County:
- 8. Under Contract Properties by Month Apr-2013 vs Apr-2014: The number of Under Contract properties is up 42% Accurate Valuations GroupWilliam Cobb Units Avg DOMMedian PriceTime Period Apr-14 164,900200 96 Mar-14 159,900172 90 Feb-14 149,100113 121 Jan-14 155,265113 118 Dec-13 156,50087 98 Nov-13 161,225112 77 Oct-13 158,500124 94 Sep-13 150,950108 102 Aug-13 154,900145 75 Jul-13 149,150126 80 Jun-13 164,950126 93 May-13 157,000121 89 Apr-13 154,900141 89 Clarus MarketMetrics® 05/19/2014 Information not guaranteed. © 2014 - 2015 Terradatum and its suppliers and licensors (www.terradatum.com/about/licensors.td). 22/
- 9. Apr-2014 226 Apr-2013 244 % -7 Change -18 Apr-2013 vs Apr-2014: The number of New properties is down -7% New Properties by Month Accurate Valuations Group Apr-2013 vs. Apr-2014 William Cobb Clarus MarketMetrics® 05/19/2014 Information not guaranteed. © 2014 - 2015 Terradatum and its suppliers and licensors (www.terradatum.com/about/licensors.td). 1/2 MLS: GBRAR Bedrooms: All All Construction Type: All1 Year Monthly SqFt: Bathrooms: Lot Size:All All Square Footage Period:All County: Property Types: : Residential Livingston Price:
- 10. New Properties by Month Apr-2013 vs Apr-2014: The number of New properties is down -7% Accurate Valuations GroupWilliam Cobb Units Median PriceTime Period Apr-14 159,975226 Mar-14 166,900215 Feb-14 169,900188 Jan-14 153,500145 Dec-13 149,900113 Nov-13 152,900140 Oct-13 150,720203 Sep-13 159,900212 Aug-13 154,900215 Jul-13 159,000207 Jun-13 154,900219 May-13 154,950202 Apr-13 161,900244 Clarus MarketMetrics® 05/19/2014 Information not guaranteed. © 2014 - 2015 Terradatum and its suppliers and licensors (www.terradatum.com/about/licensors.td). 22/
- 11. Apr-2014 943 Apr-2013 920 % 3 Change 23 Apr-2013 vs Apr-2014: The number of For Sale properties is up 3% For Sale Properties by Month Accurate Valuations Group Apr-2013 vs. Apr-2014 William Cobb Clarus MarketMetrics® 05/19/2014 Information not guaranteed. © 2014 - 2015 Terradatum and its suppliers and licensors (www.terradatum.com/about/licensors.td). 1/2 MLS: GBRAR Bedrooms: All All Construction Type: All1 Year Monthly SqFt: Bathrooms: Lot Size:All All Square Footage Period:All County: Property Types: : Residential Livingston Price:
- 12. For Sale Properties by Month Apr-2013 vs Apr-2014: The number of For Sale properties is up 3% Accurate Valuations GroupWilliam Cobb Units Avg DOMMedian PriceTime Period Apr-14 162,000943 132 Mar-14 160,000947 137 Feb-14 159,900904 146 Jan-14 155,000889 154 Dec-13 155,265910 150 Nov-13 157,900985 136 Oct-13 159,0001,045 127 Sep-13 159,0001,014 127 Aug-13 155,9501,012 124 Jul-13 156,500987 125 Jun-13 156,450964 125 May-13 157,900925 127 Apr-13 159,250920 126 Clarus MarketMetrics® 05/19/2014 Information not guaranteed. © 2014 - 2015 Terradatum and its suppliers and licensors (www.terradatum.com/about/licensors.td). 22/
- 13. Apr-2014 62 Apr-2013 56 % 11 Change 6 Apr-2013 vs Apr-2014: The number of Expired properties is up 11% Expired Properties by Month Accurate Valuations Group Apr-2013 vs. Apr-2014 William Cobb 05/19/2014Clarus MarketMetrics® 1/2 MLS: GBRAR Bedrooms: All All Construction Type: All1 Year Monthly SqFt: Bathrooms: Lot Size:All All Square Footage Period:All County: Property Types: : Residential Livingston Price:
- 14. Expired Properties by Month Apr-2013 vs Apr-2014: The number of Expired properties is up 11% Accurate Valuations GroupWilliam Cobb Avg DOMUnits Median Price Apr-14 159,95062 270 Mar-14 158,40058 173 Feb-14 164,90059 194 Jan-14 167,95060 196 Dec-13 150,00079 177 Nov-13 153,25076 178 Oct-13 174,94976 157 Sep-13 154,45064 173 Aug-13 144,90065 167 Jul-13 166,40064 201 Jun-13 164,00058 168 May-13 157,90059 159 Apr-13 186,25056 153 Clarus MarketMetrics® 05/19/2014 Information not guaranteed. © 2014 - 2015 Terradatum and its suppliers and licensors (www.terradatum.com/about/licensors.td). 22/
- 15. Apr-2013 vs Apr-2014: The number of for sale properties is up 3% and the number of sold properties is up 9% Accurate Valuations Group Apr-2013 vs. Apr-2014 920 3 William Cobb 943 Apr-2014 Supply & Demand by Month ChangeApr-2013 % 23 Apr-2013 Apr-2014 % 137 9 Apr-2013 vs. Apr-2014 150 Change 13 Clarus MarketMetrics® 05/19/2014 Information not guaranteed. © 2014 - 2015 Terradatum and its suppliers and licensors (www.terradatum.com/about/licensors.td). 1/2 MLS: GBRAR Bedrooms: All All Construction Type: All1 Year Monthly SqFt: Bathrooms: Lot Size:All All Square Footage Period:All County: Property Types: : Residential Livingston Price:
- 16. Supply & Demand by Month Apr-2013 vs Apr-2014: The number of for sale properties is up 3% and the number of sold properties is up 9% William Cobb Accurate Valuations Group For Sale Sold # Properties Avg DOM Avg DOM # Properties Time Period Apr-14 132 104943 150 Mar-14 137 122947 124 Feb-14 146 102904 102 Jan-14 154 89889 85 Dec-13 150 80910 108 Nov-13 136 91985 124 Oct-13 127 1011,045 109 Sep-13 127 841,014 140 Aug-13 124 941,012 160 Jul-13 125 77987 137 Jun-13 125 90964 125 May-13 127 93925 132 Apr-13 126 74920 137 Clarus MarketMetrics® 05/19/2014 Information not guaranteed. © 2014 - 2015 Terradatum and its suppliers and licensors (www.terradatum.com/about/licensors.td). 22/
- 17. Apr-2014 96 Apr-2013 89 % 8 Change 7 Apr-2013 vs Apr-2014: The average days on market is up 8% The Average Days on Market by Month Accurate Valuations Group Apr-2013 vs. Apr-2014 William Cobb Livingston All 1 Year Monthly County: Period:Price: Property Types: : Residential 05/19/20141/2Clarus MarketMetrics® All Square Footage Bedrooms: All AllSqFt: All Lot Size:Bathrooms:AllConstruction Type: MLS: GBRAR
- 18. The Average Days on Market by Month Apr-2013 vs Apr-2014: The average days on market is up 8% Accurate Valuations GroupWilliam Cobb # UC UnitsAvg DOMTime Period Apr-14 20096 Mar-14 17290 Feb-14 113121 Jan-14 113118 Dec-13 8798 Nov-13 11277 Oct-13 12494 Sep-13 108102 Aug-13 14575 Jul-13 12680 Jun-13 12693 May-13 12189 Apr-13 14189 Clarus MarketMetrics® 2/2 05/19/2014 Information not guaranteed. © 2014 - 2015 Terradatum and its suppliers and licensors (www.terradatum.com/about/licensors.td).
- 19. Apr-2013 vs Apr-2014: The average months supply of inventory is down -34% Accurate Valuations Group Apr-2013 vs. Apr-2014 5.1 -34 William Cobb 3.4 Apr-2014 Months Supply of Inventory ChangeApr-2013 % -1.7 Clarus MarketMetrics® 05/19/2014 Information not guaranteed. © 2014 - 2015 Terradatum and its suppliers and licensors (www.terradatum.com/about/licensors.td). 1/2 MLS: GBRAR Bedrooms: All All Construction Type: All1 Year Monthly SqFt: Bathrooms: Lot Size:All All Square Footage Period:All County: Property Types: : Residential Livingston Price:
- 20. Months Supply of Inventory Apr-2013 vs Apr-2014: The average months supply of inventory is down -34% William Cobb Accurate Valuations Group During MonthLast Day of Month MSI # Units For Sale # UC Units UC Avg DOMTime Period Apr-14 200 96681 3.4 Mar-14 172 90717 4.2 Feb-14 113 121732 6.5 Jan-14 113 118716 6.3 Dec-13 87 98744 8.6 Nov-13 112 77797 7.1 Oct-13 124 94845 6.8 Sep-13 108 102842 7.8 Aug-13 145 75802 5.5 Jul-13 126 80797 6.3 Jun-13 126 93780 6.2 May-13 121 89745 6.2 Apr-13 141 89723 5.1 Clarus MarketMetrics® 05/19/2014 Information not guaranteed. © 2014 - 2015 Terradatum and its suppliers and licensors (www.terradatum.com/about/licensors.td). 22/