Kojak Metrics Explained
•Als PPTX, PDF herunterladen•
0 gefällt mir•1,287 views

Explains the Kojak metrics in simple examples.

Empfohlen
Weitere ähnliche Inhalte
Was ist angesagt?
Was ist angesagt? (20)
Ähnlich wie Kojak Metrics Explained
Ähnlich wie Kojak Metrics Explained (20)
Kürzlich hochgeladen
Kürzlich hochgeladen (20)
Kojak Metrics Explained
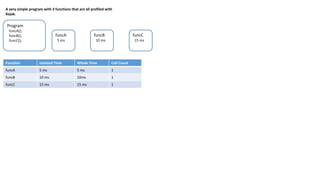
- 1. A very simple program with 3 functions that are all profiled with Kojak. Program funcA(); funcB(); funcC(); funcA funcB 10 ms 5 ms funcC 15 ms Function Isolated Time Whole Time Call Count funcA 5 ms 5 ms 1 funcB 10 ms 10ms 1 funcC 15 ms 15 ms 1
- 2. Now funcA calls funcB once and funcB calls funcC once. See how the whole times increase for funcA and funcB? Whole time is the functions time plus any other functions that are invoked. Program funcA(); funcA 5 ms funcB 1 funcC 1 10 ms Function Isolated Time Whole Time Call Count funcA 5 ms 30 ms 1 funcB 10 ms 25 ms 1 funcC 15 ms 15 ms 1 15 ms
- 3. Now funcB calls funcC 5 times. The whole time increases for funcA and funcB. Note that the sum of the whole times and isolated times. The sum of the isolated times is the true measured time of how long the program took to run. (in some situations this isn’t accurate. Discussed in later example) The sum of the whole times is a nonsense number that doesn’t really tell you anything useful. Program funcA(); funcA 5 ms funcB 1 funcC 5 10 ms Function Isolated Time Whole Time Call Count funcA 5 ms 90 ms 1 funcB 10 ms 85 ms 1 funcC 75 ms 75 ms 5 Sum 90 ms 250 ms ??? 7 15 ms
- 4. Now we’ve added another function funcD that also calls funcB once. Notice how the call count, isolated and whole times changed. Whole time really just tells you how much time it took for a function and all of the other functions the original function spawned took to execute. The whole time for funcA is high but it’s isolated time is low. That tells you it is spawning other functions that are taking a lot of time. It could be because funcA is calling other functions too many times or it could be that the other functions are slow etc. Program funcA funcA(); funcD(); 5 ms funcC funcB 1 5 10 ms funcD 3 ms 1 Function Isolated Time Whole Time Call Count funcA 5 ms 90 ms 1 funcD 3 ms 88 ms 1 funcB 20 ms 170 ms 2 funcC 150 ms 150 ms 10 15 ms
- 5. In this example, funcExt is a function that is not profiled by Kojak. This could be because you’ve purposely ignored the function or it’s a vendor library (jQuery etc.) that you have not profiled with Kojak. Notice how funcC’s isolated time is 325 ms. This is because Kojak doesn’t know how much time funcExt took to execute so it isn’t subtracted from funcC. Program funcA(); funcA 5 ms funcB 1 funcC 5 10 ms Function Isolated Time Whole Time Call Count funcA 5 ms 340 ms 1 funcB 10 ms 335 ms 1 funcC 325 ms 325 ms 5 15 ms funcExt 1 50 ms
- 6. This is just like the previous example but funcC calls an internally accessible anonymous function. Kojak cannot access or profile anonymous functions that are not exposed via accessible packages / classes / prototypes. Example of anonymous function: mypackage.funcC = function(){ // body of funcC var anonymousFunction = function(){ // etc – takes 50 ms }; anonymousFunction(); }; Program funcA(); funcA 5 ms funcB 1 funcC 5 10 ms Function Isolated Time Whole Time Call Count funcA 5 ms 340 ms 1 funcB 10 ms 335 ms 1 funcC 325 ms 325 ms 5 15 ms Anonymous function 1 50 ms
- 7. Asynchronous function calls and network requests are typically not included in isolated or whole times. In this example, spawning funcC takes 0 ms but the asynchronous code in funcC takes 15 ms. The asynchronous code does not block funcB. Program funcA(); funcA 5 ms funcB 1 funcC (asynchronous) 5 10 ms Function Isolated Time Whole Time Call Count funcA 5 ms 15 ms 1 funcB 10 ms 10 ms 1 funcC 0 ms 0 ms 5 15 ms
- 8. Synchronous network calls are handled just like anything else in Kojak. They are included in isolated and whole time Program funcA(); funcA 5 ms funcB 1 synchronousNetworkCall 5 10 ms Function Isolated Time Whole Time Call Count funcA 5 ms 90 ms 1 funcB 10 ms 85 ms 1 funcC 75 ms 75 ms 5 15 ms
- 9. Un-profiled functions are not included in the total sum isolated time. See how the sum isolated time is 130 ms but the program actually took 180 ms to run? It’s because funcExt1 isn’t included in the totals for isolated time. But funcExt2 is included because a profiled function (funcD) invoked it. Un-profiled functions are only included in isolated time measurements if one of the calling functions has been profiled by Kojak. funcA Program funcB 1 5 ms funcA(); funcExt1(); funcExt1 funcC 5 10 ms funcD 50 ms 1 15 ms funcExt2 1 15 ms Function Isolated Time Whole Time Call Count funcA 5 ms 90 ms 1 funcB 10 ms 85 ms 1 funcC 75 ms 75 ms 5 funcD 40 ms 40 ms 1 Sum 130 ms - 7 25 ms
- 10. Isolated times do not include when the user isn’t doing anything. Isolated time is when profiled code is actually executing. In this example, the programs shows a dialog and then listens for a button click event. When the user clicks a button the onButtonClick function is invoked. The user clicks the button 3 times in this example. Down time while the user is waiting to click the button is not included in any of the metrics. Program showDialog showDialog(); 5 ms Event listener 3 onButtonClick 10 ms Function Isolated Time Whole Time Call Count showDialog 5 ms 35 ms 1 onButtonClick 30 ms 30 ms 3 Sum 35 ms - 4