The Beijing Axis on Africa's Mining Future - Mining Indaba, February 2014
•
0 gefällt mir•604 views

Kobus van der Wath, Founder and Group Managing Director of The Beijing Axis, presented on 'China and Asia's Role in Africa's Mining Future' during the Investing in African Mining Indaba conference in Cape Town, 4 February 2014.

Empfohlen
Weitere ähnliche Inhalte
Was ist angesagt?
Was ist angesagt? (17)
Ähnlich wie The Beijing Axis on Africa's Mining Future - Mining Indaba, February 2014
Ähnlich wie The Beijing Axis on Africa's Mining Future - Mining Indaba, February 2014 (20)
Kürzlich hochgeladen
Kürzlich hochgeladen (20)
The Beijing Axis on Africa's Mining Future - Mining Indaba, February 2014
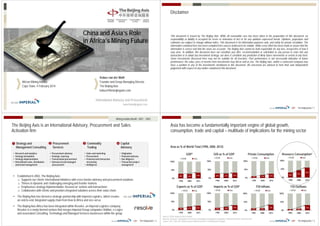
- 1. Disclaimer China and Asia’s Role in Africa’s Mining Future This document is issued by The Beijing Axis. While all reasonable care has been taken in the preparation of this document, no responsibility or liability is accepted for errors or omissions of fact or for any opinions expressed herein. Opinions, projections and estimates are subject to change without notice. This document is for information purposes only, and solely for private circulation. The information contained here has been compiled from sources believed to be reliable. While every effort has been made to ensure that the information is correct and that the views are accurate, The Beijing Axis cannot be held responsible for any loss, irrespective of how it may arise. In addition, this document does not constitute any offer, recommendation or solicitation to any person to enter into any transaction or to adopt any investment strategy, nor does it constitute any prediction of likely future movements or events in any form. Some investments discussed here may not be suitable for all investors. Past performance is not necessarily indicative of future performance; the value, price or income from investments may fall as well as rise. The Beijing Axis, and/or a connected company may have a position in any of the investments mentioned in this document. All concerned are advised to form their own independent judgement with respect to any matter contained in this document. Kobus van der Wath Founder and Group Managing Director, The Beijing Axis kobus@thebeijingaxis.com African Mining Indaba Cape Town, 4 February 2014 International Advisory and Procurement www.thebeijingaxis.com The Beijing Axis 1 Mining Indaba Booth: 3401 - 3403 The Beijing Axis is an International Advisory, Procurement and Sales Activation firm 1 Strategy and 2 Procurement Management Consulting • • • • Research and analytics Strategy formulation Strategy implementation International sales, distribution and brand management Services • • • • Procurement advisory Strategic sourcing Transactional procurement Outsourced and managed procurement 3 Commodity Asia has become a fundamentally important engine of global growth, consumption, trade and capital – multitude of implications for the mining sector 4 Capital Trading • Sales and marketing • Procurement • Financial and transaction structuring • Intelligence Asia as % of World Total (1990, 2000, 2012) Advisory • • • • Origination Financial advisory Due diligence Transaction project management GDP1 ROW GDI as % of GDP ROW Asia Private Consumption Asia ROW Resource Consumption2 ROW Asia 100% 100% 50% 50% 50% 28% 26% 2000 2012 0% Exports as % of GDP ROW 28% 27% 32% 1990 34% 1990 0% 2000 2012 11% 17% 25% 1990 0% 2000 2012 Imports as % of GDP ROW Asia 30% 1990 FDI Inflows Asia ROW 2000 ROW 100% 100% 2012 50% 50% Asia 100% 50% 14% 21% 26% 1990 0% The Beijing Axis 2 59% FDI Outflows Asia 50% • The Beijing Axis Africa has been integrated within Resolve, an Imperial Logistics company. Resolve is a newly formed venture that merges Imperial Group companies Volition, e-Logics and associated Consulting, Technology and Managed Services businesses within the group 43% 0% 100% • The Beijing Axis has formed a strategic partnership with Imperial Logistics, which creates an end-to-end, integrated supply chain from Asia to Africa and vice versa Asia 100% 50% • Established in 2002, The Beijing Axis: o Supports our clients’ international initiatives with cross-border advisory and procurement solutions o Thrives in dynamic and challenging emerging and frontier markets o Emphasises strategy implementation, focused on ‘actions and transactions’ o Collaborates with clients and provides integrated solutions across their value chain 100% 2000 2012 0% 13% 19% 29% 1990 2000 2012 12% 13% 1990 2000 0% Note (1): ‘ROW’ stands for Rest of World Note (2): ‘Resource Consumption’ refers to the consumption of agricultural commodities, mineral and metals, and fossil fuels Source: CEIC; CRU; UN; Chatnam House; Market Research; The Beijing Axis Analysis 33% 0% 2012 7% 10% 1990 2000 31% 2012 The Beijing Axis 3
- 2. At the highest level Agenda China/Asia is still important Largest consumer; large producer; capital provider and investor; supplier of equipment and services Mining industry executives must think and act differently Africa can/must leverage Asia’s rise to transform itself Attract capital for beneficiation; expand downstream skillsets / activity; develop long-term, well managed, mutually beneficial strategic relationships Downstream supply chain; inbound supply chain; strategy, planning and operational excellence; cost management, competition, partnering 1. 2. 3. 4. China/Asia Remains Key to Global Resource Demand China/Asia is a Key Commodity Buyer, Source of Capital and Inbound Supply Chain Partner Implications for Africa/Global Mining Final Word The Beijing Axis 4 Source: The Beijing Axis Analysis The divergence of GDP growth between developed and developing economies will persist – overall, Asian economies are set to progress & China growth above 7% is sustainable over short to medium term The Beijing Axis 5 China’s GDP of 9.4 tn accounts for ~12% of the global economy – China, India and Indonesia account for 40% of developing markets’ GDP Four high-level drivers GDP Growth Rate Comparison for Selected Economies (%, 2010-2016F) 12% World Developed Economies Developing Economies 100% China Japan India Indonesia 70% 60% China India Indonesia Developing 6% World Developed 3% Japan grew at -0.6% in 2011 Japan Source: IMF; The Beijing Axis Analysis 40% 30% Others Africa Canada Italy Russia Brazil U.K. France Germany Japan China 20% 10% USD 27 tn Other Developed Countries 2011 2012 2013E 2014F 2015F 2016F The Beijing Axis 6 USD 8.2 tn USD 8.2 tn USD 8.2 tn Others Southwest Developed Asia* Australia Other Developing Countries Africa Other Developing Asia Indonesia India Hunan Hubei Sichuan Liaoning Hebei Henan Zhejiang Tertiary Industry Private Consumption Expenditure South Secondary Industry Shandong China China World GDP in 2012 World GDP in 2012 GDP in Developing Countries 2012 Note*: Developed Asia includes Japan, South Korea, Taiwan, Singapore and Hong Kong Source: IMF; National Bureau of Statistics of China; The Beijing Axis Analysis Jiangsu Guangdong USD 8.2 tn Net Exports Govt. Consumption Expenditure Northeast North Latin America Africa U.S. Other Developing Countries 0% 0% 2010 50% USD 72 tn Northwest 80% China: 7.5+% in 2014 ~7% over ensuing 3 years 9% 90% USD 72 tn In 2013, China grew at 7.7% to a GDP of USD 9.4 tn East Gross Capital Formation Primary Industry China GDP China GDP China GDP China GDP 2012 2012 2012 2012 Regional dynamics….Industry breakdown…Expenditure approach The Beijing Axis 7
- 3. China and India’s economic growth will remain prominent – they will add significant nominal GDP over the next few years, yet the type of growth will differ China’s and India’s Forecast Nominal GDP (USD bn, 2012-2035F*) Box indicates additional nominal GDP from now to forecast year 2016F 2020F 2025F 2030F 2035F China adds 1 Africa China adds 2.8 Africa China adds 5.4 Africa China adds 8.6 Africa China adds 12.9 Africa India adds 1.3 India adds 3.5 Growth Moderation Phase 35,000 Year 20122015F 2016F2025F China India 7.5% 6% 6.5% 7.5% China 6.0% 7.0% 18,913 5,655 25,000 2012-2015 2012 Asia Coal China ROW Asia Refined Copper China 100% Asia 4% 12% 1990 100% ROW China 50% 14% 18% 2000 2000 50% 50% 45% 50% 45% 2012 4% 17% 1990 0% 2000 7% 0% 2012 1990 41% 22% 2000 0% 2012 2012 Refined Nickel 100% ROW Asia Chrome Ore China ROW Asia Refined Zinc China 100% ROW 100% Asia Gold China 100% ROW Asia China 2017F: China adds 1 Germany 2012-2027 2022F: India’s economy doubles 2015F: India adds 1 South Africa 2017 2015F Note*: Forecast GDP growth rate for each period listed in the graph above Source: IMF; The Beijing Axis Analysis 2020F 2022 2025F 2027 2027F: India adds 1 Germany 2033F: India adds 1 Japan 50% 50% 4% 2000 0% 2012 13% 17% 1990 13% 1990 2030F 2032 50% 50% 48% 41% 0% 2000 8% 20% 1990 2000 0% 2012 46% 7% 16% 1990 0% 2012 2000 28% 2012 2035F The Beijing Axis 8 Agenda 1. 2. 3. 4. ROW 2029F: China adds 1 US 2012-2033 0 Primary Aluminium China 100% 1990 2012-2029 2022F: China’s economy doubles 2012-2017 Asia* 50% 2027F: China adds 2 Japans 2012-2022 10,000 5,000 100% ROW* Growth Moderation Phase 0% 2012-2027 2012-2022 Steel China India 20,000 15,000 China/Asia’s Share of Global Consumption of Selected Commodities (% 1990, 2000, 2012) India adds 18.5 Drive to Maturity Phase India Continued Acceleration GDP Per Capita 2035F (USD) 2026F2035F 30,000 India adds 11.8 Sustainable Growth Phase India Accelerating Growth 40,000 India adds 7.1 China China/Asia has dramatically increased its share of world consumption of key metals and minerals over the last two decades – this will not change Note*: ‘ROW’ stands for Rest of World, ‘Asia’ does not include China Source: World Bank; CNBS; CEIC; Various; The Beijing Axis Analysis The Beijing Axis 9 Asia’s resource demand is reflected in the rapid increase of its mineral imports – China is a significant player Mineral imports reflect all mineral products excluding mineral fuels, oils, waxes & bituminous sub Top 15 Global Mineral Importers (2012)* China/Asia Remains Key to Global Resource Demand Mineral Imports/Total Imports (%) Bubble Size: Mineral Imports = 20 bn 9% China/Asia is a Key Commodity Buyer, Source of Capital and Inbound Supply Chain Partner 8% China 7% Implications for Africa/Global Mining Mineral imports account for a significant proportion of total imports for Asian countries 6% Final Word Japan 5% 3% Spain 2% Italy 1% USA 0% 0% 5% China The Beijing Axis 10 South Korea Finland 4% India Belgium UK China’s Mineral Imports (USD bn) Germany Canada 2002 2007 2012 CAGR (2002-2012) 5.2 57.1 140.1 39.1% Russia France Netherlands 10% Asian Countries 15% 20% 25% Other Countries Note*: ‘Mineral Imports’ includes HS Code 25 and 26 (all mineral products excluding mineral fuels, oils, waxes & bituminous sub) Source: UN Comtrade; The Beijing Axis Analysis 30% 35% 40% 45% Mineral Imports CAGR (%, 2002-2012) The Beijing Axis 11
- 4. China imports a substantial share of the total mineral exports of Australia, Brazil and South Africa – rest of Africa’s potential still untapped? China is seeking to derive 50% of its iron ore imports from Chinese-invested sources by 2020 – expect more international investment going forward Top 15 Global Sources (Exporters) of China’s Minerals (2012)* Imported Iron Ore Owned by China (mn tons, 02-13E) Mineral Exports to China/Total Mineral Exports (%) Bubble Size: Mineral Exports to China = 5 bn 80% 70% 60% 50% 40% 30% 20% 10% China will continue to step-up its iron ore investments as it aims to achieve an iron ore self-sufficiency ratio of 50% by 2020 900 800 Top 5 sources have remained the same China’s Top Mineral Imports Sources (2002-2012) 2002 Rank 1 Australia 2 Brazil 3 Chile 4 Peru 5 South Africa 6 Canada 7 USA 8 Japan 9 Turkey 10 India 20% 2012 Australia Brazil South Africa Chile Peru India Canada Kazakhstan Indonesia Russia 25% Kazakhstan Chile USA 35% Asian Countries 300 Mexico Russia 45% • Chinese companies spent USD 1.2 bn on iron ore deals in 2013, down from the five-year peak of USD 2.7 bn in 2010 200 Proximity is not a major consideration for China, as countries from the Americas also account for substantial imports 40% • China imported 819 million tonnes in 2013, an increase of 10.2% from 2012 400 Turkey Peru Rest of Africa* Canada 500 Indonesia Brazil • China Iron Steel Association announced that China would seek to derive 40% of ore imports from Chinese-invested sources by 2015 and 50% by 2020 600 South Africa Ukraine 30% African Countries Australia – NDRC, 27 January 2014 China imports twothirds of its iron ore 700 India 100 0 50% 55% 60% Mineral Exports to China CAGR (%, 2002-2012) Other Countries Note*: ‘Mineral Imports’ includes HS Code 25 and 26 (all mineral products excluding mineral fuels, oils, waxes & bituminous sub) Source: UN Comtrade; The Beijing Axis Analysis The Beijing Axis 12 “China needs to invest more in overseas mining projects to improve its pricing power” 02 03 04 05 06 07 08 09 10 11 12 13E Imported Iron Ore Owned by China Others • It is estimated that Chinese-invested overseas sources will bring in 100 to 200 million tonnes of iron ore annually over the next three to five years • Australia and Africa will remain the key focus markets for iron ore investments The Beijing Axis 13 Source: Various; China Steel Association; The Beijing Axis Analysis China/Asia is gradually becoming a prominent source of FDI - China’s OFDI stock is expected to reach approximately USD 700 billion by 2015; annual outflows as high as USD 130 billion are expected by 2015-16 China’s overseas mining investments are becoming a global trend - Australia, Canada and a few selected countries in Africa have been the key focus OFDI Flows by Region (USD mn; 1992, 2002, 2012) Map of Selected Chinese Mining Investments Overseas by Country and Value (2005–2013) 1,400 1,200 1,000 800 600 Asian economies, led by China, Malaysia and India, are significant investors in Africa 1,391 bn Oceania Europe North America China’s share of Asia’s OFDI Latin America has increased from 1.5% in 1992 to 19.4% in 2012 Africa Asia 531 bn Flows 17% 13% 2002 Source: UNCTAD; The Beijing Axis Analysis Asia OFDI CAGR: 13.5% Stock 700.0 32 600 500 400 550.8 In 2012 alone, China invested in 1,309 overseas projects in 128 countries 31% 2012 100 0 460.6 383.4 317.2 300 245.8 184.0 200 203 bn 1992 0 800 700 400 200 China OFDI Stock and Flows (USD bn, 2002-2015F) 57.2 29.9 33.2 44.8 90.6 117.8 90.2 02 03 04 05 06 07 08 09 10 11 12 13 15F The Beijing Axis 14 Investments in Canada are two fold: 1) Investments in Canadian companies with assets in Canada or overseas 2) Investments in Chinese companies that are registered in Canada Investments in Europe are primarily focused on companies with assets outside of Europe Canada 4 2 2 2 US Colombia Russia Mongolia Krygyzstan Sierra Leone 4 1 2 1 3 Brazil Philippines Indonesia DR Congo Namibia 1 Investments in Africa have been small in number but large in size 1 4 Malaysia 3 Liberia 2 Peru 12,500 2,500 500 100 25 Eritrea 1 Ecuador Total Value of Deals (USD mn) 1 2 2 9 Singapore 67 Zambia South Africa Note: Number mentioned in circle indicates total number of deals: these deals range from 2005-2013 and only include completed transactions Source: Various; The Beijing Axis Analysis Australia is the leading destination for Chinese overseas investment in mining Australia The Beijing Axis 15
- 5. Over the last decade, China’s exports of major mining equipment and machinery have grown rapidly as the country transitions towards manufacturing high-value goods Developing Asia’s global exports of major mining equipment and machinery have also grown rapidly – China leads, but alternatives are rising Analysis of China’s Exports of Top Mining Equipment* (2012) Analysis of Developing Asia’s1 Exports of Top Mining Equipment2 (2012) Accounts for 61% of the export CAGR Export CAGR for the period 2001-2012 (%) 60% 50% 30% Film – Plain Industrial Power Engine Parts Special Process Transmission/ Gearboxes Equipment & Packages Paints/Marine Coatings 0% 0% 5% Fixed Plant & Equipment Cranes & Spares Light Mobile Equipment 30% Steel Shot & Steel Balls 20% Drilling Machine Parts 10% 10% 15% Mobile Equipment 20% Hydraulic Excavators Industrial Engines Drilling Machine Parts A bubble of this size represents total export value of USD 5 bn Paints/Marine Coatings Industrial Engine Parts 0% 30% Production Consumables Note*: The top 5 mining-related products in each product category based on total global traded value were selected for comparison Source: UN Comtrade; The Beijing Axis Analysis 35% MRO Consumables 40% 45% 50% Global Market Share (%) The Beijing Axis 16 Agenda Power Transmission/ Gearboxes Instrumentation and Automation Special Process Equipment & Packages Cathodes 25% On-road Passenger Vehicles Compressors Packaging Pot Shells and Superstructure Engines and Generators Represents considerable shift towards the right 40% On-road Passenger Steel and Vehicles Structural Products Cathodes 60% 50% Instrumentation and Automation Compressors 40% 10% A bubble of this size represents total export value of USD 5 bn Front End Loaders Industrial Engines Hydraulic Excavators 20% Export CAGR for the period 2001-2012 (%) 0% 5% 10% Fixed Plant & Equipment Steel Shot & Steel Balls Film – Plain Cranes & Spares 15% Mobile Equipment Front End Loaders 20% Engines and Generators Pot Shells and Superstructure 25% Production Consumables Light Mobile Equipment Packaging 30% Steel and Structural Products 35% 40% MRO Consumables Note: (1) ‘Developing Asia’ includes both developing and emerging Asian economies as per the economic classification (2) The top 5 mining-related products in each product category based on total global traded value were selected for comparison Source: UN Comtrade; The Beijing Axis Analysis 45% 50% Global Market Share (%) The Beijing Axis 17 Implications for mining players and executives in Africa/globally are clear Mining Industry Executives Must Think and Act Differently 1. 2. 3. 4. China/Asia Remains Key to Global Resource Demand • Appreciate the value of strategic intelligence – get close, be informed and strategy led China/Asia is a Key Commodity Buyer, Source of Capital and Inbound Supply Chain Partner Implications for Africa/Global Mining • Strategic marketing becomes crucial – get closer to the customer • Gear for the new model in inbound supply chain management – capital equipment and services, and operations and MRO procurement from Asia Final Word • Capital choices now relate to a different network – attract strategic capital from China/Asia • Understand, evaluate and adapt partnership and collaborative models for Africa/the world The Beijing Axis 18 Source: The Beijing Axis Analysis The Beijing Axis 19
- 6. Implications for mining players and executives in Africa/globally are clear mining industry executives must think and act differently Africa can benefit from China/Asia’s dominant position - leverage Asia’s rise to transform its position along the commodity industry value chain High-level Commodity Industry Value Chain High-level Commodity Industry Value Chain 1 1 Project Scoping/ Development 2 3 Mine/Process 4 Trading House/ Intermediary 5 Refiner and Smelter Upstream Strategic market intelligence must be the goal, attracting strategic capital and CAPEX sourcing must be the differentiator Manufacturer/ Customer Upstream Downstream Utilising Chinese/Asian services, operating cost/MRO management and strategic partnerships become crucial Strategic marketing gives an advantage: sell directly to the right customer and in an active relationship framework Source: The Beijing Axis Analysis Partner and/or collaborate with Asian players, and attract capital for beneficiation i.e. export value add instead of ore The Beijing Axis 20 2 3 4 Trading House/ Intermediary Mine/Process 5 Refiner and Smelter Manufacturer/ Customer Downstream Africa’s future position? • Develop strategic relationships/sell directly to refiners/smelters Own end user relationships, develop longterm relationships and understand the variability, volatility and exceptions • Develop long-term, well managed, mutually beneficial relationships with Chinese/Asian partners, competitors and stakeholders • Attract capital from China/Asia for beneficiation - export value add instead of ore • Attract capital from China/Asia to develop infrastructure to support refining/smelting projects • Expand skillsets along the downstream value chain The Beijing Axis 21 Source: The Beijing Axis Analysis China/Asia’s rise to prominence has altered the global industry landscape – multiple implications for the mining industry Summary Agenda China/Asia Remains Key to Global Resource Demand China/Asia Remains Key to Global Resource Demand China/Asia is a Key Commodity Buyer, Source of Capital and Inbound Supply Chain Partner • Developing economies in Asia are transforming the global economic landscape Implications for Africa/Global Mining Final Word • Asian countries are important trading partners for Africa/the world • China has led Asia’s growth story China/Asia is a Key Commodity Buyer, Source of Capital and Inbound Supply Chain Partner Key Messages 1. 2. 3. 4. Project Scoping/ Development • China/Asia continues to be the largest importer of commodities and minerals • China merely represents one facet of the Asia story – India and Indonesia are other prominent developing Asian economies • China/Asia‘s appetite for resources will continue on an upward curve over the next horizon and beyond The Beijing Axis 22 Source: The Beijing Axis Analysis • China/Asia is becoming a global source of capital, especially for the mining and energy sector • China/Asia stands out as a key sourcing destination for a large number of mining categories, packages, and products Implications for Africa/Global Mining • Appreciate the value of strategic intelligence • Strategic marketing becomes crucial – get closer to the customers • Gear for new models in inbound supply chain management • Capital choices now relate to a different network – attract strategic capital from China/Asia • Understand, evaluate and adapt partnership and collaborative models for Africa The Beijing Axis 23
- 7. At the highest level International Advisory and Procurement China/Asia is still important Largest consumer; large producer; capital provider and investor; supplier of equipment and services Comprehensive View Source: The Beijing Axis Analysis Mining industry executives must think and act differently Downstream supply chain; inbound supply chain; strategy, planning and operational excellence; cost management, competition, partnering Strategic Advantage Africa can/must leverage Asia’s rise to transform itself Attract capital for beneficiation; expand downstream skillsets / activity; develop long-term, well managed, mutually beneficial strategic relationships Development Trajectory The Beijing Axis 24 Beijing The Beijing Axis Phoenix Place Tower A, Unit 2306-2307, 5A Shuguang Xili, Chaoyang, Beijing 100028, China Tel: +86 10 6440 2106 china@thebeijingaxis.com THANK YOU! Singapore The Beijing Axis Group Level 42, Suntec Tower 3, 8 Temasek Boulevard, 038988 Singapore Tel: +65 6829 2189 singapore@thebeijingaxis.com Perth The Beijing Axis Level 11 Brookfield Place, 125 St Georges Terrace, Perth, Western Australia 6000, Australia Tel: +61 8 6189 8637 australia@thebeijingaxis.com Mumbai The India Axis (a member company) Level 7, Vibgyor Towers, Bandra Kurla Complex, Bandra (East), Mumbai 400072, India Tel: +91 88 0063 9399 india@thebeijingaxis.com Johannesburg The Beijing Axis Africa Gijima Office Park, Jupiter Building, 47 Landmarks Avenue, Kosmosdal, Samrand, South Africa Tel: + 27 (0) 12 492 1001 southafrica@thebeijingaxis.com COPYRIGHT© The Beijing Axis Ltd. 2014. No part of this publication may be reproduced or transmitted in any form or by any means without prior written consent of The Beijing Axis. Kobus van der Wath Founder and Group Managing Director, The Beijing Axis kobus@thebeijingaxis.com www.thebeijingaxis.com