Bhawanipatna Call Girls 📞9332606886 Call Girls in Bhawanipatna Escorts servic...
Mhs 2010
1. October 18, 2010 HEALTH SERVICES (DRUGS WHOLESALE)
Henry Fund Research
MedcoHealth Solutions (MHS) Investment Recommendation BUY
Jared Plotz, Healthcare Analyst Current Price $53.33
jared-plotz@uiowa.edu Target Price Range $64-68
INVESTMENT THESIS
MedcoHealth Solutions provides clinically-driven pharmacy
services designed to improve the quality of care and lower
total healthcare costs for its clients and their members. The
company has maintained impressive revenue and earnings
growth over the last 7 years and we recommend acquiring
the company below $58, for the following reasons:
(+) Generic drug utilization has and will continue to
grow as additional brand name drugs come off patent
in future years, physicians’ willingness to prescribe
generics increases, and patients’ desire for lower cost
generic drugs increases.
(+) International expansion in Europe using Medco’s
services model, will increase sales while increasing
margins. Service margins garner 7+% gross margins
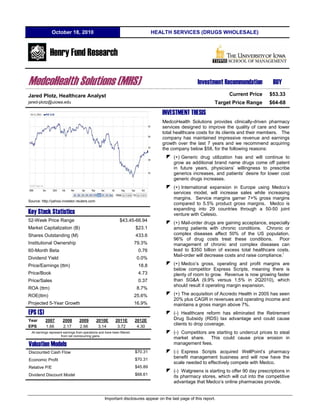
Source: http://yahoo.investor.reuters.com
compared to 5.5% product gross margins. Medco is
expanding into 29 countries through a 50-50 joint
Key Stock Statistics venture with Celesio.
52-Week Price Range $43.45-66.94
(+) Mail-order drugs are gaining acceptance, especially
Market Capitalization (B) $23.1 among patients with chronic conditions. Chronic or
Shares Outstanding (M) 433.6 complex diseases affect 50% of the US population.
96% of drug costs treat these conditions. Poor
Institutional Ownership 79.3% management of chronic and complex diseases can
60-Month Beta 0.76 lead to $350 billion of excess total healthcare costs.
i
Mail-order will decrease costs and raise compliance.
Dividend Yield 0.0%
Price/Earnings (ttm) 18.8 (+) Medco’s gross, operating and profit margins are
below competitor Express Scripts, meaning there is
Price/Book 4.73 plenty of room to grow. Revenue is now growing faster
Price/Sales 0.37 than SG&A (9.9% versus 1.5% in 2Q2010), which
should result it operating margin expansion.
ROA (ttm) 8.7%
ROE(ttm) 25.6% (+) The acquisition of Accredo Health in 2005 has seen
20% plus CAGR in revenues and operating income and
Projected 5-Year Growth 16.9% maintains a gross margin above 7%.
EPS ($) (-) Healthcare reform has eliminated the Retirement
Year 2007 2008 2009 2010E 2011E 2012E Drug Subsidy (RDS) tax advantage and could cause
EPS
clients to drop coverage.
1.66 2.17 2.66 3.14 3.72 4.30
All earnings represent earnings from operations and have been filtered (-) Competitors are starting to undercut prices to steal
from net nonrecurring gains.
market share. This could cause price erosion in
Valuation Models management fees.
Discounted Cash Flow $70.31 (-) Express Scripts acquired WellPoint’s pharmacy
$70.31 benefit management business and will now have the
Economic Profit
scale needed to effectively compete with Medco.
Relative P/E $45.89
(-) Walgreens is starting to offer 90 day prescriptions in
Dividend Discount Model $68.61
its pharmacy stores, which will cut into the competitive
advantage that Medco’s online pharmacies provide.
Important disclosures appear on the last page of this report.
2. THE UNIVERSITY OF IOWA
Henry Fund Research Henry B. Tippie School of Management
EXECUTIVE SUMMARY
MedcoHealth Solutions is a Fortune 50 company that was
spun off from Merck in March 2003 and has maintained a
20% CAGR in earnings per share over the following 7 years.
It is the largest of the 3 big pharmacy benefit managers
(PBMs) by drug spending and has over 65 million members.
While Medco’s competitors have maintained short short-term
outlooks and have undercut Medco prices in recent years to
gain market share, they have fallen behind significantly in
Source: Medco 2009 Annual Report
their value proposition. Not only has Medco continued to
drive growth and profits like its competitors, but at the same In 2007, Medco acquired Liberty Medical Supply, Inc. to tap
time, Medco has invested heavily in growth drivers for 2014
avily into the growing diabetes care services market. Diabetes
and beyond. Medco is now well positioned to succeed long patients represent 8% of the US population and account for
iii
after the current generic growth wave slows in 4 years.
4-5 15 percent of overall drug spending.
We have initiated a Buy recommendation with a 12 month
ave The company currently has international exposure in Sweden,
price target of $64-68 for Medco’s stock, representing 20-27% Germany, and the UK, and will soon be expanding to Italy,
ny,
upside over Medco’s current trading price. We believe in the France, and Spain. The company’s new joint venture with
growth strategies that Medco is pursuing and believe that it Celesio will eventually expand service to all of the EU27
has the ability to drive out its competitors and possibly
rive member nations, Norway, and Sweden.
consolidate the industry in years to come. The company was
not significantly negatively impacted during the recession and
should experience positive growth regardless of the economic
ess RECENT DEVELOPMENTS
environment going forward.
Earnings Report
In the second quarter of 2010, Medco reported record EPS of
COMPANY DESCRIPTION $0.77 versus $0.64 in the same quarter last year, reflecting an
Medco is a pharmacy benefit management services company increase of 20.3%. Diluted EPS was $0.83, also a 20.3%
that provides prescription drug benefit programs designed to increase. Net revenues for the quarter were $16.4 billion, a
moderate the cost and enhance the quality of pharmacy 9.9% increase over last year.
health care. The company has secured more than $5 billion in net net-new
“Medco’s products and services include benefit design and sales in 2010 and has completed roughly 95% of the 2010
Medco’s
management, pharmacy network management, clinical planned renewals as of July 22. The company still maintains
management, specialty pharmacy solutions, diabetes a 99%+ client retention rate which is driven by the company’s
management, home healthcare products and Medicare high customer satisfaction rate. Competitor Express Scripts
specialists and client services. It offers a w
ices. wide spectrum of has completed more than half of its 2011 client renewals, but
benefit design options for appropriately sharing costs between is only experiencing a 95% client retention rate, indicating
haring
plan sponsors and enrollees, and provides proper incentives inferior service quality or value proposition compared to
for encouraging preferential use of more cost cost-effective Medco.
treatments (OTC and generics) and pharmacies (In (In-network The company has also secured $1.0 billion in 2011 net
y net-new
ii
retail, mail-order, and special care).” sales, and completed roughly 45% of its scheduled 2011
The company operates nine PBM mail-order facilities and six renewals as of July 22. The company’s generic dispensing
order
call center pharmacies. Medco’s Therapeutic Resource rate was 70.6% in the quarter up from 67.3% in the same
Centers meet the complex needs of people with chronic quarter last year. Adjusted prescripti prescription volumes were up
medical conditions including diabetes, cancer, heart disease, 6.0% and its mail-order penetration declined 0.1%.
order
and asthma. Medco employs more than 1,000 speci specialty The increased use of generics in 2Q2010 translates into
pharmacists in these centers. record savings to clients and member of approximately $870
members
Product revenues contributed 98.5% of revenues in 2009, million, as well as increasing average margins for Medco.
while service revenues contributed the other 1.5%. Of The earnings report was not spectacular, given that they still
e
product revenues, 62% are sold through retail pharmacies, have significant pressure to fill their 2011 book in the next two
ues,
while 38% are sold via Medco’s mail-order pharmacies quarters, but it was not bad either. The fact that their
order pharmacies.
Competitor Express Scripts sells 65% of prescriptions through retention rate has not declined indicates that a large portion of
retail, and 35% through mail order. A further breakdown of their long-term contract renewals will come in the 2nd half of
revenues is attached to this report. the year.
Medco is the nation’s largest purchaser of generic drugs. Share Repurchases
Medco’s primary wholesaler, AmericsourceBergen Corp.
accounted for approximately 62% of overall 2009 drug Medco completed its prior $3 billion stock repurchase
purchases. The rest of drug purchases come directly from program in the quarter, and has repurchased $696.5 million of
pharmaceutical manufacturers. the company’s new $3 billion repurchase program started in
May 2010. The company purchased more than anticipated
010.
2
3. THE UNIVERSITY OF IOWA
Henry Fund Research Henry B. Tippie School of Management
stock in the quarter due to the lower share prices. In 1Q2010, Generics have driven Medco’s leading industry drug trend,
the company repurchased at an average stock price of drug trend being decreasing drug costs. Below is Medco’s
$45.38. In 2Q2010, the company repurchased at an average revenues and dispensing rate for generic drugs over the last 5
stock price of $58.14. After the company finishes its latest years:
buyback program, it will have repurchased 23% of
outstanding shares over 3 years.
Margins and Cash
Gross margin declined in the quarter due to client renewal
pricing, higher retail volumes, and a decline in the Accredo
subsidiary’s gross margin, partially offset by generic growth
and a litigation settlement. Gross margin for the second half
of the year should be slightly higher than 6.7% and should
average 6.7% for the FY2010.
Cash on the balance sheet has declined because of stock
repurchases. Cash flow from operations has declined due to
significant inventory reduction and strong retail claim volume
growth in 2009.
rd
While we may see a soft 3 quarter due to seasonality in the v
MedcoHealth Solutions 2009 Annual Report
business, we expect a strong finish to 2010 with record
EBITDA and operating margin improvement of 8 basis points. Revenues continued to maintain their healthy climb during the
economic recession, partly due to a rise in the generic
The company has revised its FY2010 EPS guidance upwards
dispensing rate (which garner higher margins for Medco), and
to $3.10-3.15/share, from $3.05-3.10/share previously. Our
$17 billion in net new revenue in the last 3 years.
model forecasts earnings of $3.14/share in 2010.
Healthcare Reform
This rise in generic dispensing rate will continue in the next 4-
Healthcare reform does not significantly hurt Medco’s 5 years as additional brand name drugs come off patent as
business operations. The expanded coverage of 30 million demonstrated in the chart below. This trend will enable
additional Americans will provide increased demand (volume) generic dispensing rates to continue to climb, as well as
for Medco’s services. Additionally President Obama’s push Medco’s margins, due to higher rates on generics.
for low-cost healthcare and efficient healthcare solutions will
prove beneficial to Medco’s positioning strategy.
In the Medicare space, the newly enacted reform stripped
away the tax advantage of the Retiree Drug Subsidy (RDS),
which could cause some clients to drop or limit retiree
prescription drug coverage. However 1/3 of current RDS
clients are tax-exempt entities, therefore only 2/3 are at risk of
dropping coverage.
INDUSTRY TRENDS
“PBMs emerged in the 1980s, primarily to provide cost-
effective drug distribution and claims processing for the
healthcare industry. The PBM industry further evolved in
response to the significant escalation of healthcare costs in
the 1990s, as benefit plan sponsors sought to more
aggressively contain costs. PBMs developed strategies to vi
effectively influence both supply and demand. MedcoHealth Solutions BMO Capital Market Presentations Materials
On the supply side, PBMs leverage their buying power (size Medco is on the forefront of industry innovation, distancing
of networks) to negotiate purchase discounts and rebates itself from its competitors and positioning itself as a complete
from manufacturers, and discounts from distributors and retail solution for its clients’ members’ needs. The company is the
pharmacies. leading specialty pharmacy and mail-order pharmacy in the
world. It is also a leader in clinical innovation, leveraging its
On the demand side, PBMs educate clients, members and therapeutic resource centers and research in drug-to-drug
physicians on cost-effective prescription medications and and drug-to-OTC interactions.
apply various techniques to encourage members to make
cost-effective choices, such as the use of less expensive
generic drugs and the more efficient mail-order channel. The company is best-in-class and will continue to define the
Generic substitution for drugs on which patents have expired industry and be the leader in industry innovation going
is a significant and growing factor in reducing costs.”
iv forward.
3
4. THE UNIVERSITY OF IOWA
Henry Fund Research Henry B. Tippie School of Management
Medco is on par with the Select Average in price, but falls
MARKETS AND COMPETITION short of the average in operating and profit margins. We
There are three main competitors in the PBM space: Medco, believe this will change as Medco increasingly leverages its
Express Scripts, and CVS Caremark. Express Scripts services business, which maintains 7+% gross margins
purchased WellPoint’s PBM business to become roughly the compared to roughly 5.5% for its product business.
same size as Medco. Medco and Express Scripts both ate
into CVS’s market share in the last few years, but CVS looks ECONOMIC OUTLOOK
to take back some of what it lost, in the 2011 selling season.
The economic outlook for the US is neutral due to high
In addition to competing with the other two big PBMs, Medco unemployment, decreased per capita wealth resulting from
competes with a wide variety of market participants, including continued trouble in the housing market, and high federal and
regional and local PBMs, Blue Cross/Blue Shield plans, state budget deficits.
insurance companies, managed care organizations, large
retail pharmacy chains, large retail stores and supermarkets While the healthcare industry traditionally remains stable in
with in-store pharmacy operations and Internet pharmacies. times of economic distress, which was seen at the bottom in
Its main competitors are Aetna Inc., CIGNA Corporation, CVS March 2009, the industry has lagged the overall sideways
Caremark Corporation, Express Scripts Inc., Humana Inc., market since the beginning of 2010.
UnitedHealth Group, Walgreen Co., and Wal-Mart Stores Inc. The passage of President Obama’s healthcare plan lifted
Medco competes primarily in designing and administering some uncertainty in the sector, but has also resulted in
programs and services that provide flexible and high quality increasing costs to companies.
prescription drug benefit management to clients and members Outlined below is a list of economic drivers that have an effect
at competitive pricing to the plan sponsor. on the healthcare industry:
Medco believes that its commitment to differentiating itself Unemployment
from its competitors will drive success after the generic wave US Change in NonFarm Employment & Unemployment Rate Launc h full data release
passes. Its competitors do not have an international 600
(DI FF 1M) All Emplo yees, T housands Total Nonf arm SA - United Stat es (Left)
Unemployment Rate - Percent , Sa - United Stat es (Left)
Unemployment Rate - Percent , SA - Unit ed St ates (Right)
Recession Periods - United Stat es
11%
presence, an online store and personal drug management 400
10%
system, or real-time drug-to-drug and drug-to-OTC safety 200
checks, among other competitive advantages.
9%
0
8%
Below are tables of operating and valuation statistics for -200
7%
Medco’s competitors, as well as a table comparing Medco to -400
a select industry average. -600
6%
5%
-800
Company Market Cap (B) Revenue (B) P/E (ttm) P/E (fye)
-1,000 4%
Aetna 12.81 34.65 8.71 9.65 10/ 07 1/ 08 4/ 08 7/ 08 10/ 08 1/ 09 4/ 09 7/ 09 10/09 1/ 10 4/ 10 7/ 10
CIGNA 9.64 19.71 7.95 7.73 viii
42.44 98.23 11.99 10.38
Source: FactSet Economic Chartbook
CVS Caremark
Express Scripts 26.20 36.26 27.57 15.28 Unemployment has declined slightly from its high of 10.1% in
Humana 8.61 32.44 7.50 8.89 October 2009, but has steadily remained above 9.5% over the
UnitedHealth 38.62 89.94 9.24 9.76 last 62+ weeks. A slight increase of 0.1% month over month
Walgreen 32.66 67.42 16.05 11.76 in August indicates that high unemployment is showing no
Wal-Mart 197.86 416.66 13.97 12.39
signs of abating. Henry Fund consensus estimate is for
Company P/S P/B Op. Margin Profit Margin
unemployment to stay at approximately 9.4% for the next 6
Aetna 0.37 1.24 7.30% 4.46% months and in the 8-9% range for the next 2 years. High
CIGNA 0.49 1.62 10.29% 6.27% unemployment is bad for all aspects of consumer spending,
CVS Caremark 0.44 1.21 6.49% 3.73% including healthcare. However it increases the need for cost
Express Scripts 0.72 7.20 5.08% 2.68% reduction practices and services provided by Medco.
Humana 0.26 1.30 5.94% 3.55%
GDP Growth
UnitedHealth 0.43 1.54 7.97% 4.77%
Gross Domestic Produc t, Real %Chg P /P - United States
Walgreen 0.48 2.26 5.13% 3.10% 6
Wal-Mart 0.47 3.07 6.08% 3.54%
4
vii
2
The highlighted competitors above are used in the Select
Average below. 0
-2
Industry Average Industry Median Select Average Medco
Market Cap 46.11 29.43 33.77 22.82 -4
Revenue 99.41 51.84 67.30 62.76
-6
P/E (ttm) 12.87 10.62 18.54 18.56
P/E (fye) 10.73 10.07 12.47 13.39 -8
7/07 10/07 1/08 4/08 7/08 10/08 1/09 4/09 7/09 10/09 1/10 4/10 7/10
P/S 0.46 0.46 0.55 0.36
P/B 2.43 1.58 3.56 4.72 Source: FactSet Economic Chartbook
Op. Margin 6.79% 6.29% 5.57% 3.75%
Profit Margin 4.01% 3.64% 3.17% 2.16%
4
5. THE UNIVERSITY OF IOWA
Henry Fund Research Henry B. Tippie School of Management
Real GDP growth, a barometer for the health of the economy management fees to gain market share. This could hurt the
and the deciding indicator of expansion or contraction, has PBM space going forward.
declined from its peak at 5.00% Y-o-Y growth in December
US Dollar
2009. In June 2010, growth stood at 1.6%, and we see
2H2010 growth of 1.5%. This is bad news for the general Trad e W eigh ted U S$ v s. Maj or Curren cies
Nominal Trade-W eighted Exchange Rate Index, Major Currenc ies, 3/1973=100 - United States
market as the speed of the recovery is slowing and fears of 95
Real Trade-Weighted Exchange Rate Index, Major Currenc ies, 3/1973=100 - United States
Recess ion Periods - United States
95
slipping back into negative growth are still present. These
fears could cause customers to once again cut back
90 90
expenditures, increasing drug non-compliance. 85 85
Consumer Spending/Confidence 80 80
Real Personal Cons umption Expenditures, Bil. Chained 2005 $, Saar - United S tates
9,400
75 75
9,350
70 70
9,300
65 65
10/07 1/08 4/08 7/08 10/08 1/09 4/09 7/09 10/09 1/10 4/10 7/10 10/10
9,250
Source: FactSet Economic Chartbook
9,200
The US dollar has fallen from its highs in March 2009. As
9,150 international investors braced for the worse, money poured
into the US dollar, considered the safest currency and
government bonds available. But as the recovery has
9,100
10/07 1/08 4/08 7/08 10/08 1/09 4/09 7/09 10/09 1/10 4/10 7/10
gathered steam and US stimulus activities have widened the
Source: FactSet Economic Chartbook
national debt, investors have slowly left the dollar. We see
Consumer spending has thus far seen a V-shaped recovery. the dollar remaining weak for the next 2 years. In a weak
After bottoming in April of 2009, the US consumer has dollar environment, multinational companies based in the US
aggressively purchased goods. This purchasing is partly due benefit the most. At the same time, domestic companies also
to federal stimulus, including President Obama’s Cash for fare well. Multinationals can trade their foreign sales for more
Clunkers automobile program and his First-time Home Buyer US dollars, while domestic companies see an increase in
Credit. Both of these programs have ended, and yet exports, due to increased demand for the now cheaper
spending has not seen the fall that some experts predicted. goods.
This will be a key indicator to watch going forward. Any signs
Both of these aspects should help Medco, especially in
of a decrease in spending could indicate more trouble to
relation to their competitors. Medco’s new joint venture with
follow, but may actually increase the use of generic drugs, a
Celesio should provide favorable currency exchange profits.
key Medco strategy.
Forward estimates of the direction of the dollar are unreliable
Inflation and so we will have to wait and see.
Housing
US Existing H ome Sales Launch full data release
%Chg Y r A go Millions of Units
50% 7.5
(% 1Y R) Exis ting Home Sales , Housing Units, S AAR - United S tates (Left)
Exis ting Home Sales , Hous ing Units, SAAR - United States / 1000000 (Right)
Recess ion Periods - United States
40% 7.0
30% 6.5
20% 6.0
10% 5.5
0% 5.0
-10% 4.5
-20% 4.0
3.83
-25.49
Source: FactSet Economic Chartbook -30%
'01 '02 '0 3 '0 4 '05 '06 '07 '08 '0 9 '10
3.5
Inflation has been very tame throughout the last year. Source: FactSet Economic Chartbook
Inflation has established itself in the 2% range for most of
2010. Fears of deflation have yet to be founded and runaway After showing a strong recovery in late 2009, 2010 has seen a
inflation has yet to be seen. severely sharp decline in the housing market. Not only do
housing prices continue to fall, but existing home sales and
As of now, it appears that inflation in the 1.5-2.5% range new home sales continue to fall as well, and foreclosure rates
should be expected going forward. This has no significant hit an all-time decade high in August 2010. The stimulus
effect on Medco’s operations. In terms of industry pricing, the effects of the First-time Home Buyer Credit have elapsed and
healthcare sector has seen vast differences. Drug pricing has subsequently the housing market has fallen.
been declining. Medco is part of this decline as they push for
drug trend. At the same time as some of Medco’s The housing market is showing few signs of turning around
competitors, such as CVS Caremark, have been cutting and many economists see further declines. While this
economic driver doesn’t directly affect Medco’s business
5
6. THE UNIVERSITY OF IOWA
Henry Fund Research Henry B. Tippie School of Management
lines, the housing market affects almost all aspects of the increasing steadily around 300 basis points per year and
economy indirectly. Until a sustained turnaround in the Medco earns a higher margin on generics.
housing market is seen, we expect GDP, consumer spending,
and investor confidence to continue crawling sideways. This Generics sales grew 12% in 2Q2010 and the dispensing
means that demand for drug trend (cost reductions) will rate grew 330 basis points. Generics likewise encourage
increase and subsequently demand for Medco’s services. compliance among patients by decreasing drug costs.
Specialty Pharmacy: Accredo has seen tremendous
success over the last 5 years. It is a key in profitability for
CATALYSTS FOR GROWTH the company (contributing $450 million to net income in
2010) and in its breadth of services (making Medco all-
Current Drivers encompassing). Clients like using Accredo and have
Financial Strategy: Medco has squeezed significant cash incentives to use Accredo. Not only is Accredo’s care
out of the balance sheet, is increasing ROIC, and can pay superior to competitors, but it is also cheaper.
interest payments 15 times with current cash. Future Drivers
New Business: A lot of high retail Medicare business; $1.0 MedcoHealth Store: Medco’s online store provides a
billion in net new sales for 2011 and 45% of renewals virtual channel for patients to purchase non-prescription
already completed. Retention rate above 99%. products, with the ability to utilize mail delivery while
Mail-Order: Medco is the largest mail-order pharmacy in utilizing Medco’s safety analysis in interactions between
the world. They already have two distribution facilities in prescription drugs and OTC drugs, vitamins, and
xiii
Las Vegas and New Jersey, and are opening a third in supplements.
Indianapolis this year. Each facility is capable of filling 1 International: In addition to the previous strategies in
million prescriptions/week, meaning they now have Germany and the UK, Medco is in Sweden and is soon to
capacity to fill 156 million prescriptions/year. be in 29 different countries in Europe through its 50-50
Mail-order will revolutionize the drug distribution for joint venture with Celesio. In Sweden, Medco transformed
chronic conditions. 50% of the US population has chronic its software to Swedish, converted drug metrics, and has
and complex diseases. 96% of drug costs treat these licensed its software to the Swedish government to wire
conditions.
ix
75% of medical expenses in the US are drug retail in the country.
x
spent on chronic conditions. And for 88% of chronic and Europe has price controls, and so Medco’s joint venture
st xi
complex diseases, drugs are the 1 choice. will focus on its service model. Medco’s service model
Mail-order will significantly decrease the costs for patients currently maintained gross margins of 7+%, and so any
with these chronic conditions. This will help close the expansion in service revenues will greatly expand the
gaps in non-compliance. There are up to 50% non- company’s overall margins.
compliance rates after one-year of therapy in many Europe is interested in technology enabled clinical
disease categories. Costs are a major contributor to this capabilities that they currently don’t have. Medco will
since these drugs cost patients thousands of dollars a improve the quality of care and lower overall healthcare
year. This will save healthcare billions of dollars. costs for payors through the joint venture. The 29
As compliance rates increase, costs per user decrease, as countries have a combined GDP greater than that of the
shown in the following chart: US.
ePrescribing: Medco is transforming what the web
experience means to a consumer. In the future, Medco
plans on putting applications on the iPhone and Verizon’s
Blackberry that will allow for e-prescriptions. This will
transform what a patient and a physician do in the office.
Clinical Innovations: Through 15 Medco Therapeutic
Resource Centers, customers can interact with Medco
specialist pharmacists in their exact disease condition. If a
patient receives a warning that two drugs they are
planning on taking or have been prescribed should not be
taken together or should be watched more closely, the
patient will get a warning message and ask the patient if
they would like a phone call to discuss. If the patient
enters their phone number, a pharmacist that specializes
xii
MedcoHealth Solutions BMO Capital Market Presentations Materials
in the patients’ precise conditions will call within 60
seconds and give real-time advice to the patient.
Generics: Generics have a strong pipeline of drugs
coming off patent in the next 5 years, especially in 2012. Comparable Effectiveness: In 2009, the company
Medco encourages plan members to utilize generic drugs. established the Medco Research Institute, which will
There has been an increase in physicians’ willingness to coordinate, extend, and amplify their internal genomics
prescribe and patients’ willingness to take and keep taking research initiatives and increase collaborations with
generic drugs. Generic dispensing rates at Medco are
6
8. THE UNIVERSITY OF IOWA
Henry Fund Research Henry B. Tippie School of Management
Earnings per share are expected to grow 14-17% per year
over the next 5 years. ROIC is assumed to be roughly 34% in
REFERENCES
2010 and 35% on a continuing basis after 2015, reflecting the
cash-flow rich nature of the PBM industry and the relatively i MedcoHealth Solutions 2Q2010 Conference Call and BMO
low need for ongoing capital investment once significant scale Capital Markets Conference, slide 13
is attained. ii
Life Science Analytics, Company Profile: MHS, September
We currently rate the stock a Buy with 20-27% upside over 13, 2010, Business description taken from MedTRACK
the next 12 months. If larger managed-care customers, such iii MedcoHealth Solutions Company Website
as UnitedHealth decide to bring PBM services in-house, we iv MedcoHealth Solutions 2009 Form 10-K, Industry
would revise our estimates downward by 20% and the stock Overview, page 4
would be fairly priced in the $53-56 range. However, we don’t v MedcoHealth Solutions 2009 Annual Report, page 7
expect this to happen as WellPoint’s decision to exit the PBM vi
MedcoHealth Solutions, Presentation Materials for BMO
space with its sale of its PBM business to Express Scripts
demonstrates the acknowledgement of the value-proposition vii Capital Markets Conference, slide 7
that the integrated PBM’s provide. Yahoo Finance, Key Statistics for each competitor
viii
FactSet Economic Chartbook
If customer-retention slides below 98% or if Medco fails to fill ix Medco Research
its 2011 scheduled client renewals book, we would revisit our x
Center for Disease Control
DCF model and accompanying assumptions and possibly xi
change our recommendation. Likewise, if Medco’s non-core xii Medco Research
strategies (including its Therapeutic Resource Centers, mail- MedcoHealth Solutions BMO Capital Market
order delivery, and specialty pharmacy) fail to be met by Presentations Materials, slide 15
xiii
customer demand, we may change our recommendation to MedcoHealth Solutions 2009 From 10-K, Industry
reflect the wasted capital expenditures in these areas. Overview, page 5
xiv
MedcoHealth Solutions 2009 Annual Report, page 4
xv
Morningstar Report by Matthew Cofina and Karen
IMPORTANT DISCLAIMER Anderson, September 15, 2010
This report was created by a student(s) enrolled in the Applied
Securities Management (Henry Fund) program at the University of
Iowa’s Tippie School of Management. The intent of these reports is
to provide potential employers and other interested parties an
example of the analytical skills, investment knowledge, and
communication abilities of Henry Fund students. Henry Fund
analysts are not registered investment advisors, brokers or officially
licensed financial professionals. The investment opinion contained in
this report does not represent an offer or solicitation to buy or sell any
of the aforementioned securities. Unless otherwise noted, facts and
figures included in this report are from publicly available sources. This
report is not a complete compilation of data, and its accuracy is not
guaranteed. From time to time, the University of Iowa, its faculty,
staff, students, or the Henry Fund may hold a financial interest in the
companies mentioned in this report.
8
9. THE UNIVERSITY OF IOWA
Henry Fund Research Henry B. Tippie School of Management
MedcoHealth Solutions Inc. 0.151707294 0.166729096 0.091896556 0.062787136 0.031700288 0.04 0.035 0.03
Revenue Decomposition
Fiscal Years Ending December 26 0.150457898 0.165793397 0.090891668 0.061168679 0.030126775 0.04 0.035 0.03
(in thousands) 65300000 69400000 71600000 74464000 77070240 79382347.2
64320500 68254900 70311200 72974720 75297624.48 77278715
2007A 2008A 2009A 2010E 2011E 2012E 2013E 2014E 2015E
Net Revenues
Retail Product 26,424,000 28,613,500 36,596,400 38,592,300 40,952,940 42,186,720 43,784,832 45,178,575 46,367,229
Growth 8.3% 27.9% 5.5% 6.1% 3.0% 3.8% 3.2% 2.6%
Mail-Order Product 17,537,800 21,962,700 22,365,000 25,728,200 27,301,960 28,124,480 29,189,888 30,119,050 30,911,486
Growth 25.2% 1.8% 15.0% 6.1% 3.0% 3.8% 3.2% 2.6%
Total Product 43,961,800 50,576,200 58,961,400 64,320,500 68,254,900 70,311,200 72,974,720 75,297,624 77,278,715
Client and Other Service 391,000 502,200 685,000 812,985 973,335 1,121,256 1,325,459 1,613,080 1,935,342
Growth 28.4% 36.4% 18.7% 19.7% 15.2% 18.2% 21.7% 20.0%
Manufacturer Service 153,300 179,600 157,800 166,515 171,765 167,544 163,821 159,535 168,291
Growth 17.2% -12.1% 5.5% 3.2% -2.5% -2.2% -2.6% 5.5%
Total Service 544,300 681,800 842,800 979,500 1,145,100 1,288,800 1,489,280 1,772,616 2,103,632
Total Net Revenues 44,506,100 51,258,000 59,804,200 65,300,000 69,400,000 71,600,000 74,464,000 77,070,240 79,382,347
Cost of Revenues
Product 41,402,600 47,308,200 55,523,100 60,589,911 64,159,606 65,951,906 68,304,338 70,327,981 72,023,762
Service 158,300 221,400 254,100 298,439 345,460 383,657 440,358 522,364 617,806
Total Cost of Revenues 41,560,900 47,529,600 55,777,200 60,888,350 64,505,066 66,335,562 68,744,696 70,850,345 72,641,568
Gross Margins
Product 5.82% 6.46% 5.83% 5.80% 6.00% 6.20% 6.40% 6.60% 6.80%
Service 70.92% 67.53% 69.85% 69.53% 69.83% 70.23% 70.43% 70.53% 70.63%
Total Gross Margin 6.62% 7.27% 6.73% 6.76% 7.05% 7.35% 7.68% 8.07% 8.49%
Volume Information
Retail Prescriptions 465,000 480,200 591,400 703,221 735,852 747,506 759,594 772,353 783,656
Mail-Order Prescriptions 94,800 105,800 103,100 108,000 118,952 128,451 137,312 146,742 155,114
Total Prescriptions 559,800 586,000 694,500 811,221 854,804 875,957 896,906 919,096 938,770
Adjusted Prescriptions 748,452 796,542 899,669 1,026,141 1,091,519 1,131,574 1,170,157 1,211,113 1,247,446
Adjusted Mail-Order Penetration 37.87% 39.71% 34.26% 31.47% 32.58% 33.94% 35.09% 36.23% 37.18%
General Dispensing Rate Information
Overall Generic Dispensing Rate 59.7% 64.1% 67.5% 70.0% 71.0% 74.0% 76.0% 78.0% 80.0%
9
10. THE UNIVERSITY OF IOWA
Henry Fund Research Henry B. Tippie School of Management
MedcoHealth Solutions Inc.
Annual Income Statement
Fiscal Years Ending December 26
(in thousands)
2007A 2008A 2009A 2010E 2011E 2012E 2013E 2014E 2015E
Total net revenues 44,506,200 51,258,000 59,804,200 65,300,000 69,400,000 71,600,000 74,464,000 77,070,240 79,382,347
Total cost of revenues 41,560,900 47,529,600 55,777,200 60,888,350 64,505,066 66,335,562 68,744,696 70,850,345 72,641,568
Gross Profit 2,945,300 3,728,400 4,027,000 4,411,650 4,894,934 5,264,438 5,719,304 6,219,895 6,740,779
Selling, general & administrative expenses 1,114,100 1,425,000 1,455,500 1,554,140 1,651,720 1,704,080 1,772,243 1,834,272 1,889,300
Amortization of intangibles 228,100 285,100 305,600 278,500 259,800 251,200 246,700 244,100 242,000
Interest expense 0 233,700 172,500 160,000 201,260 207,640 215,946 223,504 230,209
(Interest income) & other income expense, net 99,800 -6,200 -9,900 53,114 56,449 58,238 60,568 62,688 64,568
Income Before Provision for Income Taxes 1,503,300 1,790,800 2,103,300 2,365,896 2,725,705 3,043,279 3,423,847 3,855,332 4,314,702
Provision for income taxes 591,300 687,900 823,000 922,699 1,063,025 1,186,879 1,335,300 1,503,579 1,682,734
Net Income 912,000 1,102,900 1,280,300 1,443,196 1,662,680 1,856,400 2,088,547 2,351,752 2,631,968
Weighted average shares outstanding-basic 550,200 508,600 481,100 460,000 447,051 431,660 418,650 407,700 398,640
Year end shares outstanding 535,939 493,325 474,493 455,575 438,526 424,795 412,506 402,894 394,387
Net Earnings Per Share-Basic 1.66 2.17 2.66 3.14 3.72 4.30 4.99 5.77 6.60
10
11. THE UNIVERSITY OF IOWA
Henry Fund Research Henry B. Tippie School of Management
MedcoHealth Solutions Inc.
Common Size Income Statement
Fiscal Years Ending December 26
(in thousands) 44,506,200 51,258,000 59,804,200 65,300,000 69,400,000 71,600,000 74,464,000 77,070,240
2007A 2008A 2009A 2010E 2011E 2012E 2013E 2014E 2015E
Product net revenues 98.78% 98.67% 98.59% 98.50% 98.35% 98.20% 98.00% 97.70% 100.27%
Service revenues 1.22% 1.33% 1.41% 1.50% 1.65% 1.80% 2.00% 2.30% 2.73%
Total net revenues 100.00% 100.00% 100.00% 100.00% 100.00% 100.00% 100.00% 100.00% 103.00%
Cost of product net revenues 93.03% 92.29% 92.84% 92.79% 92.45% 92.11% 91.73% 91.25% 93.45%
Cost of service revenues 0.36% 0.43% 0.42% 0.46% 0.50% 0.54% 0.59% 0.68% 0.80%
Total cost of revenues 93.38% 92.73% 93.27% 93.24% 92.95% 92.65% 92.32% 91.93% 94.25%
Gross Profit 6.62% 7.27% 6.73% 6.76% 7.05% 7.35% 7.68% 8.07% 8.75%
Selling, general & administrative expenses 2.50% 2.78% 2.43% 2.38% 2.38% 2.38% 2.38% 2.38% 2.45%
Amortization of intangibles 0.51% 0.56% 0.51% 0.43% 0.37% 0.35% 0.33% 0.32% 0.31%
Interest expense 0.00% 0.46% 0.29% 0.25% 0.29% 0.29% 0.29% 0.29% 0.30%
(Interest income) & other income expense, net 0.22% -0.01% -0.02% 0.08% 0.08% 0.08% 0.08% 0.08% 0.08%
Income Before Provision for Income Taxes 3.38% 3.49% 3.52% 3.62% 3.93% 4.25% 4.60% 5.00% 5.60%
Provision for income taxes 1.33% 1.34% 1.38% 1.41% 1.53% 1.66% 1.79% 1.95% 2.18%
Net Income 2.05% 2.15% 2.14% 2.21% 2.40% 2.59% 2.80% 3.05% 3.42%
11