BP Energy Outlook 2035 - EU region insights 2014
•
0 gefällt mir•1,064 views

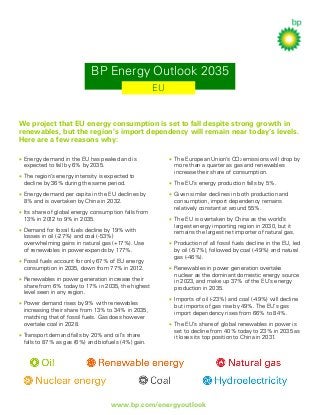
Regional insights for the EU from BP's Energy Outlook 2035 published in 2014. We project that EU energy consumption is set to fall despite strong growth in renewables, but the region’s import dependency will remain near today’s levels.
Empfohlen

Empfohlen
Weitere ähnliche Inhalte
Andere mochten auch
Mehr von bp
Mehr von bp (20)
BP Energy Outlook 2035 - EU region insights 2014
- 1. BP Energy Outlook 2035 EU We project that EU energy consumption is set to fall despite strong growth in renewables, but the region’s import dependency will remain near today’s levels. Here are a few reasons why: • Energy demand in the EU has peaked and is expected to fall by 6% by 2035. • The region’s energy intensity is expected to decline by 36% during the same period. • Energy demand per capita in the EU declines by 8% and is overtaken by China in 2032. • Its share of global energy consumption falls from 13% in 2012 to 9% in 2035. • Demand for fossil fuels decline by 19% with losses in oil (-27%) and coal (-53%) overwhelming gains in natural gas (+17%). Use of renewables in power expands by 177%. • Fossil fuels account for only 67% of EU energy consumption in 2035, down from 77% in 2012. • Renewables in power generation increase their share from 6% today to 17% in 2035, the highest level seen in any region. • Power demand rises by 9% with renewables increasing their share from 13% to 34% in 2035, matching that of fossil fuels. Gas does however overtake coal in 2028. • Transport demand falls by 20% and oil’s share falls to 87% as gas (6%) and biofuels (4%) gain. • The European Union’s CO2 emissions will drop by more than a quarter as gas and renewables increase their share of consumption. • The EU’s energy production falls by 5%. • Given similar declines in both production and consumption, import dependency remains relatively constant at around 55%. • The EU is overtaken by China as the world’s largest energy importing region in 2030, but it remains the largest net importer of natural gas. • Production of all fossil fuels decline in the EU, led by oil (-57%), followed by coal (-49%) and natural gas (-46%). • Renewables in power generation overtake nuclear as the dominant domestic energy source in 2023, and make up 37% of the EU’s energy production in 2035. • Imports of oil (-23%) and coal (-49%) will decline but imports of gas rise by 49%. The EU’s gas import dependency rises from 66% to 84%. • The EU’s share of global renewables in power is set to decline from 40% today to 23% in 2035 as it loses its top position to China in 2031. www.bp.com/energyoutlook