Unemployment Rate Summary (Feb 2012)
•
1 gefällt mir•484 views

U.S. added 227,000 jobs in Feb 2012 and unemployment rate stayed at 8.3 percent. This is the official press release from the US Department of Labor

Empfohlen
Weitere ähnliche Inhalte
Was ist angesagt?
Was ist angesagt? (20)
Andere mochten auch
Andere mochten auch (20)
Ähnlich wie Unemployment Rate Summary (Feb 2012)
Ähnlich wie Unemployment Rate Summary (Feb 2012) (20)
Mehr von BDPA Education and Technology Foundation
Mehr von BDPA Education and Technology Foundation (20)
Kürzlich hochgeladen
Kürzlich hochgeladen (20)
Unemployment Rate Summary (Feb 2012)
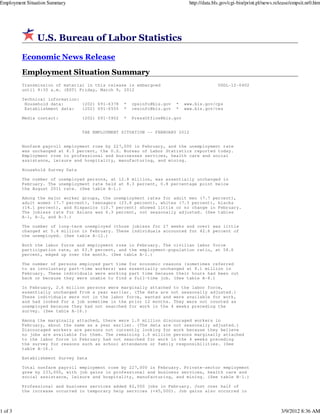
- 1. Employment Situation Summary http://data.bls.gov/cgi-bin/print.pl/news.release/empsit.nr0.htm U.S. Bureau of Labor Statistics Economic News Release Employment Situation Summary Transmission of material in this release is embargoed USDL-12-0402 until 8:30 a.m. (EST) Friday, March 9, 2012 Technical information: Household data: (202) 691-6378 * cpsinfo@bls.gov * www.bls.gov/cps Establishment data: (202) 691-6555 * cesinfo@bls.gov * www.bls.gov/ces Media contact: (202) 691-5902 * PressOffice@bls.gov THE EMPLOYMENT SITUATION -- FEBRUARY 2012 Nonfarm payroll employment rose by 227,000 in February, and the unemployment rate was unchanged at 8.3 percent, the U.S. Bureau of Labor Statistics reported today. Employment rose in professional and businesses services, health care and social assistance, leisure and hospitality, manufacturing, and mining. Household Survey Data The number of unemployed persons, at 12.8 million, was essentially unchanged in February. The unemployment rate held at 8.3 percent, 0.8 percentage point below the August 2011 rate. (See table A-1.) Among the major worker groups, the unemployment rates for adult men (7.7 percent), adult women (7.7 percent), teenagers (23.8 percent), whites (7.3 percent), blacks (14.1 percent), and Hispanics (10.7 percent) showed little or no change in February. The jobless rate for Asians was 6.3 percent, not seasonally adjusted. (See tables A-1, A-2, and A-3.) The number of long-term unemployed (those jobless for 27 weeks and over) was little changed at 5.4 million in February. These individuals accounted for 42.6 percent of the unemployed. (See table A-12.) Both the labor force and employment rose in February. The civilian labor force participation rate, at 63.9 percent, and the employment-population ratio, at 58.6 percent, edged up over the month. (See table A-1.) The number of persons employed part time for economic reasons (sometimes referred to as involuntary part-time workers) was essentially unchanged at 8.1 million in February. These individuals were working part time because their hours had been cut back or because they were unable to find a full-time job. (See table A-8.) In February, 2.6 million persons were marginally attached to the labor force, essentially unchanged from a year earlier. (The data are not seasonally adjusted.) These individuals were not in the labor force, wanted and were available for work, and had looked for a job sometime in the prior 12 months. They were not counted as unemployed because they had not searched for work in the 4 weeks preceding the survey. (See table A-16.) Among the marginally attached, there were 1.0 million discouraged workers in February, about the same as a year earlier. (The data are not seasonally adjusted.) Discouraged workers are persons not currently looking for work because they believe no jobs are available for them. The remaining 1.6 million persons marginally attached to the labor force in February had not searched for work in the 4 weeks preceding the survey for reasons such as school attendance or family responsibilities. (See table A-16.) Establishment Survey Data Total nonfarm payroll employment rose by 227,000 in February. Private-sector employment grew by 233,000, with job gains in professional and business services, health care and social assistance, leisure and hospitality, manufacturing, and mining. (See table B-1.) Professional and business services added 82,000 jobs in February. Just over half of the increase occurred in temporary help services (+45,000). Job gains also occurred in 1 of 3 3/9/2012 8:36 AM
- 2. Employment Situation Summary http://data.bls.gov/cgi-bin/print.pl/news.release/empsit.nr0.htm computer systems design (+10,000) and in management and technical consulting services (+7,000). Employment in professional and business services has grown by 1.4 million since a recent low point in September 2009. Health care and social assistance employment rose by 61,000 over the month. Within health care, ambulatory care services added 28,000 jobs, and hospital employment increased by 15,000. Over the past 12 months, health care employment has risen by 360,000. In February, social assistance employment edged up (+12,000). In February, employment in leisure and hospitality increased by 44,000, with nearly all of the increase in food services and drinking places (+41,000). Since a recent low in February 2010, food services has added 531,000 jobs. Manufacturing employment rose by 31,000 in February. All of the increase occurred in durable goods manufacturing, with job gains in fabricated metal products (+11,000), transportation equipment (+8,000), machinery (+5,000), and furniture and related products (+3,000). Durable goods manufacturing has added 444,000 jobs since a recent trough in January 2010. In February, mining added 7,000 jobs, with most of the gain in support activities for mining (+5,000). Since a recent low in October 2009, mining employment has increased by 180,000. Construction employment changed little in February, after 2 consecutive months of job gains. Over the month, employment fell by 14,000 in nonresidential specialty trade contractors. Overall, employment in retail trade changed little in February. A large job loss in general merchandise stores (-35,000) more than offset an increase in January (+23,000). Employment in motor vehicle and parts dealers continued to trend up in February. Government employment was essentially unchanged in January and February. In 2011, government lost an average of 22,000 jobs per month. The average workweek for all employees on private nonfarm payrolls was unchanged at 34.5 hours in February. The manufacturing workweek edged up by 0.1 hour to 41.0 hours, and factory overtime was unchanged at 3.4 hours. The average workweek for production and nonsupervisory employees on private nonfarm payrolls edged up by 0.1 hour to 33.8 hours. (See tables B-2 and B-7.) In February, average hourly earnings for all employees on private nonfarm payrolls rose by 3 cents, or 0.1 percent, to $23.31. Over the past 12 months, average hourly earnings have increased by 1.9 percent. In February, average hourly earnings of private-sector production and nonsupervisory employees rose by 3 cents, or 0.2 percent, to $19.64. (See tables B-3 and B-8.) The change in total nonfarm payroll employment for December was revised from +203,000 to +223,000, and the change for January was revised from +243,000 to +284,000. ______________ The Employment Situation for March is scheduled to be released on Friday, April 6, 2012, at 8:30 a.m. (EDT). Employment Situation Summary Table A. Household data, seasonally adjusted Employment Situation Summary Table B. Establishment data, seasonally adjusted Employment Situation Frequently Asked Questions Employment Situation Technical Note Table A-1. Employment status of the civilian population by sex and age Table A-2. Employment status of the civilian population by race, sex, and age Table A-3. Employment status of the Hispanic or Latino population by sex and age Table A-4. Employment status of the civilian population 25 years and over by educational attainment Table A-5. Employment status of the civilian population 18 years and over by veteran status, period of service, and sex, not seasonally adjusted Table A-6. Employment status of the civilian population by sex, age, and disability status, not seasonally adjusted Table A-7. Employment status of the civilian population by nativity and sex, not seasonally adjusted Table A-8. Employed persons by class of worker and part-time status Table A-9. Selected employment indicators Table A-10. Selected unemployment indicators, seasonally adjusted Table A-11. Unemployed persons by reason for unemployment Table A-12. Unemployed persons by duration of unemployment Table A-13. Employed and unemployed persons by occupation, not seasonally adjusted 2 of 3 3/9/2012 8:36 AM
- 3. Employment Situation Summary http://data.bls.gov/cgi-bin/print.pl/news.release/empsit.nr0.htm Table A-14. Unemployed persons by industry and class of worker, not seasonally adjusted Table A-15. Alternative measures of labor underutilization Table A-16. Persons not in the labor force and multiple jobholders by sex, not seasonally adjusted Table B-1. Employees on nonfarm payrolls by industry sector and selected industry detail Table B-2. Average weekly hours and overtime of all employees on private nonfarm payrolls by industry sector, seasonally adjusted Table B-3. Average hourly and weekly earnings of all employees on private nonfarm payrolls by industry sector, seasonally adjusted Table B-4. Indexes of aggregate weekly hours and payrolls for all employees on private nonfarm payrolls by industry sector, seasonally adjusted Table B-5. Employment of women on nonfarm payrolls by industry sector, seasonally adjusted Table B-6. Employment of production and nonsupervisory employees on private nonfarm payrolls by industry sector, seasonally adjusted(1) Table B-7. Average weekly hours and overtime of production and nonsupervisory employees on private nonfarm payrolls by industry sector, seasonally adjusted(1) Table B-8. Average hourly and weekly earnings of production and nonsupervisory employees on private nonfarm payrolls by industry sector, seasonally adjusted(1) Table B-9. Indexes of aggregate weekly hours and payrolls for production and nonsupervisory employees on private nonfarm payrolls by industry sector, seasonally adjusted(1) Access to historical data for the "A" tables of the Employment Situation Release Access to historical data for the "B" tables of the Employment Situation Release HTML version of the entire news release The PDF version of the news release Table of Contents Last Modified Date: March 09, 2012 U.S. Bureau of Labor Statistics | Division of Labor Force Statistics, PSB Suite 4675, 2 Massachusetts Avenue, NE Washington, DC 20212-0001U.S. Bureau of Labor Statistics | Division of Current Employment Statistics, PSB Suite 4860, 2 Massachusetts Avenue, NE Washington, DC 20212-0001 www.bls.gov/CPS | Telephone: 1-202-691-6378 | Contact CPSwww.bls.gov/CES | Telephone: 1-202-691-6555 | Contact CES 3 of 3 3/9/2012 8:36 AM