
Empfohlen
Empfohlen
Weitere ähnliche Inhalte
Was ist angesagt?
Was ist angesagt? (20)
Ähnlich wie Migraine Pipeline Drugs Market Assessment– Forecast to 2022
Ähnlich wie Migraine Pipeline Drugs Market Assessment– Forecast to 2022 (20)
Mehr von AzothAnalytics
Mehr von AzothAnalytics (20)
Kürzlich hochgeladen
Kürzlich hochgeladen (20)
Migraine Pipeline Drugs Market Assessment– Forecast to 2022
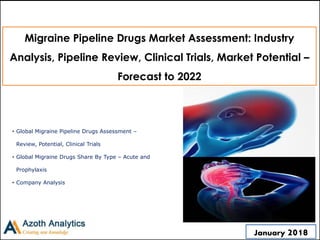
- 1. (c) AZOTH Analytics Migraine Pipeline Drugs Market Assessment: Industry Analysis, Pipeline Review, Clinical Trials, Market Potential – Forecast to 2022 • Global Migraine Pipeline Drugs Assessment – Review, Potential, Clinical Trials • Global Migraine Drugs Share By Type – Acute and Prophylaxis • Company Analysis January 2018
- 2. (c) AZOTH Analytics Global Migraine Pipeline Drugs Assessment Global Migraine Drugs Market (2012-2016), By Value Global Migraine Drugs Market (2017-2022), By Value Breakdown-By Type - Acute and Prophylaxis) Global Migraine Drugs Market (2012-16), By Value Global Migraine Drugs Market (2017-22), By Value Global Coverage Country Coverage Migraine Pipeline Drugs Market Assessment: Industry Analysis, Pipeline Review, Clinical Trials, Market Potential – Forecast to 2022 Migraine Drugs Market, By Value (2012-2016) Migraine Drugs Market, By Value (2017-2022) United States United Kingdom Japan France Italy Germany Pipeline Drugs Coverage Migraine Drugs Market Forecast - By Value (2018-2022) Drug X-1 Drug X-2 Drug X-3 Drug X-4 Drug X-5 Drug X-6 Drug X-7 Company Coverage Product Benchmarking Policy and Regulatory Landscape Financial Analysis Sales EBITDA Business Strategy Amgen Allergan Eli Lilly Alder Pharmaceuticals Teva Pharmaceuticals Vernalis Pfizer Impax Laboratories Glaxo Smithkline Global Coverage Country Coverage Scope of the Study Migraine Pipeline Drugs Assessment Global Migraine Drugs Market – By Type (Acute and Prophylaxis) 2
- 3. (c) AZOTH Analytics Table of Content 3 S.No Particulars Page No. 1. Research Methodology 16 2. Executive Summary 17 3. Migraine - An Overview 18 3.1 Symptoms of migraine 18 3.2 Stages of Migraine 19 3.3 Types of Migraine 20 3.4 Types of migraine on the basis of frequency of occurrence 24 4. Treatment of Migraine 25 4.1 Goal of Migraine Treatment 26 4.2 Treatment of Migraine – Pharmacological and Non-Pharmacological 26 4.2.1 Pharmacological treatment of migraine 27 4.2.2 Pharmacological - Abortive 28 4.2.3 Pharmacological - Preventive 30
- 4. (c) AZOTH Analytics Table of Content 4 S.No Particulars Page No. 4.2.4 Non-Pharmacological Treatment of Migraine 33 4.2.5 Non- Pharmacological - Surgical 34 4.2.6 Non- Pharmacological – Non-Surgical 35 5. Anti Migraine Pipeline Drugs 38 5.1 Anti-Migraine Pipeline Drugs (According to Mechanism of Working) 39 5.2 Anti Migraine Pipeline Drugs (Ergotamine) – Drug X-1 40 5.2.1 Description 41 5.2.2 Regulatory Milestones 42 5.2.3 Advantages & Disadvantages 43 5.2.4 Product Profile & Expected Launch 44 5.2.5 Clinical Trials and Status 45 5.2.6 Pivotal Clinical Trials and Results 46 5.2.7 Drug X-1 – Global Market Potential 48 5.2.8 Drug X-1 - 7Ps Analysis 50
- 5. (c) AZOTH Analytics Table of Content 5 S.No Particulars Page No. 5.3 Anti Migraine Pipeline Drugs (Anti-5HT Receptor Agonist) – Drug X-2 51 5.3.1 Description 52 5.3.2 Regulatory Milestones 53 5.3.3 Advantages & Disadvantages 54 5.3.4 Product Profile & Expected Launch 55 5.3.5 Clinical Trials and Status 56 5.3.6 Pivotal Clinical Trials and Results 58 5.3.7 Drug X-2 – Global Market Potential 60 5.3.8 Drug X-2 – 7Ps Analysis 62 5.4 Anti Migraine Pipeline Drugs (Anti CGRPs) 63 5.5 Anti Migraine Pipeline Drugs (Anti CGRPs) – By Drug 66 5.6 Anti Migraine Pipeline Drugs (CGRP Antagonist) - Drug X-3 67 5.6.1 Description 68 5.6.2 Regulatory Milestones 69 5.6.3 Advantages & Disadvantages 70
- 6. (c) AZOTH Analytics Table of Content 6 S.No Particulars Page No. 5.6.4 Product Profile & Expected Launch 71 5.6.5 Clinical Trials and Status 72 5.6.6 Pivotal Clinical Trials and Results 73 5.6.7 Drug X-3 – Global Market Potential 75 5.6.8 Drug X-3 – 7Ps Analysis 77 5.7 Anti Migraine Pipeline Drugs (Anti-CGRP Mab) - Drug X-4 80 5.7.1 Description 81 5.7.2 Regulatory Milestones 82 5.7.3 Advantages & Disadvantages 83 5.7.4 Product Profile & Expected Launch 84 5.7.5 Clinical Trials and Status 85 5.7.6 Pivotal Clinical Trials and Results 86 5.7.7 Drug X-4 – Global Market Potential 90 5.7.8 Drug X-4 – 7Ps Analysis 92
- 7. (c) AZOTH Analytics Table of Content 7 S.No Particulars Page No. 5.8 Anti Migraine Pipeline Drugs (Anti-CGRP Mab) - Drug X-5 93 5.8.1 Description 94 5.8.2 Regulatory Milestones 95 5.8.3 Advantages & Disadvantages 96 5.8.4 Product Profile & Expected Launch 97 5.8.5 Clinical Trials and Status 98 5.8.6 Pivotal Clinical Trials and Results 100 5.8.7 Drug X-5 – Global Market Potential 103 5.8.8 Drug X-5 – 7Ps Analysis 105 5.9 Anti Migraine Pipeline Drugs (Anti-CGRP Mab) - Drug X-6 106 5.9.1 Description 107 5.9.2 Regulatory Milestones 108 5.9.3 Advantages & Disadvantages 109 5.9.4 Product Profile & Expected Launch 110
- 8. (c) AZOTH Analytics Table of Content 8 S.No Particulars Page No. 5.9.5 Clinical Trials and Status 111 5.9.6 Pivotal Clinical Trials and Results 113 5.9.7 Drug X-6 – Global Market Potential 115 5.9.8 Drug X-6 – 7Ps Analysis 117 5.10 Anti Migraine Pipeline Drugs (Anti-CGRP Mab) - Drug X-7 118 5.10.1 Description 119 5.10.2 Regulatory Milestones 120 5.10.3 Advantages & Disadvantages 121 5.10.4 Product Profile & Expected Launch 122 5.10.5 Clinical Trials and Status 123 5.10.6 Pivotal Clinical Trials and Results 125 5.10.7 Drug X-7 – Global Market Potential 127 5.10.8 Drug X-7 – 7Ps Analysis 129
- 9. (c) AZOTH Analytics Table of Content 9 S.No Particulars Page No. 6. Global Migraine Drugs Market: Growth and Forecast 130 6.1 By Value (2012-2016) 131 6.2 By Value (2017-2022) 132 7. Global Migraine Drugs Market-By Type 135 7.1 Global Migraine Drugs Market, By Type : Breakdown (%) 135 7.1.1 Global Migraine Drugs Market- By Type: 2016 (%) 136 7.1.2 Global Migraine Drugs Market – By Type: 2022 (%) 137 7.2 Global Migraine Drugs Market- By Acute 139 7.2.1 By Value (2012-2016) 139 7.2.2 By Value (2017-2022) 139 7.3 Global Migraine Drugs Market- By Prophylaxis 140 7.3.1 By Value (2012-2016) 140 7.3.2 By Value (2017-2022) 140
- 10. (c) AZOTH Analytics Table of Content S.No Particulars Page No. 8. Global Migraine Drugs Market: Country Analysis (U.S, U.K, Japan, France, Italy, Germany, ROW) 141 8.1 U.S. Migraine Drugs Market, By Value (2012-2022) 142 8.2 U.K. Migraine Drugs Market, By Value (2012-2022) 144 8.3 Japan Migraine Drugs Market, By Value (2012-2022) 146 8.4 France Migraine Drugs Market, By Value (2012-2022) 148 8.5 Italy Migraine Drugs Market, By Value (2012-2022) 150 8.6 Germany Migraine Drugs Market, By Value (2012-2022) 152 8.7 ROW Migraine Drugs Market, By Value (2012-2022) 154 9. Market Dynamics 155 9.1 Migraine Drug Market Drivers 156 9.2 Migraine Drug Market Challenges 160 10. Company Profile 162 10.1. Amgen 163 10
- 11. (c) AZOTH Analytics Table of Content S.No Particulars Page No. 10.2. Allergan 164 10.3. Eli Lilly 165 10.4. Alder Pharmaceuticals 167 10.5. Teva Pharmaceuticals 168 10.6. Vernalis 169 10.7. Pfizer 170 10.8. Impax Laboratories 171 10.9. Glaxo Smithkline 172 11. About Us 173 11
- 12. (c) AZOTH Analytics List of Figures Figure No. Figure Title Page No. Figure 1: 2 hour pain relief & pain free rates in patients treated with LEVADEX (MAP0004) compared to placebo (1st pivotal trial) 47 Figure 2: Improvement at two hours in people who took LEVADEX compared to Placebo (2nd pivotal trial) 47 Figure 3: Global Drug X-1 Market Size, By Value, Forecast, 2019-2022 (USD Billion) 48 Figure 4: Percentage of patients achieving primary end point 59 Figure 5: Percentage of patients achieving secondary endpoint 59 Figure 6: Global Drug X-2 Market Size, By Value, Forecast, 2019-2022 (USD Million) 60 Figure 7: Efficacy in 2 hour pain freedom 74 Figure 8: Global Drug X-3 Market Size, By Value, Forecast, 2019-2022 (USD Billion) 75 Figure 9: Reduction in Monthly migraine days – weeks 1 through 12 87 Figure 10: Percentage of patients with ≥75% reduction in number of migraine days – weeks 1 through 24 88 Figure 11: Percentage of patients with 100% response rate (no migraine in any given month) – months 1 through 6 89 Figure 12: Global Drug X-4 Market Size, By Value, Forecast, 2019-2022 (USD Million) 90 Figure 13: Global Drug X-5 Market Size, By Value, Forecast, 2019-2022 (USD Million) 103 Figure 14: Global Drug X-6 Market Size, By Value, Forecast, 2019-2022 (USD Million) 115 Figure 15: Monthly migraine days reduction vs placebo in previous prophylactic drugs failure group 125 Figure 16: Reduction in days using acute pain medications in recent drug overuse group 125 Figure 17: Global Drug X-7 Market Size, By Value, Forecast, 2019-2022 (USD Million) 127 Figure 18: Global Migraine Drugs Market Size, By value, 2012-2016 (USD Billion) 131 Figure 19: Global Migraine Drugs Market Size, By Value, Forecast, 2017-2022 (USD Billion) 132 12
- 13. (c) AZOTH Analytics List of Figures Figure No. Figure Title Page No. Figure 20: Global consumption of chocolate confectionary, By volume (in 1000 metric tones) 134 Figure 21: Global Migraine Drugs Market Share, By Type, 2016 (%) 136 Figure 22: Global Migraine Drugs Market Share, By Type, 2022 (%) 137 Figure 23: Global Migraine Drugs Market, By Acute, By Value, 2012-2016 (USD Million) 139 Figure 24: Global Migraine Drugs Market, By Acute, By Value, 2017-2022 (USD Million) 139 Figure 25: Global Migraine Drugs Market, By Prophylaxis, By Value, 2012-2016 (USD Million) 140 Figure 26: Global Migraine Drugs Market, By Prophylaxis, By Value, 2017-2022 (USD Million) 140 Figure 27: U.S. Migraine Drugs Market, By Value, 2012-2016 (USD Billion) 142 Figure 28: U.S. Migraine Drugs Market, By Value, 2017-2022 (USD Billion) 142 Figure 29: U.S Adult Migraine Patients, In Percentage 143 Figure 30: U.S Migraine Patients, By gender, In Percentage 143 Figure 31: U.K Migraine Drugs Market, By Value, 2012-2016 (USD Billion) 144 Figure 32: U.K. Migraine Drugs Market, By Value, 2017-2022 (USD Billion) 144 Figure 33: U.K. Migraine Patient, In Percentage 145 Figure 34: NHS Budget for mental illness, In Billion 145 Figure 35: Japan Migraine Drugs Market, By Value, 2012-2016 (USD Billion) 146 Figure 36: Japan Migraine Drugs Market, By Value, 2017-2022 (USD Billion) 146 Figure 37: Japan Migraine Patient out of total population, In Percentages 147 Figure 38: France Migraine Drugs Market, By Value, 2012-2016 (USD Billion) 148 Figure 39: France Migraine Drugs Market, By Value, 2017-2022 (USD Billion) 148 13
- 14. (c) AZOTH Analytics List of Figures Figure No. Figure Title Page No. Figure 40: France Migraine Patient, In Percentage 149 Figure 41: Unemployment rate in France in percentage 149 Figure 42: Italy Migraine Drugs Market, By Value, 2012-2016 (USD Billion) 150 Figure 43: Italy Migraine Drugs Market, By Value, 2017-2022 (USD Billion) 150 Figure 44: Italy Migraine Patient out of total population, In Percentages 151 Figure 45: Italy Unemployment rate, In Percentages 151 Figure 46: Germany Migraine Drugs Market, By Value, 2012-2016 (USD Billion) 152 Figure 47: Germany Migraine Drugs Market, By Value, 2017-2022 (USD Billion) 152 Figure 48: Germany Migraine Patient out of total population, In Percentages 153 Figure 49: First Time asylum application, In Number 153 Figure 50: ROW Migraine Drugs Market, By Value, 2012-2016 (USD Billion) 154 Figure 51: ROW Migraine Drugs Market, By Value, 2017-2022 (USD Billion) 154 Figure 52: ROW Migraine Drugs Market, By Value, 2017-2022 (USD Billion) 165 14
- 15. (c) AZOTH Analytics Research Methodology For our study of Migraine Drugs Market, we have conducted comprehensive secondary research followed by an extensive primary research. In the process of secondary research, we have scrutinized industry documents, accessed from open sources, premium paid databases (Bloomberg, Thomson Reuters, Factiva) and our internal knowledge base. In the process of primary research, we have interviewed various industry experts across the value chain of the Migraine Drug industry. For evaluating the market size of pipeline drugs, both primary and secondary research has been conducted to validate the launch date, anticipated price and growth in the number of patients. Market size of the actual period (2012-2016) has been evaluated on the basis of growth trends of the industry in the last five years, and confirming the findings through primary research. Annual reports of the companies are scanned to further validate the market size and to estimate the size of migraine drugs. All the relevant data points/ statistics in the forecast period are validated through relevant and reliable primary sources. Report Focus: Global Migraine Drugs Market - Migraine Pipeline Drugs (Drug X-1, X-2, X-3, X-4, X-5, X-6, X-7) - By Type (Acute and Prophylaxis) - By Country (U.S., U.K, Japan, France, Italy, Germany) - Company Coverage (Amgen, Allergan, Eli Lilly, Alder Pharmaceuticals, Teva Pharmaceutical, Vernalis, Pfizer, Impax Laboratories, Glaxo Smithkline) 16
- 16. (c) AZOTH Analytics 2019 2020 2021 2022 Source: Azoth Analytics Estimates CAGR 2019-2022 X% Figure 14: Global Drug X-1 Market Size, By Value, Forecast, 2019-2022 (USD Million) Global Fremanezumab Market 115 Xx Xx Xx Xx Xx Xx Xx Xx
- 17. (c) AZOTH Analytics Drug X-1 – 7Ps Analysis Payer Physician Patient Pathway Phase Patent Partner 50
- 18. (c) AZOTH Analytics Global Migraine Drugs Market: Sizing and Growth (2012-2016) Source: Azoth Analytics Estimates Xx Xx Xx Xx Xx Xx Xx Xx Increase in Global Stress levels coupled with growing awareness regarding migraine and availability of its drugs propelled growth in migraine drugs market. 2012 2013 2014 2015 2016 Figure 18: Global Migraine Drugs Market Size, By value, 2012-2016 (USD Billion) CAGR 2012-2016 X% 131
- 19. (c) AZOTH Analytics Global Heart Valve Replacement Devices Market, By Value Figure 27: U.S. Migraine Drugs Market, By Value, 2012-2016 (USD Billion) Source: Azoth Analytics Estimates CAGR 2012-2016 X% CAGR 2017-2022 X% Figure 28: U.S. Migraine Drugs Market, By Value, 2017-2022 (USD Billion) U.S. Migraine Drugs Market 2012 2013 2014 2015 2016 2017 2018 2019 2020 2021 2022 142 Xx Xx Xx Xx Xx Xx Xx Xx
- 20. (c) AZOTH Analytics About Azoth Analytics Pvt Ltd. Azoth Analytics is a business research and analytics firm that creates in-depth research reports and provides customized research solutions and consultancy Application. Verticals in which Azoth Analytics specializes include healthcare and pharmaceutical, oil and gas, retail, chemicals, automotive, FMCG, food & beverages and technology. Azoth creates comprehensive and in-depth research reports by recording, interpreting and analyzing information. Strategic market sizing and data dredging techniques include secondary research, and primary research (interviews with management personnel and industry experts). Disclaimer: Azoth Analytics report information is based mainly on interviews and therefore, is subject to fluctuation. Azoth Analytics therefore, takes no responsibility for any incorrect information supplied to us by industry experts, manufacturers or users. Azoth does not warranty the completeness of the information and data. Also, analysis provided in the report are meant for customers’ internal use only and not for general publication or disclosure to third parties. 22