Analyzing Population Structure
•
0 gefällt mir•289 views

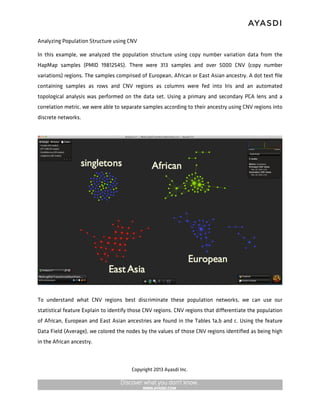
This document summarizes an analysis of population structure using copy number variation (CNV) data from 313 HapMap samples from European, African, and East Asian populations. An automated topological analysis using Iris separated the samples into discrete networks according to their ancestry using over 5000 CNV regions. Key CNV regions that best discriminate the populations were identified. The analysis also revealed interesting patterns within networks, like a "starburst" structure within the African and European networks that indicated related parent-child relationships among samples.

Empfohlen
Empfohlen
Weitere ähnliche Inhalte
Kürzlich hochgeladen
Kürzlich hochgeladen (20)
Empfohlen
Empfohlen (20)
Analyzing Population Structure
- 1. Analyzing Population Structure using CNV In this example, we analyzed the population structure using copy number variation data from the HapMap samples (PMID 19812545). There were 313 samples and over 5000 CNV (copy number variations) regions. The samples comprised of European, African or East Asian ancestry. A dot text file containing samples as rows and CNV regions as columns were fed into Iris and an automated topological analysis was performed on the data set. Using a primary and secondary PCA lens and a correlation metric, we were able to separate samples according to their ancestry using CNV regions into discrete networks. To understand what CNV regions best discriminate these population networks, we can use our statistical feature Explain to identify those CNV regions. CNV regions that differentiate the population of African, European and East Asian ancestries are found in the Tables 1a,b and c. Using the feature Data Field (Average), we colored the nodes by the values of those CNV regions identified as being high in the African ancestry. Copyright 2013 Ayasdi Inc.
- 2. In addition to the separation of the ancestry, we also saw interesting “textures” that were associated with the underlying data. As seen in figure 2 below, the African and European ancestry networks had a “starburst” structure whereas the East Asian ancestry network had no such structure. Upon a closer inspection of the starburst structure by using the Display feature, it is evident that the ”starburst” structure comprised of parent-child relationships, that is, the samples in each of the node were either a father-child or a mother-child or in some cases, father-mother-child samples (Table below figure 2). Through this example, we show that topological analysis was able to not only identify discrete population structure easily but also identified fine textures of the data, including parent-child relationships. In addition, the regions that are important in determining the population structure are easily identifiable through our Explain feature. Copyright 2013 Ayasdi Inc.
- 3. Copyright 2013 Ayasdi Inc.