
Empfohlen
Empfohlen
Weitere ähnliche Inhalte
Ähnlich wie Gupta ayankprojectassignmnet
Ähnlich wie Gupta ayankprojectassignmnet (20)
Kürzlich hochgeladen
Kürzlich hochgeladen (20)
Gupta ayankprojectassignmnet
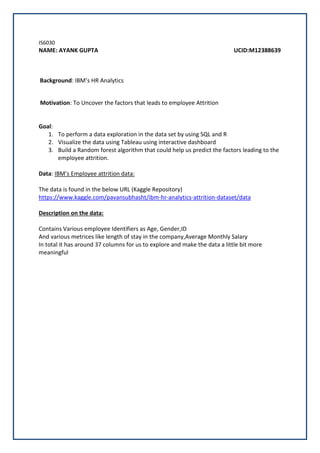
- 1. IS6030 NAME: AYANK GUPTA UCID:M12388639 Background: IBM’s HR Analytics Motivation: To Uncover the factors that leads to employee Attrition Goal: 1. To perform a data exploration in the data set by using SQL and R 2. Visualize the data using Tableau using interactive dashboard 3. Build a Random forest algorithm that could help us predict the factors leading to the employee attrition. Data: IBM’s Employee attrition data: The data is found in the below URL (Kaggle Repository) https://www.kaggle.com/pavansubhasht/ibm-hr-analytics-attrition-dataset/data Description on the data: Contains Various employee Identifiers as Age, Gender,ID And various metrices like length of stay in the company,Average Monthly Salary In total it has around 37 columns for us to explore and make the data a little bit more meaningful
- 2. PROJECT INDEX ➢ CHAPTER 1: DATA PREPARATION ➢ Performing the completeness check of each variable – examine if missing values are present; ➢ Performing the validity check of each variable – examine if abnormal values are present; ➢ Cleaning the data based on the results of Steps 2 and 3; ➢ Summarizing the distribution of each variable (what tables and figures will you present?) ➢ CHAPTER 2: Descriptive Study (XY plots and correlation studies) ➢ Studying the X-Y plot between the different variables. ➢ Performing Various data exploration analysis ➢ CHAPTER 3: Statistical Modelling ➢ Preparing a model to predict the relationship between the independent variable and the dependent variables ➢ CHAPTER 4: Visualizing Using Tableau ➢ CHAPTER 5: Project Summary (report)
- 3. CHAPTER 1: DATA PREPARATION ➢ Data Explanation: S.No Column Name Column Definition Data Type 1 Age Age of Employees Numeric 2 Attrition Employee still in company status Categorical 3 BusinessTravel Opportunity of Travel Categorical 4 DailyRate Daily rate Numeric 5 Department Employee's Department Categorical 6 DistanceFromHome Employee's Distance from home Categorical 7 Education Level Eductaion Categorical 8 EducationField Field of the education Categorical 10 EmployeeNumber Unique Employee Identifier Numeric 11 EnvironmentSatisfaction Factor for Employee Satisfaction Categorical 12 Gender Employee gender Categorical 13 HourlyRate HourlyRate Numeric 14 JobInvolvement Involvment in the Job Categorical 15 JobLevel Level of the Job Categorical 16 JobRole Role in the Job Categorical 17 JobSatisfaction Satisfaction score of the employee Numeric 18 MaritalStatus Married or Not Categorical 19 MonthlyIncome Monthly income Categorical 20 MonthlyRate Monthl Salary Numeric 21 NumCompaniesWorked Number of companies worked before Numeric 22 Over18 whether 18+ ? Categorical 23 OverTime whether used to work overtime Numeric 24 PercentSalaryHike % Salary Hike Categorical 25 PerformanceRating Performanceo rating of the Employee Numeric 26 RelationshipSatisfaction Relationship satisfaction rating Categorical 27 StandardHours Standard working hours Numeric 28 StockOptionLevel StockOptionLevel available ? Categorical 29 TotalWorkingYears # Workingyears Numeric 30 TrainingTimesLastYear # Trainings Numeric 31 WorkLifeBalance Work life balance Numeric 32 YearsAtCompany # years wrking for the same company Numeric 33 YearsInCurrentRole # Years in current role Numeric 34 YearsSinceLastPromotio n # years since last year Numeric 35 YearsWithCurrManager # years with the current manager Numeric
- 4. ➢ Data Normalization: Data is fine form , as it has all the required columns for analysis and prediction. The data can be randomly divided into 2 data sets i.e Test and training data sets for the prediction algorithm ➢ Data Cleaning: 1. Performing the completeness check of each variable a. The whole data is unique at the Employee number level. b. Are there, in any missing value ? c. Bad columns All the columns are aptly named , Except I had to make a age bucket columns i.e above 30 and below 30 to have planned analysis on the age group. Inconsistency in data types corrected: I observed few of the data types were not consistent
- 5. ➢ Using SQL for genera statistics, data description and data manipulation After loading in the excel file in SQL, lets try to do some basic statistics We will finding the statistics of the below variables 1. YearsWithCurrManager 2. YearsSinceLastPromotion 3. YearsInCurrentRole 4. YearsAtCompany 5. WorkLifeBalance 6. PerformanceRating 7. MonthlyIncome
- 7. Note: As opposite to the popular belief female on an average gets paid more than males. Note: Another shocker all the people below 30 earn more on an average that their experienced counterpart Now let’s move our analysis to R , Firstly we need to connect our sql data base in to R. Now let’s check the structure of the data base
- 8. Finally lets check the the statistically summary of the data sets to check for any discrepancies if any
- 9. A few basic summaries Lets look at few of the visualizations in R
- 10. Creating a Machine learning algorithm-Random Forest for prediction Employees Attrition Now use the VarImplot function to find out the most important factors
- 11. As we can see a few important factors in predicting the attritionis OverTime, MonthlyIncome,Total Working Income and Job Roles And hence we can study these factors in detail to explore more about in detail in the tableau dashboard
- 12. Learning about the insights by using Tableau dashboards. I tried to make the dashboard completely interactive, so that even a common man could drive insights through it. Few of the observations: 1. Most of the Employees are from the Life Sciences closely followed by Medical and Marketing. a. Least number of employees belongs to the HR 2. ~16% of the Employees in general leave the company per year. 3. Employees above is 30 are more in number as compared to employees in less than 30. a. Maximum Employees are mail above 30. b. And Minimum employees are female 30 In the interactive big boxes above we can also look at various metrices that will be ultra helpful to the HR like
- 13. 1. Avg Working hours of the selected employees 2. Avg years in the company 3. Average salary hike 4. Avg salary Now we select the population that left company and we will be able to see a drastic change And if we compare the above results with the people who have stayed in the company the difference will be clear
- 15. Summary or the conclusion of the findings in the analysis Below points will help uncover the reason why the employees left the company 1. The Average Salary of the employees who left was almost 33% less than the person who stayed. 2. The Average Salary hike of the people that stayed in the office was marginally more that people who left. 3. The Average Working years of the people who stayed were ~3 years more that people who left a. This means experienced people are reluctant to switch companies 4. Years with manager: On an average the people who stayed had more time with manager as compared to the who left Difficulties faced 1. The Assignment was at the time of other examinations so that to take out time in completing the assignment 2. It was challenging but good to master Tableau as well. 3. Finding the dataset was also difficult.