Integrated nutrient management approaches under system of rice intensification (sri)
•
4 gefällt mir•1,325 views

Integrated nutrient management approaches under system of rice intensification (sri)

Empfohlen
Empfohlen
Weitere ähnliche Inhalte
Was ist angesagt?
Was ist angesagt? (20)
Andere mochten auch
Andere mochten auch (20)
Ähnlich wie Integrated nutrient management approaches under system of rice intensification (sri)
Ähnlich wie Integrated nutrient management approaches under system of rice intensification (sri) (20)
Mehr von Ashutosh Pal
Mehr von Ashutosh Pal (20)
Kürzlich hochgeladen
Kürzlich hochgeladen (20)
Integrated nutrient management approaches under system of rice intensification (sri)
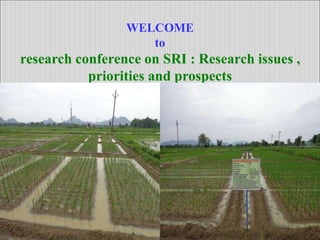
- 1. WELCOME to research conference on SRI : Research issues , priorities and prospects
- 2. Integrated nutrient management approaches under System of Rice Intensification (SRI) REGIONALRESEARCHANDTECHNOLOGYTRANSFERSTATION,OUAT,BHAWANIPATNA Presented by: Anshuman Nayak Technical Officer Agromet Advisory Servises
- 3. Intoduction: Rice (Oryza sativa L.) is the staple food for nearly three billion people all over the world (Carriger and Vallee, 2007) In India, rice is cultivated round the year in one or the other parts of the country in diverse ecologies in an area of 42.41mha with production of 104.4mt during 2012- 13 (Agriculture Statistics at a glance, 2013). Odisha is the 5th largest state in terms of contributing 7.32% share of production. The area under rice is 4.03mha with production of 7.64mt during 2012-13. (Agriculture Statistics at a glance, 2013). The country has to produce 170 to 180mt rice (115- 120MT milled rice) by 2020 with an average productivity of 4.03 t/ha to maintain present level of self sufficiency (Tripathy and Mishra,2011)
- 4. Rice production in India and Odisha INDIA ODISHA Year Area (m ha) Production (mt) Yield (kg/ha) Area (m ha) Productio n (mt) Yield (kg/ha) 1950-51 30.81 20.58 668 - - - 2001-02 44.90 93.34 2079 4.50 7.15 1589 2002-03 41.18 71.82 1744 4.27 3.24 759 2003-04 42.59 88.53 2078 4.50 6.73 1496 2004-05 41.91 83.13 1984 4.49 6.54 1455 2005-06 43.66 91.79 2102 4.48 6.96 1554 2006-07 43.81 93.36 2131 4.45 6.93 1557 2007-08 43.91 96.69 2202 4.45 7.65 1720 2008-09 45.54 99.18 2178 4.45 6.91 1553 2009-10 41.92 89.09 2125 4.36 7.02 1609 2010-11 42.86 95.98 2239 4.23 6.93 1640 2011-12 44.01 105.3 2393 4.00 6.83 1708 2012-13 42.41 104.4 2462 4.03 7.64 1896
- 5. Area and Production of rice in India 30.81 45.54 42.41 20.58 99.18 104.4 0 20 40 60 80 100 120 1950-51 2001-02 2002-03 2003-04 2004-05 2005-06 2006-07 2007-08 2008-09 2009-10 2010-11 2011-12 2012-13 Area (mha) Production (mt)
- 6. Thus, it necessitates a revision of human intelligence to search for alternative options that can make rice production sustainable. The System of Rice Intensification (SRI) method appears to be a viable alternative to the modern rice cultivation. System of Rice Intensification (SRI) emerged in the 1980’s as a synthesis of locally advantageous rice production practices encountered in Madagascar by Fr Henri de Laulanie, a Jesuit Priest who had been working there since 1961. But, it is Dr. Norman Uphoff from Cornell International Institute for Food and Agriculture, Ithaca, USA, who had brought this method to the notice of outside world in the late 1990s. (www.sri-india.net).
- 7. Nutrient management must be sound for achieving the yield potential under SRI. Although use of chemical fertilizer is the fastest way of counteracting the pace of nutrient depletion, the best course is to practise integrated nutrient management. This would harmoniously integrate the use of inorganic fertilizer and organic manures to the extent possible without any detrimental effect on potential yield. The use of organic manure such as application of FYM has been proved to be viable component of INM for SRI (Ch. Sowmya and M. Venkat Raman, 2012).
- 8. Background information SRI has been proved to be a whole package of agronomic approaches which utilizes the- genetic potential of plants through creation of a favourable soil environment. The favourable soil environment is largely contributed by the nutrient management i.e. not only the source and dose, but also the time and proportion on N application. This information is quite important for effective nutrient management in SRI method of rice cultivation. Basing on the above facts the experiment has been devised to study the effect of Integrated nutrient management approaches in SRI at RRTTS, OUAT, Bhawanipatna, Odisha.
- 9. Objective To devise a location specific economic and effective method of “Integrated nutrient management method in System of Rice Intensification (SRI)”.
- 10. Materials and Methods • Title : Integrated nutrient management approaches under SRI • Experimental design : Randomized Block design • No. of treatments : Eight • No. of replications : Three • Crop &Variety : Paddy, Ajay(Hybrid) • Season and year : Kharif, 2013 • Seed rate : 5 kg/ha • Spacing : 25cm × 25cm ( 01 seedlings/clump ) • Basal manuring (NPK) and top dressing :As per treatment • Previous crop and fertilizer applied : Rice with 80-40-40 kg
- 11. Integrated nutrient management approaches under SRI Treatments: T1: Recommended dose of fertiliser(RDF), with 1/3rd N at transplanting (Tp)+ 1/3rd N at 2nd weeding(W2)+ 1/3rd N at panicle initiation(PI). T2: 5t FYM+50% RDF, with 1/3rd N at transplanting+1/3rd N at 2nd weeding +1/3rd at panicle initiation T3 : 5t FYM+75% RDF, with 1/3rd N at transplanting+1/3rd N at 2nd weeding +1/3rd at panicle initiation T4 : 5t FYM+RDF , with 1/3rd N at transplanting(Tp)+1/3rd N at 2nd weeding +1/3rd at panicle initiation
- 12. • T5: 5t FYM+RDF , with 1/2 N transplanting+1/4th N at 2nd weeding+1/4th N at Panicle initiation • T6: 5t FYM+RDF with 1/4thN at transplanting+1/2N at 2nd weeding +1/4th N at panicle initiation. • T7: 10 t FYM +50% RDF with 1/3rd N at transplanting+1/3rd N at 2nd weeding +1/3rd at panicle initiation • T8: 5t FYM+2.5 t vermicompost(VC) +Biofertiliser(BF) (Azosporillum + PSB @5kg/ha each) at transplanting. • All qnty. of FYM, V.C., B.F., P2O5 and K2O applied as basal as per treatments and N was applied as split dose as per treatments • R.D.F.- 120:60:60 kg/ha, N: P2O5 : K2O
- 13. Soil properties : clay, neutral pH (7.37), low in organic carbon (0.27%), low in available N (162.5kg/ha), low in available P2O5 (20.8kg/ha) and high in available K2O (405.9kg/ha) Observations recorded: No of effective tillers/hill, length of panicle, No. of grains/panicle , 1000grain weight, grain yield, straw yield & Economics
- 14. Table 1. Effect of INM treatments on yield attributing characters of SRI rice at maturity Treatments No of effective tillers/m2 Panicle Length (cm) No. of filled grains per panicle 1000 grain weight(g) RDF, with N 1/3rd at Tp+1/3rd at W2+1/3rd at PI 130 29.6 168 25.15 5tFYM+50%RDF, with N 1/3rd at Tp+1/3rd at W2+1/3rd at PI 133 30.3 182 25.38 5tFYM+75%RDFwith N 1/3rd at Tp+1/3rd at W2+1/3rd at PI 144 30.5 192 25.69 5tFYM+RDFwith N 1/3rd at Tp+1/3rd at W2+1/3rd at PI 164 32.7 195 26.20 5tFYM+RDF with N 1/2 at Tp+1/4th at W2+1/4th at PI 158 32.5 194 25.81 5tFYM+RDF with N 1/4th at Tp+1/2 at W2+1/4th at PI 179 34.7 203 26.46 10tFYM+50%RDFwith N 1/3rd at Tp+1/3rd at W2+1/3rd at PI 134 30.3 190 25.42 5t FYM+2.5t VC+ Azosporillum and PSB @5kg each at Tp 118 27.7 161 24.86 CD(P=0.05) 19.2 1.8 25 1.4
- 15. Table 2. Effect of INM treatments on yield and economics of SRI rice at maturity Treatments Grain yield (kg/ha) Straw yield (kg/ha) Gross return (Rs./ha) Cost of cultivation (Rs./ha) Net return (Rs./ha) Return/ rupee invested RDF, with N 1/3rd at Tp+1/3rd at W2+1/3rd at PI 4822 4825 67511 33954 33557 1.99 5tFYM+50%RDF, with N 1/3rd at Tp+1/3rd at W2+1/3rd at PI 5103 5098 71433 35127 36306 2.03 5tFYM+75%RDFwith N 1/3rd at Tp+1/3rd at W2+1/3rd at PI 5838 5808 81705 36790 44915 2.22 5tFYM+RDFwith N 1/3rd at Tp+1/3rd at W2+1/3rd at PI 6621 6548 92633 38454 54179 2.41 5tFYM+RDF with N 1/2 at Tp+1/4th at W2+1/4th at PI 6526 6485 91327 38454 52873 2.37 5tFYM+RDF with N 1/4th at Tp+1/2 at W2+1/4th at PI 7284 7042 101763 38454 63309 2.65 10tFYM+50%RDFwith N 1/3rd at Tp+1/3rd at W2+1/3rd at PI 5797 5775 81143 39627 41516 2.05 5t FYM+2.5t VC+ Azosporillum and PSB
- 16. Results and Discussion : • Among the nutrient management practices application of 5t FYM + RDF with split application of N as 1/4th N at transplanting + 1/2 N at 2nd weeding + 1/4th N at panicle initiation recorded highest no. of effective tillers /m2(179), no. of filled grains/panicle (203) and longest panicle length of 34.7cm followed by 5t FYM+RDF with split application of 1/3rd N at transplanting (Tp)+1/3rd N at 2nd weeding +1/3rd at panicle initiation (10.27, 195.0 and 32.5cm). • This might be due to better availability of applied nitrogen during active tillering stage and better assimilation of photosynthates. Similarly, this result is in agreement with Gupta and Sharma (1991).
- 17. The rice plant absorbed 50% nitrogen by the early panicle initiation stage and about 80% of applied nitrogen by the heading stage (Biswas et al., 1996). Lowest no. of effective tillers/m2 (118), filled grains/ panicle (161.0) and panicle length (27.7cm) were observed in treatment 5t FYM+2.5 t vermicompost + Biofertiliser (Azosporillum+ PSB @5kg/ha each) at transplanting. Highest test weight of 26.46g was recorded in T6 followed by T4(26.2g), T5(25.81g), T3(25.69g), T7(25.42g), T2(25.38g), T1(25.15g) and T8(24.86g).
- 18. Highest Significant yield of 7284kg/ha was observed in treatment which received FYM + RDF with split application of N as 1/4th N at transplanting (Tp)+ 1/2 N at 2nd weeding(W2) + 1/4th N at panicle initiation (PI) (T6)followed by 6621kg/ha in 5t FYM+RDF with split application of 1/3rd N at Tp+1/3rd N at W2 +1/3rd at PI (T4), 6526kg/ha in 5tFYM+RDF with N 1/2 at Tp+1/4th at W2+1/4th at PI (T5), 5838kg/ha in 5tFYM+75%RDF with N 1/3rd at Tp+1/3rd at W2+1/3rd at PI (T3) , 5797kg/ha in 10tFYM+50%RDF with N 1/3rd at Tp+1/3rd at W2+1/3rd at PI(T7), 5103kg/ha in 5tFYM+50%RDF, with N 1/3rd at Tp+1/3rd at W2+1/3rd at PI (T2), 4822kg/ha in RDF with N 1/3rd at Tp+1/3rd at W2+1/3rd at PI ( T1) and the lowest in 5t FYM+2.5t VC+ Azosporillum and PSB @5kg each at Tp
- 19. Application of FYM along with RDF was found to be superior than application of only RDF and only organic manures. This was in confirmation with the findings of Bharathy (2005). Split application of nitrogen as 1/4th N at transplanting+1/2N at 2nd weeding +1/4th N at panicle initiation resulted in better yield and yield attributes which is in confirmation with the findings of Gupta and Sharma (1991). Straw yield marked the similar trend with grain yield and the treatments significantly differed from each other for straw yield. Highest gross return , net return, and return/ rupee invested were highest in T6, followed by T4, T5, T3, T , T and T .
- 20. Conclusion: Among the nutrient management practices application of nutrient from both organic and inorganic sources recorded the higher yield and yield attributing traits (T6 , T4, T5, T3 and T7) than only inorganic (T1 - 4822kg/ha) and only organic treatment (T8 – 4119 kg/ha). Combination of organic and inorganic fertilizer i.e. 5t FYM+RDF with split application of N as 1/4th at Tp + ½ at W2 +1/4th at PI recorded highest yield (7284 kg/ha) . This treatment also recorded highest yield attributing traits.
- 21. Field view of INM in SRI rice 21 DAT
- 22. Field view of INM in SRI rice kharif-2013
- 23. 5tFYM+RDF with1/4th N at Tp + 1/2 N at W2 +1/4th N at PI 5tFYM+2.5t VC+B.F.
- 24. 5tFYM+RDF with1/4th N at Tp + 1/2 N at W2 +1/4th N at PI 5tFYM+2.5t VC+B.F.
- 25. Weeder operation in SRI field