1. PAPER – 5 : ADVANCED MANAGEMENT ACCOUNTING
Question No. 1 is compulsory.
Answer any Five questions from the remaining six questions.
Working notes should form part of the answer.
Question 1
(a) A potato chips manufacturing company decided that the mean net weight per pack of its
product must be 90 grams. A random sample of 16 packets yields a mean weight of 80
grams with standard deviation of 17.10 grams. Test the hypothesis that the mean of the
whole universe is less than 90, use level of significance of (a) 0.05 (b) 0.01. (5 Marks)
(b) What are the steps involved in Zero-base budgeting? (5 Marks)
(c) G Ltd. produces and sells 95,000 units of ‘X’ in a year at its 80% production capacity.
The selling price of product is ` 8 per unit. The variable cost is 75% of sales price per
unit. The fixed cost is ` 3,50,000. The company is continuously incurring losses and
management plans to shut-down the plant. The fixed cost is expected to be reduced to
`1,30,000. Additional costs of plant shut-down are expected at `15,000.
Should the plant be shut-down? What is the capacity level of production of shut-down
point? (5 Marks)
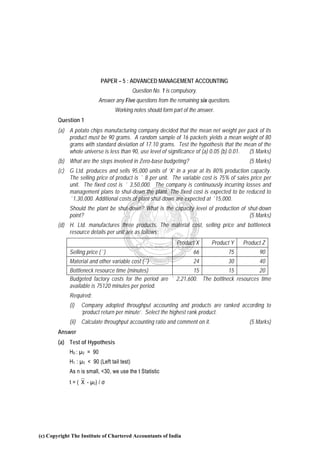
(d) H. Ltd. manufactures three products. The material cost, selling price and bottleneck
resource details per unit are as follows:
Product X Product Y Product Z
Selling price (`) 66 75 90
Material and other variable cost (`) 24 30 40
Bottleneck resource time (minutes) 15 15 20
Budgeted factory costs for the period are ` 2,21,600. The bottlneck resources time
available is 75120 minutes per period.
Required:
(i) Company adopted throughput accounting and products are ranked according to
‘product return per minute’. Select the highest rank product.
(ii) Calculate throughput accounting ratio and comment on it. (5 Marks)
Answer
(a) Test of Hypothesis
H0 : µ0 = 90
H1 : µ0 < 90 (Left tail test)
As n is small, <30, we use the t Statistic
t = ( X - µ0) / σ
(c) Copyright The Institute of Chartered Accountants of India
2. FINAL (NEW) EXAMINATION : NOVEMBER, 2010
σ = S / √n = 17.10/√16 = 4.275
t = (80 – 90) / 4.275 = -2.339 ~ -2.4
Calculated t = -2.339, < table value of t.05(15 degrees of freedom) which is -1.753 Hence,
reject the null hypothesis at 5% level of significance
Calculated t = -2.339, >table value of t.01 (15 dof) which is -2.602. Hence, accept the null
hypothesis at 1% level of significance.
(b) Steps involved in the process of Zero Based Budgeting:
1. Determination of a set of objects is the pre-requisite and essential step in the
direction of ZBB technique.
2. Deciding about the extent to which the technique of ZBB is to be applied whether in
all areas of organization activities or only in few selected areas on trial basis.
3. Identify the areas where decisions are required to be taken.
4. Developing decision packages and ranking them in order of performance.
5. Preparation of bu dget that is translating decision packages into practicable
units/items and allocating financial resources.
ZBB is simply an extension of the cost, benefit analysis method to the area of corporate
planning and budgeting.
(c)
If plant is continued If plant is shutdown
Sales 7,60,000 -
Less:Variable Cost 5,70,000 -
Contribution 1,90,000
Less:Fixed Cost 3,50,000 1,30,000
Additional Cost 15,000
Operating Loss 1,60,000 1,45,000
A comparison of loss figures indicated as above points out that loss is reduced by
(16,000-14,500) Rs. 15,000 if plant is shut down.
3,50,000 - 14,5000 20,500
Shut down point = = = 1,02,500 units
8-6 2
Capacity level of shut down point:
95,000
At 100% level production is = 1,18,750
0.80
1,02,500
Capacity level at shut down = = 86.31%
1,18,750
2
(c) Copyright The Institute of Chartered Accountants of India
3. PAPER – 5 : ADVANCED MANAGEMENT ACCOUNTING
Alternative Solution
Rs.
If the plant is shut down, the sunk cost or fixed expenses 1,45,000
If it is working at 80% capacity, the fixed cost 3,50,000
Additional fixed expenses 2,05,000
Contribution (95000*2) 1,90,000
Incremental Loss on Continuing 15,000
Decision - better to shut down
Production at shut-down point
2 x – 350000 = 1,45,000
2x = 2,05,000
x = 1,02,500 Units
Capacity % = 1,02,500/(95,000/0.8) = 86.31%
(d) (i) Calculation of Rank according to product return per minute
Particulars X Y Z
Selling Price 66 75 90
Variable Cost 24 30 40
Throughput Contribution 42 45 50
Minutes per unit 15 15 20
Contribution per minute 2.8 3 2.5
Ranking II I III
(ii)
Factory Cost per minute( 221600/75120) 2.95 2.95 2.95
TA Ratio = Contrb per min / cost per minute 0.95 1.02 0.85
Ranking based on TA Ratio II I III
Comment : P roduct Y yields more contribution compared to a verage factory
contribution per minute, whereas X and Z yield less.
Question 2
(a) E Ltd. manufactures and sells four types of products under the brand names A, B, C and D.
On a turnover of ` 30 crores in 2009, company earned a profit of 10% before interest and
depreciation which are fixed. The details of product mix and other information are as follows:
Products Mix% to total sales PV Ratio (5) Raw material as %
on sales value
A 30 20 35
3
(c) Copyright The Institute of Chartered Accountants of India
4. FINAL (NEW) EXAMINATION : NOVEMBER, 2010
B 10 30 40
C 20 40 50
D 40 10 60
Interest and depreciation amounted to `225 lakhs and ` 115.50 lakhs respectively. Due
to increase in prices in the international market, the company anticipates that the cost of
raw materials which are imported will increase by 10% during 2010. The company has
been able to secure a license for the import of raw materials of a value of ` 1,535 lakhs
at 2010 prices. In order to counteract the increase in costs of raw materials, the
company is contemplating to revise its product mix. The market survey report indicates
that the sales potential of each of the products: ‘A’, ‘B’ and ‘C’ can be increased upto
30% of total sales value of 2009. There was no inventory of finished goods or work in
progress in both the year.
You are required to :
Set an optimal product mix for 2010 and find the profitability. (12 Marks)
(b) List out the remedies available for difficulties experienced during implementation of
PRAISE. (4 Marks)
Answer
(a) Revised P/V ratio and ranking of products:
Revised
Increase in
Existing Revised raw Contribution
Raw material
Product P/V ratio P/V material as per Rs. 100 of Rank
cost as % of
% Ratio % of sale raw material %
sales value
value
A 20 3.5 16.5 38.50 42.86% III
B 30 4 26 44.00 59.09% II
C 40 5 35 55.00 63.64% I
D 10 6 4 66.00 6.06% IV
Maximum Sales potential
A 30 % Rs. 3000 900
B 30 % Rs. 3000 900
C 30 % Rs. 3000 900
D 40 % of 3000 1200
Allocation of raw material whose supply is restricted to Rs. 1535 lacs in order of raw
material profitability.
4
(c) Copyright The Institute of Chartered Accountants of India
5. PAPER – 5 : ADVANCED MANAGEMENT ACCOUNTING
Raw Material
Sales Raw Material Balance Raw
Product Rank per Rs. 100
Rs . In lacs Equired Material
Lacs Sales
C I 900 55 495 1040
B II 900 44 396 644
A III 900 38.5 346.5 297.5
D IV 451** 66 297.5* 0
* Balancing figure, hence sales will be restricted to 451** lakhs ( 297.5/66%)
Profitability Statement Rs. In Lakhs
Existing (2009) Proposed(2010)
Product Sales P/V Ratio Contribution Sales P/V Ratio Contribution
A 900 20 180 900 16.5 148.5
B 300 30 90 900 26 234
C 600 40 240 900 35 315
D 1200 10 120 451 4 18.04
Total 3000 1630 3151 3715.54
Less : Fixed Costs* 2330 330
Profit before Dep and Int. 300 385.54
Less :Depreciation 225 225.00
Less :Interest 115.5 115.50
Profit before tax (40.5) 45.04
* Balancing figure(Contribution - Profit before Depreciation & Interest)
The increase of contribution of Rs 85.54 in 2010 will set off loss of Rs 40.50 lakhs and
result in profit of Rs 45.04 lakhs.
(b) Remedies available for difficulties experienced in each step available during
implementation of praise:
Sl. Activities Remedies
No.
1. Problem Identification Participate in programs like brain storming, multi voting,
GD etc Precise definition of a problem and quantification.
2. Ranking · Participative approach
· Sub ordination of individual to group approach.
3. Analysis · Lateral thinking/Brain storming.
4. Innovation · Systematic evaluation of all aspects of each strategy.
5
(c) Copyright The Institute of Chartered Accountants of India
6. FINAL (NEW) EXAMINATION : NOVEMBER, 2010
5. Solution · Effective internal communication.
· Training of personnel/managers
6. Evaluation · Participative approach
· Effective control system to track actual feedback
system
Question 3
(a) A company is engaged in manufacturing of several products. The following data have
been obtained from the record of a machine shop for an average month:
Budgeted
No. of working days 24
Working hours per day 8
No. of direct workers 150
Efficiency One standard hour per clock hour
Down time 10%
Overheads
Fixed ` 75,400
Variable ` 90,720
The actual data for the month of August 2010 are as follows:
Overheads
Fixed ` 78,800
Variable ` 70,870
Net operator hours worked 20,500
Standard hours produced 22,550
There was a special holiday in August 2010.
Required :
(i) Calculate efficiency, activity, calendar and standard capacity usages ratio.
(ii) Calculate all the relevant fixed overhead variances.
(iii) Calculate variable overheads expenditure and efficiency variance. (10 Marks)
(b) A firm makes two products X and Y, and has a total production capacity of 16 tonnes per
day. X and Y are requiring the same production capacity. The firm has a permanent
contract to supply at least 3 tonnes of X and 6 tonnes of Y per day to another company.
Each tonne of X require 14 machine hours of production time and each tonne of Y
requires 20 machine hours of production time. the daily maximum possible number of
6
(c) Copyright The Institute of Chartered Accountants of India
7. PAPER – 5 : ADVANCED MANAGEMENT ACCOUNTING
machine hours is 280. All the firm’s output can be sold, and the profit made is ` 20 per
tonne of X and ` 25 per tonne of Y.
Required:
Formulate a linear programme to determine the production schedule for maximum profit
by using graphical approach and calculate the optimal product mix and profit. (6 Marks)
Answer
(a)
Ratio Working Result
Output expressed in Standard Hours
Efficiency Ratio (22550/20500)*100 = 110%
Actual Hours Worked
Output expressed in Standard Hours (22550/25920)*100 = 87%
Activity Ratio
Budgeted output in standard hours or 86.99 %
Actual Working days ina period
Calender Ratio No. of working days in related budget period (23/24)*100 = 96%
Standard Capacity Budget Hours
(25920/28800)*100 = 90%
usage ratio Maximum No. of hours in related period
Workings
Maximum Hours = 24 ´ 8 ´ 150 28,800
Budgeted Hours = 28800 less 10% 25,920
Actual Hours (given) 20,500
Standard Hours (produced) 22,550
Budgeted Working days 24
Actual Working days 23
Standard Rate X Standard Standard Rate X Standard Actual Hours X Actual
Hours Hours Rate
(1) (2) (3)
(90720/25920)*22550 (90720/25920)*20500 Given
Rs. 78925 Rs. 71750 Rs. 70870
7
(c) Copyright The Institute of Chartered Accountants of India
8. FINAL (NEW) EXAMINATION : NOVEMBER, 2010
Variable Overhead Efficiency Variance (1) - (2) Rs. 7175 (F)
Variable Overhead Expenditure Variance (2) - (3) Rs. 880 (F)
Variable Overhead Variance (1) - (3) Rs. 8055 (F)
Budgeted Fixed Overheads
Standard Rate Standard Rate X Standard Rate Standard Rate X Actual
X Standard Actual Hours X Revised Budgeted Hours Overheads
Hours Budgeted Hours
(1) (2) (3) (4) (5)
2.91 X 22550 2.91 X 20500 2.91 X 24840 Given Given
= 65621 = 59655 = 72284 = 75400 = 78800
Fixed Overhead Efficiency Variance (1) - (2) Rs. 5,966(F)
Fixed Overhead Capacity Variance (2) - (3) Rs.12,629(A)
Fixed Overhead Calender Variance (3) - (4) Rs. 3,116(A)
Fixed Overhead Volume Variance (1) - (4) Rs. 9,779(A)
Fixed Overhead Expenditure Variance (4) - (5) Rs. 3,400(A)
Fixed Overhead Variance (1) - (5) Rs.13,179(A)
(b) Maximise Z 20 x + 25 y
Subject to x + y ≤16
x≥3
y≥6
14 x+20 y ≤ 280
x,y > 0
8
(c) Copyright The Institute of Chartered Accountants of India
9. PAPER – 5 : ADVANCED MANAGEMENT ACCOUNTING
Z= 20 x + 25y Total Contribution
Point X Y
A 3 6 210
B 10 6 350
C 6.67 9.33 367- Optimal
D 3 12 360
The maximum value of objective function Z= 370 occurs at extreme point C (6.67,9.33).
Hence company should produce x1 = 6.67 tonnes of pr oduct X and x2 = 9.33 tones of
prod Y in order to yield a maximum profit of Rs. 367.
Question 4
Attempt any four
(a) The following information is given by Z Ltd.:
Margin of safety ` 1,87,500
Total cost ` 1,93,750
Margin of safety 7500 units
Break-even sales 2500 units
Required:
Calculate Profit, P/V Ratio, BEP Sales (in ` )and Fixed Cost. (4 Marks)
(b) Explain the major components of balanced score card. (4 Marks)
(c) List the 5 steps involved in the methodology of critical path analysis. (4 Marks)
(d) Calculate the selling price per unit to earn a return of 12% net on capital employed (net
of tax @40%). The cost of production and sales of 80,000 units are:
Variable cost including material cost ` 9,60,000
Fixed overheads ` 5,00,000
The fixed portion of capital employed is ` 12 lakhs and the varying portion is 50% of
sales turnover. (4 Marks)
(e) What are the steps involved in carrying out Monte Carlo simulation model? (4 Marks)
Answer
(a) Margin of Safety(%) = MoS Units/Actual Sales Units
= 7500/(7500+2500) = 75%
Total Sales = 187500/0.75 = Rs.2,50,000/-
9
(c) Copyright The Institute of Chartered Accountants of India
10. FINAL (NEW) EXAMINATION : NOVEMBER, 2010
Profit = Total sales – Total Cost
= 250000 – 193750 = Rs.56250
P/V Ratio = Profit/MoS (Rs.) ´ 100
= 56250/187500 ´ 100 = 30%
BEP Sales = Total Sales / (100 – MS)
= 2,50,000 ´ 0.25 = Rs.62,500
Fixed Cost = Sales x P/V Ratio
= 250000 ´ 0.30-56250 = 18750
Alternate Answer 1
Margin of Safety = Selling Price per unit ´ ( 7500 units)
Rs. 187500 = Selling Price per unit ´ ( 7500 units)
Therefore ,
Selling Price per unit = 187500/7500 =Rs. 25
Profit Rs.
Sales 10000 ´ 25 2,50,000
Less: Total Cost 1,93,750
Profit 56,250
P/V Ratio Profit/Margin of Safety
56250/187500= 30%
BEP Sales 2500 ´25 Rs. 62,500
Fixed Cost 62500 ´ 30%= Rs. 18,750
Alternative Answer 2
Selling price = Rs 187500/ 7500 = Rs.25
Total Cost at Break Even point=Rs.25 ´ 2500 = 62500 = Break Even Sales
(Total Cost – Total Cost of BE)/(Total Units – Break Even Units) = Variable Cost per Unit
(93,750 – 62,500)/(10,000 – 2,500) = 1,31,250/7,500 = Rs.17.50 per unit
Selling Price = 25.00
Variable Cost = 17.50
Contribution = 7.50
P/V Ratio = 7.50/25 = 30%
Fixed Cost = 7.50 ´ 2500 units = Rs.18750.
Profit = 7.50 ´ 7500 = Rs. 56,250
10
(c) Copyright The Institute of Chartered Accountants of India
11. PAPER – 5 : ADVANCED MANAGEMENT ACCOUNTING
(b) Well disgned balanced score card combines financial measures of past performance with
measures of the firm’s drivers of future performance. Generally the Balanced Score Card
has the following perspectives from which a company’s activity can be evaluate
1. Customer perspective i.e how customers see us?
2. Internal perspective ie. In what processes must the firm excel?
3. Innovation & learning perspective i.e,can we continue to improve and create value?
4. Financial perspective i.e., how we look to our share holders?
(c) Working Methodology of PERT:
The working methodology of PERT which includes both CPM and PERT, consists of
following five steps:
1. Analyze and break down the project in terms of specific activities and/or events.
2. Determine the interdependence and sequence of specific activities and prepare a
net-work.
3. Assign estimates of time, cost or both to all the activities of the network.
4. Identify the longest or critical path through the network.
5. Monitor, evaluate and control the progress of the project by re-planning,
rescheduling and reassignment of resources.
(d) Let 'x' be the selling price per unit, Therefore, Turnover = 80000 x
Capital Employed = 1200000+40000 x
Return on capital employed after tax = 12%
Therefore,
Return on capital employed before tax = 12/0.6 =20%
Therefore,
Return on capital employed before tax = 20% of (1200000+40000x) = 240000+8000x
Sales 80000 x
Variable Cost 960000
Fixed Cost 500000
Profit 80000x – 1460000
Therefore
80000x – 1460000 = 240000 + 8000x
72000x = 1700000
X = Rs. 23.61
11
(c) Copyright The Institute of Chartered Accountants of India
12. FINAL (NEW) EXAMINATION : NOVEMBER, 2010
Alternative Answer
Selling price per unit should cover Variable cost unit, Fixed Cost per unit and ROCE per
unit
Fixed Capital Employed = Rs.12 lacs
Required Return (net of tax) = 12% = Rs.1,44,000
Pre tax return = 1,44,000 / 0.6 = Rs.2,40,000
Let Selling Price per unit = X
X = (14,60,000+2,40,000)/20,000 + (12% of 50% of X)/0.6
= 17,00,000/20,000 + 6/100 ´ 1/0.6 X
X(1- 0.1) = 21.25
X = 21.25/0.9 = Rs.23.61 per unit
Required Selling price = Rs.23.61
If a student has arrived at Rs.23.61, full 4 marks may be given even if the intermediary
steps are not adequately shown.
(e) Steps involved in Monte Carlo simulation are:
(i) To select the measure of effectiveness of the problem, that is, what element is used
to measure success in improving the system modeled. This is the element one
wants to maximize or minimize.
(ii) Identifying the variables which influence the measure of effectiveness significantly.
(iii) Determining the proper cumulative probability distribution.
(iv) To get a set of random numbers.
(v) Consideration of each random number as a decimal value of the cumulative
probability distribution. With the decimal, enter the cumulative distribution plot from
the vertical axis, Project this point horizontally, until it intersects cumulative
probability distribution curve.
(vi) Recording the value generated in step(v) into the formula derived from the chose
measures of effectiveness. Solve and record the value.
(vii) Repeating steps (V) and (VI) until sample is large enough for the satisfaction of the
decision maker.
Question 5
(a) Fruitolay had decided to increase the size of the store. It wants the information about the
probability of the individual product lines : Lemon, grapes and papaya. It provides the
following data for the 2009 for each product line:
12
(c) Copyright The Institute of Chartered Accountants of India
13. PAPER – 5 : ADVANCED MANAGEMENT ACCOUNTING
Lemon Grapes Papaya
Revenues ` 79,350.00 ` 2,10,060.00 ` 1,20,990.00
Cost of goods sold ` 60,000.00 ` 1,50,000.00 ` 90,000.00
Cost of bottles returned ` 1,200.00 `0 `0
Number of purchase orders placed 36 84 36
Number of deliveries received 30 219 66
Hours of shelf stocking time 54 540 270
Items sold 12,600 1,10,400 30,600
Fruitolay also provides the following information for the year 2009:
Sr.No. Activity Description of Activity Total costs Cost
(`) allocation
basis
1. Bottle returns Returning of empty bottles to 1,200.00 Direct tracing
the store to product line
2. Ordering Placing of orders of 15,600.00 156 purchase
purchases orders
3. Delivery Physical delivery and the 25,200.00 315 deliveries
receipts of merchandise
4. Self stocking Stocking of merchandise on 17,280.00 864 hours of
store shelves and ongoing time
restocking
5. Customer Assistance provided to 30,720.00 153600 items
support customers including bagging sold
and checkout
Required:
(i) Fruitolay currently allocates store support costs (all costs other than the cost of
goods sold) to the product line on the basis of the cost of goods sold of each
product line. Calculate the operating income and operating income as the
percentage of revenue of each product line.
(ii) If Fruitolay allocates store support costs (all costs other than the cost of goods sold)
to the product lines on the basis of ABC system, calculate the operating income and
operating income as the percentage of revenue of each product line.
(iii) compare both the systems. (11 Marks)
(b) Discuss various forecasting methods using time series. (5 Marks)
13
(c) Copyright The Institute of Chartered Accountants of India
14. FINAL (NEW) EXAMINATION : NOVEMBER, 2010
Answer
(a)
(i) Particulars Lemon Grapes Papaya Total
Revenue 79,350 2,10,060 1,20,990 4,10,400
Less: Cost of goods sold (COGS) 60,000 1,50,000 90,000 3,00,000
Less: Store Support Cost 18,000 45,000 27,000 90,000
Operating income 1,350 15,060 3,990 20,400
Operating Income % 1.70% 7.17% 3.30% 4.97%
(ii) ABC System
Activity Cost Total Costs Quantity Of Cost Overhead
Heirarchy ( Rs) Allocation Base Allocation
Level Rate
Ordering Batch 15600.00 156 Purchase orders Rs. 100
Delivery Batch 25200.00 315 delivering orders Rs. 80
Shelf stocking Output unit 17280.00 864 self stocking hours Rs. 20
Customer Output unit 30,720.00 153600 items sold Rs. 0.20
support
Particulars Cost Driver Lemon Grapes Papaya Total
Bottle Returns Direct 1,200 0 0 1,200
Ordering Purchase orders 3,600 8,400 3,600 15,600
Delivery Deliveries 2,400 17,520 5,280 25,200
Self Stocking Hours of time 1,080 10,800 5,400 17,280
Customer Support Items Sold 2,520 22,080 6,120 30,720
Grand Total 10,800 58,800 20,400 90,000
Particulars Lemon Grapes Papaya Total
Revenue 79,350 2,10,060 1,20,990 410,400
Less: Cost of goods sold 60,000 1,50,000 90,000 300,000
Less: Store Support Cost 10,800 58,800 20,400 90,000
Operating income 8,550 1,260 10,590 20,400
Operating Income % 10.78% 0.60% 8.75% 4.97%
14
(c) Copyright The Institute of Chartered Accountants of India
15. PAPER – 5 : ADVANCED MANAGEMENT ACCOUNTING
Summary
Lemon Grapes Papaya Total
Under Traditional Costing System 1.70% 7.17% 3.30% 4.97%
Under ABC System 10.78% 0.60% 8.75% 4.97%
The grapes line drops sizeably when ABC is used. Although it constitutes 50 % COGS, it
uses a h igher percentage of total resources in each activity area., especially the high
cost of customer support area. In contrast, lemon line draws a much lower percentage of
total resources used in each activity area than its percentage of total COGS. Hence
under ABC, Lemon is most profitable. Fruitolay can explore ways to increase sales of
lemons and also explore price increases on grapes.
Operating Income Ranking is highest for Grapes under Traditional System because other
products bear its overhead cost, whereas under ABC a m ore accurate picture shows
Grapes as the lowest ranking product.
(b) Forecasting methods using Time series.
(i) Mean forecast: In this method we calculate mean of the series for the time period t
and take this value as representative of the future time series. Yt = Y
(ii) Naïve forecast:-This method is based on the assumption that the future will exactly
resemble the past. We forecast the value, for the time period t, to be equal to the
actual value observed in the previous period t that is, time period (t-1) Yt = Y t-1
(iii) Linear trend forecast: A linear relationship is established between the time and the
variable under study, which may be represented by Yt = a + bX
Where X will be found from the value of t and a and b are constants.
(iv) Non –linear trend forecast: In this method, a non-linear relationship between the
time and the response value has been found again by least squares method. Then
the value, for the time period t, will be calculated from the non-linear equation;
Yt= a +bX +cX2
(v) Forecasting by exponential smoothing: In this method, the forecast value for the
time period t is found using exponential smoothing of time series
Yt = Yt-1 + a (Yt - Yt-1 ) where Yt-1 = the forecasted value for time period t
Yt = the observed value for time period t.
Question 6
(a) A company has three plants located at A, B and C. The production of these plants is
absorbed by four distribution centres located at X, Y, W and Z. the transportation cost
per unit has been shown in small cells in the following table:
15
(c) Copyright The Institute of Chartered Accountants of India
16. FINAL (NEW) EXAMINATION : NOVEMBER, 2010
Distribution Centres X Y W Z Supply
Factories (Units)
A 6 9 13 7 6000
B 6 10 11 5 6000
C 4 7 14 8 6000
Demand (Units) 4000 4000 4500 5000 18000
17500
Find the optimum solution of the transportation problem by applying Vogel’s
Approximation Method. (8 Marks)
(b) Mention the data required to operate the material requirement planning system. (4 Marks)
(c) “Customer profile is important in charging cost.” Explain this statement in the light of
customer costing in service sector. (4 Marks)
Answer
(a) Step 1 : Initial Allocation based on Least cost cells corresponding to highest differences
X Y W Z Dummy Total
A 2,000 3,500 500 6,000
B 1,000 5,000 6,000
C 4,000 2,000 6,000
TOTAL 4,000 4,000 4,500 5,000 500 18,000
Step 2 : Δij Matrix values for Unallocated cells
X Y W Z Dummy
A 0 0
B 2 3 2
C 3 3 2
All Δij values > 0. Therefore initial allocation is optimal.
Step 3 : Optimal Transportation Cost
Units Costs Total
involved
A to Y 2,000 9 18,000
A to W 3,500 13 45,500
B to W 1,000 11 11,000
B to Z 5,000 5 25,000
C to X 4,000 4 16,000
16
(c) Copyright The Institute of Chartered Accountants of India
17. PAPER – 5 : ADVANCED MANAGEMENT ACCOUNTING
C to Y 2,000 7 14,000
Total minimum cost 1,29,500
Note : Since there are zeroes in the Δij Matrix alternate solutions exist.
(b) Data requirements to operate material requirement planning system:
1. The master Production schedule: This schedule specifies the quantity of each
finished unit of products to be produced and the time at which each unit will be
required.
2. The Bill of material file:The bill of material file specifies the sub-assemblies,
components and materials required for each of the finished goods.
3. The inventory file:This file maintains details of items in hand for each sub-assembly,
components and materials required for each of the finished goods.
4. The routing file:This file specifies the sequence of operations required to
manufacture sub-assemblies, components and finished goods.
5. The master parts file:This file contains information on the production time of sub-
assemblies; components produced internally and lead times for externally acquired
items.
(c) Customer costing in the service sector:
The customer costing is a new approach to m anagement. The central theme of this
approach is customer satisfaction. In some service industries, such as public relations,
the specific output of industry may be difficult to identify and even more difficult to
quantify. Further there are multiple customers, identifying support activities i.e. common
costs with particular customer may be more problematic. In such cases it is important to
cost customer. An ABC analysis of customers profitability provides valuable information
to help management in pricing customer .Consider a banking sector. A bank‘s activities
for customer will include the following types of activities. These are:
i. Stopping a cheque
ii. Withdrawal of cash
iii. Updation of pass book
iv. Issue of duplicate pass book
v. Returning a cheque because of insufficient funds
vi. Clearing of a customer cheque.
Different customers or categories of customers use different amount of these activities
and so customer profiles can be built up and customer can be charged according to the
cost to serve them.
Customer profile is important in analyzing cost under the following categories
17
(c) Copyright The Institute of Chartered Accountants of India
18. FINAL (NEW) EXAMINATION : NOVEMBER, 2010
1. Customer specific costs: These are the direct and indirect cost of providing service
to customer plus customer related cost assigned to each customer.
For example: cost of express courier service to a c lient who requests over-night
delivery of some agreement.
2. Customer – line categories: These are the costs which are broken into broad
categories of customers and not individual customers.
Question 7
(a) A company has two divisions : Division a and Division B. Both divisions of the company
manufacture the same product but located at two different places. The annual output of
division A is 6000 tons (at 80% capacity) and that of division B is 7500 tons (at 60%
capacity). The basic raw material required for production is available locally at both the
places, but at division A, it is limited to 4000 tons per annum at the rate of `100 per ton,
at division B, it is limited to 8000 tons per annum at the rate of `110 per ton. Any
additional requirement of material will have to be purchased at a rate of `125 per ton
from other markets at either of division. Variable costs per ton at each division remain
constant. For every 1000 tons of output, 800 tons raw material is required. The details
of other costs of the divisions are as follows:
Division A Division B
Other variable costs of output (`) 122 per ton 120 per ton
Fixed cost per annum(`) 3,80,000 6,00,000
Required:
(i) Calculate variable cost per ton for each division’s product and decide ranking in
order to preference.
(ii) The company desires to fully utilize the available local supplies of raw material to
save the overall variable cost of production; keeping the total production of both the
divisions putting together is the same as at present level. Calculate the quantity of
production (output) that could be transferred between the two divisions and overall
saving in variable cost.
(iii) After considering the option (ii), how the balance capacity should be utilized if
company is working at 100% capacity, and also calculate selling price per ton if
company mark up 10% on full cost of each division’s product. (12 Marks)
(b) Explain distinctive features of learning curve theory in manufacturing environment. (4 Marks)
Answer
(a) variable cost per ton in different alternatives
Division A Division B
Particulars Local Outside Local Outside
18
(c) Copyright The Institute of Chartered Accountants of India
19. PAPER – 5 : ADVANCED MANAGEMENT ACCOUNTING
Material per ton 0.8 0.8 0.8 0.8
Rate per ton 100 125 110 125
Cost of material 80 100 88 100
Other Variable cost per ton 122 122 120 120
Total Variable Cost 202 222 208 220
Ranking I IV II III
Maximum production at both divisions 6000+7500 = 13500 tons
Rank Division Market Material Output Total Balance
13,500
I A Local 4,000 5,000 5,000 8,500
II B Local 6,800 8,500 13,500 0
Total 10,800 13,500
Statement showing saving in overall variable cost of proposed mix
Variable
Production
Production (Current Mix) cost per Amount (Rs.)
(tons)
ton
Division A from local Market 5,000 202 10,10,000
Division A from outside Market 1,000 222 2,22,000
Division B from local Market 7,500 208 15,60,000
Total Variable Cost of Production 13,500 27,92,000
Production (Proposed Mix)
Division A from local Market 5,000 202 10,10,000
Transfer from Division A to B as variable cost 8,500 208 17,68,000
in Division B is less than other market cost
(6000-5000)= 1000 output required 800 tons
input.
Total Variable Cost of Production 13,500 27,78,000
Transfer from Division A to Division B 1000 tons output will save in variable cost
Rs.2792000-2778000=14000.
At 100% capacity the production is
Div A Div B Total
Output (in tons) 6000/0.80 = 7,500 7500/0.6 = 12,500 20,000
Output already used 5,000 8,500 13,500
Balance capacity (tons) 2,500 4,000 6,500
19
(c) Copyright The Institute of Chartered Accountants of India
20. FINAL (NEW) EXAMINATION : NOVEMBER, 2010
Input required (tons) 6,000 10,000
Input locally available 4,000 8,000
Input locally used 4,000 6,800
Balance available (input local) NIL 1,200
Rank Div Market Material Output Total Balance Output
6500
2nd B Local 1200 1500 1500 5000
3rd B Outside 2000 2500 4000 2500
4th A Outside 2000 2500 2500 NIL
Total cost of production and Selling price per tone
Amount
Division A Amount (Rs.) Division B (Rs.)
Variable Cost Output x VC Output x VC
Local Material 5000 ´ 202 10,10,000 8500+1500=10000 ´ 208 20,80,000
Outside Material 2500 ´ 222 5,55,000 2500*220 5,50,000
Fixed Cost 3,80,000 6,00,000
TOTAL COST (full cost) 19,45,000 32,30,000
Profit 1,94,500 3,23,000
Selling Price 21,39,500 35,53,000
Selling Price per tonne 285.27 284.24
Alternative Answer
Division A Division B
Raw Raw
Output Material Output Material
Current production 6,000 4,800 7,500 6,000
Maximum Production 7,500 12,500
Maximum production from Local Raw material 5,000 4,000 10,000 8,000
Division A Division B
20
(c) Copyright The Institute of Chartered Accountants of India
21. PAPER – 5 : ADVANCED MANAGEMENT ACCOUNTING
Outside Local Outside
Local Raw Raw Raw Raw
Material Material Material Material
Raw material cost per ton of output 80 100 88 100
Variable Overhead per ton of output 122 122 120 120
Total Variable Cost 202 222 208 220
Rank I IV II III
Current Mix (Output) M 5,000 1,000 7,500 -
Divisional subtotal of output 6,000 7,500
Maximum Possible Output 5,000 2,500 10,000 2,500
Divisional subtotal of max. output 7,500 12,500
Proposed optimal mix current output N 5,000 - 8,500 0
Savings in Variable Cost = 1000 x (222-208) = 14,000
(Difference between rows M and N)
Division A Division B
Local Raw Outside Raw Local Raw Outside Raw
Material Material Material Material
Maximum Prodn Capacity (Output) 5,000 2,500 10,000 2,500
202 ´ 2 + 222 ´ 1 208 ´ 4 + 220 ´ 1
= 208.67 = 210.10
Weighted average Variable Cost per 3 5
tonne
Division A Division B
Variable Cost per unit 208.67 210.40
Fixed Cost per unit 50.67
380000/7500 48.00 600000/12500
Total Cost per ton 259.34 258.40
Markup @ 10% 25.93 25.84
Total Selling price per ton 285.27 284.24
(b) The production quantity of a given item doubled the cost of that item decrease at a fixed
rate. This phenomenon is the basic premise on which the theory of learning curve has
been formulated.
21
(c) Copyright The Institute of Chartered Accountants of India
22. FINAL (NEW) EXAMINATION : NOVEMBER, 2010
The distinctive features of a learning curve are:
1. Better tooling methods are developed and used
2. More productive equipments are designed and used to make the product.
3. Design bugs are detected and corrected.
4. Better design engineering reduces material and labour costs.
5. Early teething problems are overcome. As production progresses management is
prompted to achieve better planning and better management.
6. Rejections and rework tend to diminish over time.
7. As quantity produced increases the Cost per unit decreases, since each unit entails:
(i) Lesser labour (ii) Greater productivity of material and labour (iii) Fewer delays and
lesser time losses.
22
(c) Copyright The Institute of Chartered Accountants of India