Bladex presentación de llamada en conferencia 2 trim15 (inglés)
JPM 2016 equity research
1. JP Morgan Chase & Co. JPM
Financial Services‐ Diversified US Banks Buy
$67.53 ‐ $72.15
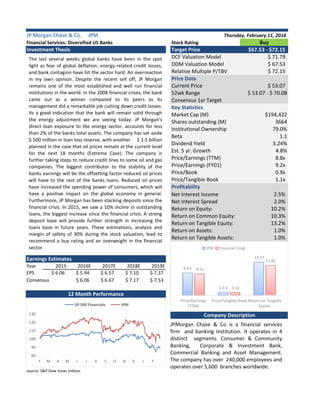
DCF Valuation Model $ 71.79
DDM Valuation Model $ 67.53
Relative Multiple P/TBV $ 72.15
Price Data
Current Price $ 53.07
52wk Range $ 53.07 ‐ $ 70.08
Consensus 1yr Target
Key Statistics
Market Cap (M) $194,422
Shares outstanding (M) 3664
Institutional Ownership 79.0%
Beta 1.1
Dividend Yield 3.24%
Est. 5 yr. Growth 4.8%
Price/Earnings (TTM) 8.8x
Price/Earnings (FY01) 9.2x
Price/Book 0.9x
Price/Tangible Book 1.1x
Profitability
Net Interest Income 2.5%
Net Interest Spread 2.0%
Return on Equity: 10.2%
Return on Common Equity: 10.3%
Return on Tangible Equity: 13.2%
Return on Assets: 1.0%
Return on Tangible Assets: 1.0%
Year 2015 2016E 2017E 2018E 2019E
EPS $ 6.06 $ 5.94 $ 6.57 $ 7.10 $ 7.37
Consensus $ 6.06 $ 6.67 $ 7.17 $ 7.53
source: S&P Dow Jones Indices
Company Description
12 Month Performance
Thursday, February 11, 2016
Investment Thesis Target Price
Earnings Estimates
Stock Rating
8.8 x
1.1 x
13.17
8.5x
1.1x
11.85
Price/Earnings
(TTM)
Price/Tangible Book Return on Tangible
Equity:
JPM Financial Congl.
JPMorgan Chase & Co is a financial services
firm and banking institution. It operates in 4
distinct segments. Consumer & Community
Banking, Corporate & Investment Bank,
Commercial Banking and Asset Management.
The company has over 240,000 employees and
operates over 5,600 branches worldwide.
The last several weeks global banks have been in the spot
light as fear of global deflation, energy related credit losses,
and bank contagion have hit the sector hard. An overreaction
in my own opinion. Despite the recent sell off, JP Morgan
remains one of the most established and well run financial
institutions in the world. In the 2008 financial crises, the bank
came out as a winner compared to its peers as its
management did a remarkable job cutting down credit losses.
Its a good indication that the bank will remain solid through
the energy adjustment we are seeing today. JP Morgan's
direct loan exposure to the energy sector, accounts for less
than 2% of the banks total assets. The company has set aside
$ 500 million in loan loss reserve, with another $ 1.5 billion
planned in the case that oil prices remain at the current level
for the next 18 months (Extreme Case). The company is
further taking steps to reduce credit lines to some oil and gas
companies. The biggest contributor to the stability of the
banks earnings will be the offsetting factor reduced oil prices
will have to the rest of the banks loans. Reduced oil prices
have increased the spending power of consumers, which will
have a positive impact on the global economy in general.
Furthermore, JP Morgan has been stacking deposits since the
financial crisis. In 2015, we saw a 10% incline in outstanding
loans, the biggest increase since the financial crisis. A strong
deposit base will provide further strength in increasing the
loans base in future years. These estimations, analysis and
margin of safety of 30% during the stock valuation, lead to
recommend a buy rating and an overweight in the financial
sector.
80
90
100
110
120
130
F M A M J J A S O N D J F
SP 500 Financials JPM
2. Risks
Key Drivers
Valuation
• JP Morgan's massive branch and ATM network, combined
with excellent customer service will continue to attract
deposits from customers.
• Historically 56.5% of JPM outstanding loans have been
allocated towards the consumer segment. As Global
fundamentals continue to improve, I expect JPM
to increase the allocation towards the consumer
segment, which represents most of the banks revenue
and the highest interest yield for the company, therefore
driving growth in earnings in future years.
• M&A has picked up in recent years, but it won't be
sufficient to provide a boost in investment banking
revenues, as the FICC revenues continue to slump with no
indication of a recovery any time soon.
• Low interest rates will still originate reasonable deposit
costs, maintaining the interest margin above 2%.
• "Too big to fail" banks are becoming less risky as we enter
the advanced fully phased Basel III capital requirements.
As banks become less risky, the gap between return on
equity and cost of equity widens, we should see clear signs
of value creation.
$‐
$20,000
$40,000
$60,000
2013 2014 2015 2016 2017 2018 2019 2020
Non‐Interest revenue
Asset Management
Principal Transactions
Investment Banking Fees
Mortgage & Deposit Fees, Other
• JP Morgan is considered a 'too big to fail" bank, which
means its always under scrutiny from regulators. New
regulations inherited after the financial crisis have
increased the costs of compliance for JP Morgan, but the
company has taken all the necessary steps to offset those
costs with reduction of expenses in other departments.
• New regulations have impacted revenues as well. A new
more established leverage ratio and stringent capital
requirements have limited several sources of revenue;
proprietary trading, interchanging fees, alternative risky
investments, to name a few.
• There have been talks that large financial institutions such
as JP Morgan should break up, to smaller easier to handle
and more distinct businesses.
‐
200,000
400,000
600,000
800,000
1,000,000
1,200,000
1,400,000
1,600,000
1,800,000
2013 2014 2015 2016 2017 2018 2019 2020
Loans: Deposits:
I utilized three different valuation methods to
derive a range of prices; Free Cash Flow to Equity,
Dividend Discount model, and Price to Tangible
Book Value. The range of prices given by the model
are between $68 to $72 per share using
conservative assumptions. This entitles to a margin
of safety of at least 28%. In the base case scenario, I
expect interest margin to remain relative flat
increasing to 2.2% at the end of 2020 from the
current 2.04%, reflecting an increase in interest
margins in the consumer loan portfolio. Non‐
interest revenues will grow at the modest growth
rate of 1% mostly driven by higher mortgage and
deposit fees. On the expense side, I forecast that
JP Morgan will decrease its expenses over time as
litigation and foreclosed property expenses slowly
decline and reach an overhead ratio of 58% from
the current 63%. Loans will increase at an average
rate of 3% reflecting the fact financial institutions
cannot grow its loan portfolio without affecting
risk and the capital ratio requirements. In addition,
loan provisions as a percentage of total loans
will increase to 0.55% from 0.47% reflecting the
added loan provisions need for potential credit
losses from the energy sector. Finally, I expect
Return to tangible Equity to average 12% over
the next 5 years decreasing to its cost of equity
during the maturity stage, reflecting a lower
sustainable growth rate in the terminal value
and higher payout ratios.
3. JP Morgan Chase & Co. ‐ FCFE
($ in Millions)
December 31, 2015A 2016E 2017E 2018E 2019E 2020E
Risk Weighted Assets $ 1,488,887 $ 1,612,289 $ 1,676,752 $ 1,788,958 $ 1,922,707 $ 1,979,796
Tier 1 Ratio 11.8% 11.4% 11.1% 10.7% 10.4% 10.0%
Tier 1 Capital 175,398 $ 184,194 $ 185,588 $ 191,637 $ 199,117 $ 197,980
Change in Regulatory Capital (Tier 1) $ 8,796 $ 1,394 $ 6,049 $ 7,481 ($ 1,138)
Book Value of Equity 221,505 $ 232,022 $ 247,001 $ 262,838 $ 277,883 $ 294,634
Normalized Net Income 22,406 21,458 23,284 24,790 25,334 28,263
Less: Investment in Regulatory Capital: (8,796) (1,394) (6,049) (7,481) 1,138
FCFE $ 12,661 $ 21,890 $ 18,741 $ 17,853 $ 29,401
Discount Period: 1.00 2.00 3.00 4.00 5.00
Mid‐Year Discount Period: 0.50 1.50 2.50 3.50 4.50
PV of Dividends: $ 12,096 $ 19,086 $ 14,913 $ 12,966 $ 19,487
JP Morgan Chase & Co.‐ DCF Assumptions JP Morgan Chase & Co.‐ DCF Valuation
Terminal Value: $ 278,312
Mid‐Year Convention: Yes
Maturity Year Begins: 2020 PV of Terminal Value: $ 184,468
Sum of PV of FCFE: $ 78,547
Terminal Earnings Growth:
2.4% Value of Equity: $ 263,015
Minimum CET 1 ratio: 10.0%
Cost of Equity: 9.6% Number of Shares: 3,664
Implied Equity Value per share: $ 71.79
JPMorgan Chase & Co. ‐ Net Present Value Sensitivity ‐ Terminal Growth Rates
Cost of Equity
#### 9.0% 9.3% 9.6% 9.9% 10.2%
4.0% 99.27 92.91 87.27 77.72 73.64
3.0% 85.66 80.96 76.71 69.36 66.15
2.4% 79.49 75.46 71.79 65.37 62.55
2.0% 75.96 72.30 68.95 63.04 60.43
1.5% 72.08 68.80 65.78 60.43 58.05
Footnotes
Terminal Earnings
Growth Rate
Methodology: The problem incorporated in most DDM models used to value banks, is the fact that it ignores repurchases, which for
some banks it composes a significant form of payout to shareholders. Even if models utilize some simplistic assumption about
repurchases, they still can have a great effect on the outcome of the valuation. Professor Aswath Damodaran from Stern Business
School at NYU, teaches a new profound way of valuing a banking institution such as JP Morgan. A banks FCFE is the net income after
any reinvestments have been made to cover the minimum capital ratios, thus leaving the rest of the unretained income to be
given away to shareholders either through Dividends or Stock repurchases. Utilizing this methodology, it solves the problem
of share repurchases that can have a significant impact on our valuation.
Cost of Equity: Cost of equity is calculated using the CAPM model. The risk free rate is derived from the 10 yr. government bond of
the underlying currency valued, in this case the 10 yr. US treasury. I use an industry average beta because through the law of
averages I want to diminish the standard errors inherited in the calculation of individual company's beta through the regression
model. Finally, the equity risk premium is calculated through the dividend discount methodology to solve for risk inherited in the US
market.
4. Comparable Companies ‐ US‐Based Diversified Commercial Banks with Over $1 Trillion in Assets
($ in Millions Except Per Share Amounts)
Oper. Statistics Capitalization & Assets Tangible BV Per Share (2) Return on Tangible Equity (3)
Actual Projected Actual ProjectedEquity Tangible
Company Name Value (1) Book Value (2) 2015 2016 2015 2016
Citigroup Inc. $ 103,306 $ 173,419 $58.72 $43.73 9.2% 11.8%
Bank of America $ 116,756 $ 163,416 $15.62 $11.16 8.8% 12.5%
Wells Fargo $ 232,677 $ 140,344 $23.42 $25.09 17.5% 16.5%
Maximum $ 232,677 $ 173,419 $60.61 $43.73 17.5% 16.5%
75th Percentile $ 174,716 $ 168,418 $41.07 $34.41 13.4% 14.5%
Median $ 116,756 $ 163,416 $23.42 $25.09 9.2% 12.5%
25th Percentile $ 110,031 $ 151,880 $19.52 $18.12 9.0% 12.2%
Minimum $ 103,306 $ 140,344 $15.62 $11.16 8.8% 11.8%
Average $ 150,913 $ 159,060 $32.59 $26.66 11.9% 13.6%
JP Morgan Chase $ 200,237 $ 173,165 $47.27 $56.56 13.2% 12.2%
Valuation Statistics Capitalization & Assets Price / Tangible BV Per Share (2)
Equity Tangible Actual Projected
Company Name Value (1) Book Value (2) 2015 2016 2017
Citigroup Inc. $ 103,306 $ 173,419 0.6 x 0.8 x 0.8 x
Bank of America Corporation $ 116,756 $ 163,416 0.7 x 1.0 x 0.9 x
Wells Fargo & Company $ 232,677 $ 140,344 1.9 x 1.8 x 1.7 x
Maximum $ 232,677 $ 173,419 1.9 x 1.8 x 1.7 x
75th Percentile $ 174,716 $ 168,418 1.3x 1.4x 1.3x
Median $ 116,756 $ 163,416 0.7 x 1.0 x 0.9 x
25th Percentile $ 110,031 $ 151,880 0.7 x 0.9 x 0.9 x
Minimum $ 103,306 $ 140,344 0.6 x 0.8 x 0.8 x
Average $ 150,913 $ 159,060 1.1x 1.2x 1.1x
JPMorgan Chase & Co. $ 200,237 $ 173,165 1.1 x 1.0 x 0.9 x
$ 62.46 $ 72.15 $ 73.53 JP Morgan Chase Valuation based on Trading Comps (4):
Footnotes
Important Disclaimer
(1) Equity Value as of February 11th, 2016.
(2) Tangible Book Value excludes Preferred Stock, Non‐Controlling Interests, Goodwill, and non‐MSR Intangible Assets.
(3) Tangible Equity excludes Preferred Stock, Non‐Controlling Interests, Goodwill, and non‐MSR Intangible Assets.
(4) Based on comparables the trading price to tangible book value should be 1.4x.
(5) Selection of comparables was based on total assets under book to reflect the risk level of the bank.
This report is intended to provide potential employers and other interested parties an example of the analytical skills, investment
knowledge, and communication abilities of the analyst. The analyst is not a registered investment advisor. The investment opinion
contained in this report does not represent an offer or solicitation to buy or sell any of the aforementioned securities. Unless
otherwise noted, facts and figures included in this report are from publicly available sources.