+97470301568>>buy weed in qatar,buy thc oil in qatar doha>>buy cannabis oil i...
Rollover report oct nov 2010-
1. Rollover Report
India Research
Oct 29, 2010
SEBI Registration No: INB 010996539 For Private Circulation Only 1
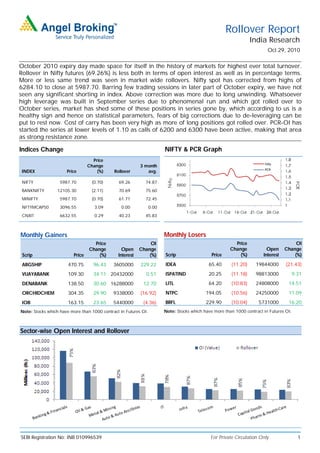
NIFTY & PCR GraphIndices Change
INDEX Price
Price
Change
(%) Rollover
3 month
avg.
NIFTY 5987.70 (0.70) 69.26 74.87
BANKNIFTY 12105.30 (2.11) 70.69 75.60
MINIFTY 5987.70 (0.70) 61.71 72.45
NFTYMCAP50 3096.55 3.09 0.00 0.00
CNXIT 6632.55 0.29 40.23 45.83
Monthly Gainers
Scrip Price
Price
Change
(%)
Open
Interest
Ol
Change
(%)
ABGSHIP 470.75 96.43 3605000 229.22
VIJAYABANK 109.30 34.11 20432000 0.51
DENABANK 138.50 30.60 16288000 12.70
ORCHIDCHEM 304.35 29.90 9338000 (16.92)
IOB 163.15 23.65 5440000 (4.36)
Note: Stocks which have more than 1000 contract in Futures OI.
Sector-wise Open Interest and Rollover
Monthly Losers
Scrip Price
Price
Change
(%)
Open
Interest
Ol
Change
(%)
IDEA 65.40 (11.20) 19844000 (21.43)
ISPATIND 20.25 (11.18) 98813000 9.31
LITL 64.20 (10.83) 24808000 14.51
NTPC 194.05 (10.56) 24250000 11.09
BRFL 229.90 (10.04) 5731000 16.20
Note: Stocks which have more than 1000 contract in Futures OI.
October 2010 expiry day made space for itself in the history of markets for highest ever total turnover.
Rollover in Nifty futures (69.26%) is less both in terms of open interest as well as in percentage terms.
More or less same trend was seen in market wide rollovers. Nifty spot has corrected from highs of
6284.10 to close at 5987.70. Barring few trading sessions in later part of October expiry, we have not
seen any significant shorting in index. Above correction was more due to long unwinding. Whatsoever
high leverage was built in September series due to phenomenal run and which got rolled over to
October series, market has shed some of these positions in series gone by, which according to us is a
healthy sign and hence on statistical parameters, fears of big corrections due to de-leveraging can be
put to rest now. Cost of carry has been very high as more of long positions got rolled over. PCR-OI has
started the series at lower levels of 1.10 as calls of 6200 and 6300 have been active, making that area
as strong resistance zone.
2. Derivative Report | India Research
For Private Circulation Only SEBI Registration No: INB 010996539 2
Banking and Financials
In this space, where large cap banks have shed
open interest and have shown less of rollovers,
many midcap PSU banks have added substantial
OI and witnessed high rollovers too.
Private biggies like ICICIBANK (58.84%) and
HDFCBANK (61.98%) have shown less rollover
and have shed substantial OI as prices corrected
from higher levels. Stocks have strong support
around 1050 and 2150 levels respectively.
UCOBANK (88.81%), DENABANK (86.67%),
BANKBARODA (85.54%) and ORIENTBANK
(80.04%) are counters where long positions were
added and most of them got rolled over too.
Oil and Gas
This sector has shown high rollovers and
substantial addition in OI. All three OMC’s have
added significant OI as they consolidated with
negative bias.
ONGC (72.13%) has been biggest
underperformer in the sector and lot of short
positions got added in the mean time which got
rolled over too. 1250-1270 is strong support zone;
short covering is expected there.
Finally RELIANCE (80.81%) was a big outperformer
but this performance was on back of short
covering. Though we don’t expect big corrections
but resistance zone of 1130-1150 is intact for the
counter.
Metal and Mining
JINDALSAW (93.84%) has seen highest rollover in
this sector and month-on-month has added decent
OI. We believe it’s more of long positions and
hence suggest to trade with positive bias in it.
After fantastic Sept series, TATASTEEL (83.84%) has
corrected in Oct and added few short positions.
570-580 is very strong support zone. Any dip to
those levels is a buying opportunity.
NATIONALUM (51.64%) has shown least rollover
and is very light in OI. It’s a range bound stock
between 395 and 450. Looking at OI and history
of stock, we believe future may go in deep discount
and hence arbitrage opportunity.
3. Derivative Report | India Research
For Private Circulation Only SEBI Registration No: INB 010996539 3
Auto and Auto Ancillary
Information Technology
Infrastructure
TATAMOTORS (81.76%) has shown decent
rollovers but has shed substantial positions in OI.
After one more month of dream run, we believe
this stock will now pause or slightly correct from
current levels. 1140 and 1100 are support points.
Ancillaries like APOLLOTYRE (85.01%) and
EXIDEIND (81.23%) have shown formation of
shorts in last month and these positions have been
rolled over to current month.
BAJAJAUTO (76.69%) has reduced significant
open interest on month-on-month basis despite in
an uptrend.
Midcap IT counters ROLTA (90.05%), FSL (89.32%)
and POLARIS (84.05%) have shown high rollovers
and have added substantial open interest. Stocks
are near to their support levels. One can selectively
go long in them.
After disappointing results, WIPRO (69.75%) has
seen sharp correction due to long unwinding.
Counter has rolled over very less positions and has
strong support around 400-410. Avoid fresh
shorting in it.
In series gone by, there was long unwinding in
INFOSYSTCH (73.04%) and formation of long in
TCS (70.06%) is indicating a switch over by some
participants.
Only HCC (89.78%) and JPASSOCIAT (83.80%)
were in green in this space in last series and that
too due to short covering.
GMRINFRA (90.78%), NAGARCONST (87.57%)
and IVRCLINFRA (77.83%) continued to realm
under selling pressure and have added further
short positions.
Not much of shorting is visible in PATELENG
(84.73%) and stock has strong support around
360 levels. We would suggest going long near
support in this counter.
10. Derivative Report | India Research
For Private Circulation Only SEBI Registration No: INB 010996539 10
DISCLAIMER:
This document is not for public distribution and has been furnished to you solely for your information and must not be reproduced or redistributed to any other person.
Persons into whose possession this document may come are required to observe these restrictions.
Opinion expressed is our current opinion as of the date appearing on this material only. While we endeavor to update on a reasonable basis the information discussed in
this material, there may be regulatory, compliance, or other reasons that prevent us from doing so. Prospective investors and others are cautioned that any forward-
looking statements are not predictions and may be subject to change without notice. Our proprietary trading and investment businesses may make investment decisions
that are inconsistent with the recommendations expressed herein.
The information in this document has been printed on the basis of publicly available information, internal data and other reliable sources believed to be true and are for
general guidance only. While every effort is made to ensure the accuracy and completeness of information contained, the company takes no guarantee and assumes no
liability for any errors or omissions of the information. No one can use the information as the basis for any claim, demand or cause of action.
Recipients of this material should rely on their own investigations and take their own professional advice. Each recipient of this document should make such investigations
as it deems necessary to arrive at an independent evaluation of an investment in the securities of companies referred to in this document (including the merits and risks
involved), and should consult their own advisors to determine the merits and risks of such an investment. Price and value of the investments referred to in this material may
go up or down. Past performance is not a guide for future performance.
Certain transactions - futures, options and other derivatives as well as non-investment grade securities - involve substantial risks and are not suitable for all investors.
Reports based on technical analysis centers on studying charts of a stock's price movement and trading volume, as opposed to focusing on a company's fundamentals and
as such, may not match with a report on a company's fundamentals.
We do not undertake to advise you as to any change of our views expressed in this document. While we would endeavor to update the information herein on a reasonable
basis, Angel Broking, its subsidiaries and associated companies, their directors and employees are under no obligation to update or keep the information current. Also
there may be regulatory, compliance, or other reasons that may prevent Angel Broking and affiliates from doing so. Prospective investors and others are cautioned that
any forward-looking statements are not predictions and may be subject to change without notice.
Angel Broking Limited and affiliates, including the analyst who has issued this report, may, on the date of this report, and from time to time, have long or short positions
in, and buy or sell the securities of the companies mentioned herein or engage in any other transaction involving such securities and earn brokerage or compensation or
act as advisor or have other potential conflict of interest with respect to company/ies mentioned herein or inconsistent with any recommendation and related information
and opinions.
Angel Broking Limited and affiliates may seek to provide or have engaged in providing corporate finance, investment banking or other advisory services in a merger or
specific transaction to the companies referred to in this report, as on the date of this report or in the past.
Sebi Registration No.: INB 010996539
Derivative Research Team derivatives.desk@angeltrade.com