Booking open Available Pune Call Girls Talegaon Dabhade 6297143586 Call Hot ...
Gujarat Gas
1. 2QCY2010 Result Update | Oil & Gas
July 23, 2010
Gujarat Gas NEUTRAL
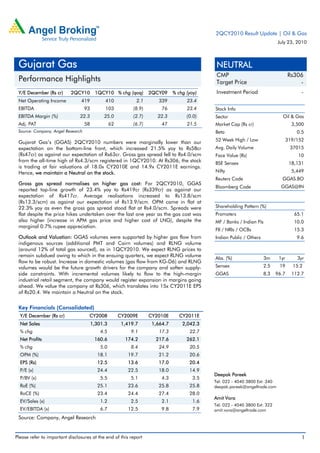
CMP Rs306
Performance Highlights Target Price -
Y/E December (Rs cr) 2QCY10 1QCY10 % chg (qoq) 2QCY09 % chg (yoy) Investment Period -
Net Operating Income 419 410 2.1 339 23.4
EBITDA 93 103 (8.9) 76 23.4 Stock Info
EBITDA Margin (%) 22.3 25.0 (2.7) 22.3 (0.0) Sector Oil & Gas
Adj. PAT 58 62 (6.7) 47 21.5 Market Cap (Rs cr) 3,500
Source: Company, Angel Research Beta 0.5
52 Week High / Low 319/152
Gujarat Gas’s (GGAS) 2QCY2010 numbers were marginally lower than our
expectation on the bottom-line front, which increased 21.5% yoy to Rs58cr Avg. Daily Volume 37015
(Rs47cr) as against our expectation of Rs63cr. Gross gas spread fell to Rs4.0/scm Face Value (Rs) 10
from the all-time high of Rs4.3/scm registered in 1QCY2010. At Rs306, the stock BSE Sensex 18,131
is trading at fair valuations of 18.0x CY2010E and 14.9x CY2011E earnings.
Hence, we maintain a Neutral on the stock. Nifty 5,449
Reuters Code GGAS.BO
Gross gas spread normalises on higher gas cost: For 2QCY2010, GGAS
Bloomberg Code GGAS@IN
reported top-line growth of 23.4% yoy to Rs419cr (Rs339cr) as against our
expectation of Rs417cr. Average realisations increased to Rs13.8/scm
(Rs13.3/scm) as against our expectation of Rs13.9/scm. OPM came in flat at
22.3% yoy as even the gross gas spread stood flat at Rs4.0/scm. Spreads were Shareholding Pattern (%)
flat despite the price hikes undertaken over the last one year as the gas cost was Promoters 65.1
also higher (increase in APM gas price and higher cost of LNG), despite the MF / Banks / Indian Fls 10.0
marginal 0.7% rupee appreciation.
FII / NRIs / OCBs 15.3
Outlook and Valuation: GGAS volumes were supported by higher gas flow from Indian Public / Others 9.6
indigenous sources (additional PMT and Cairn volumes) and RLNG volume
(around 12% of total gas sourced), as in 1QCY2010. We expect RLNG prices to
remain subdued owing to which in the ensuing quarters, we expect RLNG volume
Abs. (%) 3m 1yr 3yr
flow to be robust. Increase in domestic volumes (gas flow from KG-D6) and RLNG
volumes would be the future growth drivers for the company and soften supply- Sensex 2.5 19 15.2
side constraints. With incremental volumes likely to flow to the high-margin GGAS 8.3 96.7 112.7
industrial retail segment, the company would register expansion in margins going
ahead. We value the company at Rs306, which translates into 15x CY2011E EPS
of Rs20.4. We maintain a Neutral on the stock.
Key Financials (Consolidated)
Y/E December (Rs cr) CY2008 CY2009E CY2010E CY2011E
Net Sales 1,301.3 1,419.7 1,664.7 2,042.3
% chg 4.5 9.1 17.3 22.7
Net Profits 160.6 174.2 217.6 262.1
% chg 5.0 8.4 24.9 20.5
OPM (%) 18.1 19.7 21.2 20.6
EPS (Rs) 12.5 13.6 17.0 20.4
P/E (x) 24.4 22.5 18.0 14.9
Deepak Pareek
P/BV (x) 5.5 5.1 4.3 3.5
Tel: 022 - 4040 3800 Ext: 340
RoE (%) 25.1 23.6 25.8 25.8 deepak.pareek@angeltrade.com
RoCE (%) 23.4 24.4 27.4 28.0
Amit Vora
EV/Sales (x) 1.2 2.5 2.1 1.6
Tel: 022 - 4040 3800 Ext: 322
EV/EBITDA (x) 6.7 12.5 9.8 7.9 amit.vora@angeltrade.com
Source: Company, Angel Research
Please refer to important disclosures at the end of this report 1
2. Gujarat Gas | 2QCY2010 Result Update
Exhibit 1: 2QCY2010 Performance
Y/E December (Rs cr) 2QCY2010 1QCY2010 % chg (qoq) 2QCY2009 % chg (yoy) 1HCY2010 1HCY2009 % chg (yoy)
Net Operating Income 419 410 2.1 339 23.4 829 646 28.4
COGS 290 277 4.6 233 24.7 568 452 25.6
Total operating exp. 35 30 16.4 31 13.5 65 62 5.2
EBITDA 93 103 (8.9) 76 23.4 196 132 48.8
EBITDA Margin (%) 22.3 25.0 22.3 23.6 20.4
Other Income 6 4 44.7 7 (13.7) 10 14 (31.8)
Depreciation 13 13 4.3 12 15.1 26 23 16.1
Interest 0 0 896.0 0 931.1 0 0 482.2
PBT 85 94 (8.8) 71 20.9 179 123 45.3
PBT Margin (%) 20.4 22.8 20.8 21.6 19.1
Total Tax 27 32 (13.3) 23 18.9 59 39 51.1
% of PBT 32.1 33.8 32.6 33.0 31.7
PAT 58 62 (6.5) 48 21.8 120 84 42.6
Minority interest 0 0 36.9 0 73.4 1 0 77.6
Adj. PAT 58 62 (6.7) 47 21.5 119 84 42.4
PAT Margin (%) 13.7 15.0 14.0 14.4 13.0
Gas sales Volume (mmscm) 297 291 2.1 249 19.3 588 481 22.2
Gas sales Volume (mmscmd) 3.26 3.23 0.9 2.74 19.3 6.50 5.31 22.3
Source: Company, Angel Research
Exhibit 2: 2QCY2010 Actual v/s Estimates
(Rs cr) Estimates Actual Variation (%)
Net Operating Income 417 419 0.3
EBITDA 103 93 (9.7)
EBITDA Margin %) 24.8 22.3 2.5
PBT 95 85 (10.1)
Adj. PAT 63 58 (8.2)
Source: Company, Angel Research
Top-line up 23.4% driven by realisations and volume: GGAS reported top-line
growth of 23.4% yoy to Rs419cr (Rs339cr) for 2QCY2010 as against our
expectation of Rs417cr. Top-line was driven by an increase in average realisations
and volumes. Average realisations increased to Rs13.8/scm (Rs13.3/scm) as
against our expectation of Rs13.9/scm. Average realisations were higher owing to
the price hikes implemented by the company in May 2009 to cover the impact of
the depreciation in rupee on higher gas cost and CNG price hike effected on
December 20, 2009 to Rs29.96/kg (from Rs27.50/kg). Sequentially, realisations
remained flat.
July 23, 2010 2
3. Gujarat Gas | 2QCY2010 Result Update
Exhibit 3: Operating revenue trend
500 16.0
14.4
400 12.0
10.7
300 8.0
(Rs cr)
6.2
(%)
200 4.0
2.1
100 (0.5) -
- (4.0)
2QCY10 3QCY10 4QCY10 1QCY11 2QCY11
Operating Revenues Operating Revenues growth (RHS)
Source: Company, Angel research
RLNG off-take flat qoq on higher domestic gas supply: Gas sourcing during the
quarter was similar to the volume flow in 1QCY2010. During the quarter, the
company continued to receive additional 0.2mmscmd (as in 1QCY2010) from
PMT field, while supply from Cairn also stood higher at around 0.5mmscmd (as in
1QCY2010). RLNG off-take was flat sequentially at around 0.4mmscmd (around
12% of total volumes). However, on a yoy basis, volume grew on higher RLNG
volume off-take and increase in gas supply from domestic sources. Gas
distribution volumes during the quarter increased by 19.3% yoy to 297mmscm
(249mmscm), which was in line with our expectation of 295mmscm. During the
quarter, industrial retail volumes grew 20% as gas supplies increased and new
customers were also commissioned. More than 5,500 vehicles were converted to
CNG during the quarter, taking the total number of CNG vehicles now plying on
natural gas in the company’s markets to 119,000. Two new CNG stations were
also added during the quarter.
OPM flat yoy at 22.3%, dips 270bp qoq: Sequentially, the company’s OPM dipped
by 270bp to 22.3% (25.0%) mainly on account of the decrease in the gross gas
spread (selling price minus the gas cost), which fell to Rs4.0/scm from the all-time
high of Rs4.3/scm registered in 1QCY2010. This was on account of the increase in
APM gas price and higher cost of LNG during the quarter, despite the marginal
0.7% rupee appreciation. On a yoy basis, the company’s OPM stood flat at 22.3%
as even the gross gas spread stood flat at Rs4.0/scm. Operating expenditure was
also higher by 13.5% yoy to Rs35cr (Rs30.9cr), which exerted pressure on OPMs
during the quarter. Staff costs increased 8.3% yoy to Rs12cr (Rs11.1cr), whereas
other operating expenditure increased 16.4% yoy to Rs23cr (Rs19.8cr). Higher top-
line and flat OPM resulted in EBITDA increasing by 23.4% yoy (in line with top-line
growth) to Rs93cr (Rs76cr), which was lower than our expectation of Rs103cr.
July 23, 2010 3
4. Gujarat Gas | 2QCY2010 Result Update
Exhibit 4: Operating performance trend
120 35.2 40.0
100 33.4 30.0
80 20.0
(Rs cr)
60 10.0
(%)
8.4
40 -
(6.3) (8.9)
20 (10.0)
- (20.0)
2QCY10 3QCY10 4QCY10 1QCY11 2QCY11
Operating Profit Operating Margins (RHS)
Source: Company, Angel Research
Depreciation, interest costs in line: Depreciation was up 15.1% yoy to Rs13.4cr
(Rs11.6cr) due to investments in the pipeline network, CNG and other
infrastructure during the year. Since the company uses internal cash accruals to
meet its working capital requirements and for expansions, the interest costs were
negligible.
Higher top-line boosts PAT by 21.7%, but marginally below expectation: Other
income declined 13.7% yoy to Rs5.7cr (Rs6.6cr), while the effective tax rate was
marginally lower at 32.1% (32.4%). Bottom-line increased by 21.5% yoy to Rs58cr
(Rs47cr), but was marginally lower than our expectation of Rs63cr. Bottom-line
growth could be attributed entirely to volume growth.
Exhibit 5: PAT trend
70 40.0
34.0
60 30.1 30.0
50
40 20.0 (%)
(Rs cr)
30 10.0
20 3.6
-
10 (6.7)
(6.2)
- (10.0)
2QCY10 3QCY10 4QCY10 1QCY11 2QCY11
PAT PAT growth (RHS)
Source: Company, Angel Research
July 23, 2010 4
5. Gujarat Gas | 2QCY2010 Result Update
Investment Arguments
Supply-side woes receding on improving domestic gas availability and subdued
LNG prices: The company’s volume has shown a steady growth over the last one
year on improving gas availability in the country and subdued RLNG prices. We
expect the uptrend to continue, however there have been some delays in receiving
gas from KG-D6 on account of slow ramp up of gas production. However, the
company is ensuring that volume shortfall is compensated with higher RLNG
procurement. It recently entered into an agreement with BG India Energy Solutions
Pvt. Ltd. (BGIES) for the supply of 0.60mmscmd of R-LNG on a firm basis for the
months of July, August and September 2010. The company is also keen on
entering into long-term RLNG contracts. Increase in the domestic LNG import
capacity along with subdued LNG prices is likely to improve matters further. We
have factored in 0.50mmscmd and 0.75mmscmd of R-LNG volumes flow for
CY2010E and CY2011E, respectively. Thus, inclusion of R-LNG and KG gas in the
company’s sourcing mix will reduce the concentration risks associated with
sourcing from the PMT (76% in CY2008).
Gross gas spread on uptrend: Gross gas spread during CY2009 edged higher as
the company provided large proportion of its incremental gas to the high-margin
industrial retail customers. Thus, the company's profitability has been improving
with its focus shifting to the high-margin retail business from bulk customers
(decreased from 30.1% in CY2006 to 13.1% in CY2008). Going ahead, we expect
bulk volumes to be nil. We expect gross gas spread to increase going ahead to
Rs4.11/scm and Rs4.14/scm in CY2010E and CY2011E, respectively. This could
further improve on account of favourable exchange rate.
Capex on track in existing areas: Pending PNGRB authorisation for the company’s
existing areas of operation (Surat, Bharuch and Ankleshwar) has not thwarted the
company’s expansion plans in these areas. Going ahead, the company plans to
spend around Rs140-150cr each in CY2010E and CY2011E to enhance capacity.
This will ensure growth continues with expansion of infrastructure.
Outlook and Valuation
GGAS volumes during the quarter were supported by higher gas flow from
indigenous sources (additional PMT and Cairn volumes) as in 1QCY2010. Thus,
reliance on RLNG reduced to that extent to support its volume growth. In the
current quarter, RLNG constituted around 12% of total volumes. We expect RLNG
prices to remain subdued going ahead owing to which RLNG volume flow is
expected to be robust in the ensuing quarters. The company has also entered into
a contract with BGIES for 0.6mmscmd of RLNG supply on a firm basis (for July,
August and September, 2010 – i.e., 3QCY2010) to meet its growth requirements.
The company is also keen on entering into a term contract for procurement of
RLNG. It has received allocation of 0.6mmscmd of KG-D6 gas from the
Government of India on a fallback basis, and is in discussion with the suppliers
and transporters to finalise agreements for flowing this gas into its system. Thus,
going ahead, increase in domestic volumes (gas flow from KG-D6) and RLNG
volumes would be growth drivers for the company as well as soften the supply-side
constraints.
July 23, 2010 5
6. Gujarat Gas | 2QCY2010 Result Update
The company’s CNG segment has been clocking healthy growth, thereby
increasing its share in the volume matrix. More than 119,000 natural gas vehicles
are now plying in the company’s markets. Further, with incremental volumes likely
to flow to the high-margin industrial retail segment, the company would register
margin expansion going ahead. Also, potential appreciation of the rupee would be
the icing on the cake. In the current quarter, we saw gross gas spreads
normalising at Rs4/scm, falling from an all-time high of Rs4.3/scm registered in
1QCY2010. We don’t expect spread to fall below Rs4/scm as the company is able
to pass on any increase in the gas cost and benefit from rupee appreciation to
maintain its margins.
GGAS is still awaiting authorisation from PNGRB for its areas of operations in the
cities of Surat, Bharuch and Ankleshwar. However, with the notification of section
16 by MoPNG wef July 15, 2010, the company expects to receive authorisation
from PNGRB for its areas of operation in a month’s time. Pending authorization,
the company’s expansion plans have not been thwarted, as it continues to carry
out expansion in its existing areas of operations. In CY2009, the company incurred
capex of Rs155.3cr towards network expansion and infrastructure upgradation and
is awaiting clearance from the regulatory authorities before venturing into new
areas as per its plan. The company has filed an expression of interest application
to operate in certain areas of Kutch and Bhavnagar.
At the CMP of Rs306, the stock is trading at 18.0x CY2010E and 14.9x CY2011E
earnings. We believe at the current juncture, stock is fairly valued and thus
maintain Neutral on the stock. However, potential upside triggers for the stock
could be the GSPC IPO (has filed the RHP), where GGAS holds stake and
possibility of price hike in the industrial retail segment (last revised 18 months ago)
and CNG segment.
Exhibit 6: Key Assumptions
CY2010E CY2011E
Sales volumes (mmscmd) 3.28 3.92
Blended Realisation (Rs/scm) 13.63 14.01
Gas Purchase cost (Rs/scm) 9.52 9.87
Gross Gas Spread (Rs/scm) 4.11 4.14
Other Operating exp. (Rs/scm) 1.32 1.34
EBITDA (Rs/scm) 2.94 2.94
Source: Company, Angel Research
Exhibit 7: Angel EPS forecast v/s consensus
Angel Forecast Bloomberg Consensus Variation (%)
CY2010E 17.0 17.5 (2.9)
CY2011E 20.4 19.6 4.3
Source: Company, Angel Research
July 23, 2010 6
12. Gujarat Gas | 2QCY2010 Result Update
Research Team Tel: 022 - 4040 3800 E-mail: research@angeltrade.com Website: www.angeltrade.com
DISCLAIMER
This document is solely for the personal information of the recipient, and must not be singularly used as the basis of any investment
decision. Nothing in this document should be construed as investment or financial advice. Each recipient of this document should make
such investigations as they deem necessary to arrive at an independent evaluation of an investment in the securities of the companies
referred to in this document (including the merits and risks involved), and should consult their own advisors to determine the merits and
risks of such an investment.
Angel Broking Limited, its affiliates, directors, its proprietary trading and investment businesses may, from time to time, make
investment decisions that are inconsistent with or contradictory to the recommendations expressed herein. The views contained in this
document are those of the analyst, and the company may or may not subscribe to all the views expressed within.
Reports based on technical and derivative analysis center on studying charts of a stock's price movement, outstanding positions and
trading volume, as opposed to focusing on a company's fundamentals and, as such, may not match with a report on a company's
fundamentals.
The information in this document has been printed on the basis of publicly available information, internal data and other reliable
sources believed to be true, but we do not represent that it is accurate or complete and it should not be relied on as such, as this
document is for general guidance only. Angel Broking Limited or any of its affiliates/ group companies shall not be in any way
responsible for any loss or damage that may arise to any person from any inadvertent error in the information contained in this report.
Angel Broking Limited has not independently verified all the information contained within this document. Accordingly, we cannot testify,
nor make any representation or warranty, express or implied, to the accuracy, contents or data contained within this document. While
Angel Broking Limited endeavours to update on a reasonable basis the information discussed in this material, there may be regulatory,
compliance, or other reasons that prevent us from doing so.
This document is being supplied to you solely for your information, and its contents, information or data may not be reproduced,
redistributed or passed on, directly or indirectly.
Angel Broking Limited and its affiliates may seek to provide or have engaged in providing corporate finance, investment banking or
other advisory services in a merger or specific transaction to the companies referred to in this report, as on the date of this report or in
the past.
Neither Angel Broking Limited, nor its directors, employees or affiliates shall be liable for any loss or damage that may arise from or in
connection with the use of this information.
Note: Please refer to the important `Stock Holding Disclosure' report on the Angel website (Research Section). Also, please
refer to the latest update on respective stocks for the disclosure status in respect of those stocks. Angel Broking Limited and
its affiliates may have investment positions in the stocks recommended in this report.
Disclosure of Interest Statement Gujarat Gas
1. Analyst ownership of the stock No
2. Angel and its Group companies ownership of the stock No
3. Angel and its Group companies' Directors ownership of the stock No
4. Broking relationship with company covered No
Note: We have not considered any Exposure below Rs 1 lakh for Angel, its Group companies and Directors.
Ratings (Returns) : Buy (> 15%) Accumulate (5% to 15%) Neutral (-5 to 5%)
Reduce (-5% to 15%) Sell (< -15%)
July 23, 2010 12