
Empfohlen
Weitere ähnliche Inhalte
Was ist angesagt?
Was ist angesagt? (20)
Andere mochten auch
Mehr von A M
Mehr von A M (18)
5.3.1 causal em
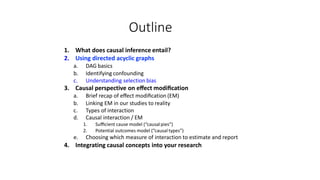
- 1. Outline 1. What does causal inference entail? 2. Using directed acyclic graphs a. DAG basics b. Identifying confounding c. Understanding selection bias 3. Causal perspective on effect modification a. Brief recap of effect modification (EM) b. Linking EM in our studies to reality c. Types of interaction d. Causal interaction / EM 1. Sufficient cause model (“causalpies”) 2. Potential outcomes model (“causal types”) e. Choosing which measure of interaction to estimate and report 4. Integrating causal concepts into your research
- 2. 2 Understanding selection bias with DAGS • A “selection factor” is a variable that influences whether or not each individual’s data ends up in the analysis • For example – Decides to participate in study – Loss to follow-‐up – Competing causes (of death) • In DAGs, colliders can indicate possible selection bias
- 3. • Conditioning on a variable means that you divide your data into strata based on that variable (also called “controlling for” or “adjusting for”) • Represented by putting a box around the variable – example of conditioning on a collider Review: Colliders A B C 3
- 4. 4 Selection bias • Selection bias is equivalent in DAG terminology to “conditioning on a collider” • Selection bias occurs when both the exposure and outcome affect whether or not an individual is included in the study data
- 5. • Conditioning on a collider can change the association (induce an association, alter a true association) between the two ancestor variables (A and B) A C B A C B Truth 5 Selection bias Selection bias
- 6. Outcome Selection factor • Effectively you analyze your study data within one stratum of any selection factor – You only have data on those who participated – You only have data on those retained in the study (not lost to follow-‐ up) • If exposure and outcome both cause the selection factor then you are “conditioning on a collider” Exposure Selection bias 6
- 7. Outcome Selection factor • Conditioning on a selection factor that is a collider will induce an association between exposure and outcome, or alter the true association between exposure and outcome Exposure Selection bias 7
- 8. Drug A CVD Retained in study (not lost to follow-‐up) Selection bias 8
- 9. 9 An example from 1970’s epidemiology: • Several case-‐control studies of postmenopausal hormone therapy and endometrial cancer • Enrolled women visiting medical practices • Studies reported a 10-‐foldincrease in risk of cancer among women taking hormone therapy • Was the increase in risk causal, or was it a result of bias? – Women with endometrial cancer may have been more likely to have symptoms that led them to visit doctor – Women taking postmenopausal hormone therapy may have been more likely to have symptoms that led them to visit doctor Selection bias
- 10. • Selection factor is visiting the medical practice where study recruitment is being carried out • Alters any true association between hormone therapy and endometrial cancer Hormone replacement therapy Endometrial cancer Visit medical practice, recruited for study Selection bias 80
- 11. 1 1 1. Define research hypothesis – Your hypothesis can include possible effect modification – Determine to what extent you aim to make causal inferences using your data 2. Determine study design (trial, cohort, etc.) 3. Draw a DAG a. Identify potential confounders b. Choose which variables to measure 4. Analyze your data a. b. c. Control for confounders identified in step 3 Assess effect modification on the additive or multiplicative scale Make statistical inferences 5. Make scientific inferences about your hypothesis Causal inference in your research
- 12. 1 2 1. Today we talked about identifying confounding and selection bias with DAGs 2. DAGs can also be used to identify: 1. Survivor bias 2. Residual confounding 3. Bias caused by missing data 4. How to estimate indirect or direct effects 5. Bias in matched case-‐controlstudies 3. Read more in Rothman’s Modern Epidemiology Causal Diagrams chapter (3rd edition or later) DAGs are a powerful tool!