Centennial-scale Holocene climate variations amplified by Antarctic Ice Sheet discharge
1. Introduction
Conclusions
Centennial-scale Holocene climate variations amplified by
Antarctic Ice Sheet discharge
P Bakkera,b, N R Golledgec,d, P U Clarkb, A Schmittnerb, M E Webere
SpectralPower(normalized)
Frequency (cycles yr-1
)
AABW CTRL
AABW FWF
Subsurf. temp. forcing
AIS discharge
IBRD
102
101
100
10-1
10-2
10-3
10-2
-2.4
-2.6
-2.8
-3.0
8Time (ka)
AABWstrength(Sv)
AISdischarge(Sv)
FWF-SO CTRL
0.6
0.4
0.2
0
-0.2
-0.4
-0.6
Temperatureanomalies(K)
SO surf So subsurf.
7 6 5 4 3
0.06
0.04
0.02
0
AverageIBRDflux
(grainsyr-1
cm-3
)
0.08
0.06
0.04
0.02
0.00
-0.02
-0.04
-0.06
-2 -1.2 -0.4 0.4
Zonal mean temperature anomalies (K)
-2
-1.6
-1.2
-0.8
-0.4
0
0.4
0.8
1.2
1.6
2
Annualmeantemperatureanomalies(K)
0.4
0.2
0
-0.2
-0.4
Lat.band1
Lat.band3
Lat.band2
Zonal mean surface wind anomalies
in zonal direction (m/s)
4
-4
-12
-20
Zonal mean precipitation anomalies (%)
Lat. band 1 Lat. band 2 Lat. band 31.2
0.4
Jan Mar May July Sep Nov
0.2
0
-0.2
0.4
0.2
0
Jan Mar May July Sep Nov Jan Mar May July Sep Nov Jan Mar May July Sep Nov Jan Mar May July Sep Nov Jan Mar May July Sep Nov
4
-4
-12
4
0
-4
-8
12
4
-4
Lat. band 1 Lat. band 2 Lat. band 3
Affiliations:
a) MARUM, Bremen, Germany b) Oregon State University, USA c)
Victoria University of Wellington, New Zealand d) GNS Science,
New Zealand e) University of Cologne, German.
Acknowledgments:
This work was supported by a grant from the National
Oceanographic and Atmospheric Administration (award number
NA15OAR4310239) and the BMBF German Climate Modeling
Initiative PalMod.
References:
1) Laepple, T., and P. Huybers (2014), Ocean surface
temperature variability: Large modeldata differences at decadal
and longer periods, PNAS, 111 (47), 16682–16687.
2) Bakker et al. (2017), Centennial-scale Holocene climate
variations amplified by Antarctic Ice Sheet discharge, Nature
541.
3) Golledge et al. (2014), Antarctic contribution to meltwater
pulse 1A from reduced Southern Ocean overturning, Nat.
Comm., 5, 5107.
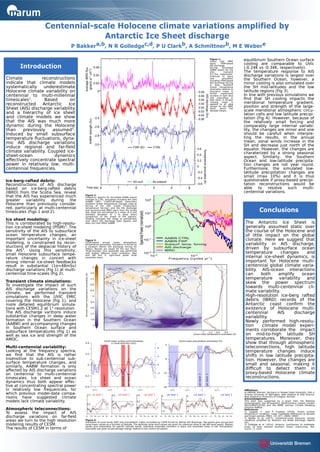
Figure 1:
Scotia Sea IBRD
stack. PISM-based
AIS discharge
forcing. Simulated
AABW export for the
UVic transient
8-2.7ka experiment.
Unforced in black
and simulation
including PISM-based
AIS discharge forcing
in blue. Southern
Ocean temperature
anomalies relative to
long-term mean in
forced experiment
(surface in dark blue
and subsurface in
light blue). A 10-year
running mean is
applied to all data
except for the IBRD
stack, which has
decadal means.
equilibrium Southern Ocean surface
cooling are comparable to UVic
(-0.24K vs -0.34K, respectively).
The temperature response to AIS
discharge variations is largest over
the Southern Ocean, however, a
minor cooling is also simulated over
the SH mid-latitudes and the low
latitude regions (Fig 3).
In line with previous simulations we
find that SH cooling impacts the
meridional temperature gradient,
position and strength of the large-
scale meridional atmospheric circu-
lation cells and low latitude precipi-
tation (Fig 4). However, because of
the relatively small forcing and
comparably large internal variabi-
lity, the changes are minor and one
should be carefull when interpre-
ting the results. In the annual
mean, zonal winds increase in the
SH and decrease just north of the
equator. However, the changes are
charaterized by a strong seasonal
aspect. Similarly, the Southern
Ocean and low-latitude precipita-
tion changes are not year round.
Furthermore, the simulated low-
latitude precipitation changes are
small (max 10%) and it is thus
questionable if proxy-based precipi-
tation reconstructions would be
able to resolve such multi-
centennial variations.
The Antarctic Ice Sheet is
generally assumed static over
the course of the Holocene and
of little impact on the global
climate. Here we suggest that
variability in AIS discharge,
driven by subsurface ocean
temperature changes and
internal ice-sheet dynamics, is
important for Holocene multi-
centennial global climate varia-
bility. AIS-ocean interactions
can both amplify ocean
temperature variability and
skew the power spectrum
towards multi-centennial cli-
mate variability.
High-resolution ice-berg rafted
debris (IBRD) records of the
Antarctic coast confirm the
existence of Holocene multi-
centennial AIS discharge
variability.
Newly performed high-resolu-
tion climate model experi-
ments corroborate the impact
on mid-to-high latitude SH
temperatures. Moreover, they
show that through atmospheric
teleconnections, high latitude
temperature changes induce
shifts in low latitude precipita-
tion. However, the changes are
small and seasonal, making it
difficult to detect them in
proxy-based Holocene climate
reconstructions.
Ice-berg-rafted debris:
Reconstructions of AIS discharge
based on ice-berg-rafted debris
(IBRD) from the Scotia Sea, reveal
that the AIS has experienced much
greater variability during the
Holocene than previously conside-
red, particularly at multi-centennial
timescales (Figs 1 and 2).
Ice sheet modeling:
This is corroborated by high-resolu-
tion ice-sheet modeling (PISM)3
. The
sensitivity of the AIS to subsurface
ocean temperature changes, an
important uncertainty in ice-sheet
modeling, is constrained by recon-
stuctions of the deglacial history of
the AIS3
. Using this sensitivity,
small Holocene subsurface tempe-
rature changes in concert with
strong internal ice-sheet feedbacks
result in substantial (1σ=48mSv)
discharge variations (Fig 1) at multi-
centennial time-scales (Fig 2).
Transient climate simulations:
To investigate the impact of such
AIS discharge variations on the
climate, we performed transient
simulations with the UVIC EMIC
covering the Holocene (Fig 1), and
more detailed equilibrium simula-
tions with CESM1.2 at 1°-resolution.
The AIS discharge varitions induce
substantial changes in deep water
formation in the Southern Ocean
(AABW) and accompanying changes
in Southern Ocean surface and
subsurface temperatures (Fig 1) as
well as sea ice and strength of the
AMOC.
Multi-centennial variability:
Looking at the frequency spectra,
we find that the AIS is rather
insensitive to sub-centennial sub-
surface temperature changes, and
similarly, AABW formation is only
affected by AIS discharge variations
on centennial to multi-centennial
timescales. Ice sheet and ocean
dynamics thus both appear effec-
tive at concentrating spectral power
in relatively low frequencies, for
which previous model-data compa-
risons have suggested climate
models lack climate variability.
Atmospheric teleconnections:
To assess the impact of AIS
discharge variations on far-field
areas we turn to the high resolution
modeling results of CESM.
The results of CESM in terms of
Climate reconstructions
indicate that climate models
systematically underestimate
Holocene climate variability on
centennial to multi-millennial
timescales1
. Based on
reconstructed Antarctic Ice
Sheet (AIS) discharge variability
and a hierarchy of ice sheet
and climate models we show
that the AIS was much more
dynamic during the Holocene
than previously assumed2
.
Induced by small subsurface
temperature fluctuations, dyna-
mic AIS discharge variations
induce regional and far-field
climate variability. Coupled ice-
sheet-ocean dynamics
effectively concentrate spectral
power in relatively low, multi-
centennial frequencies.
Figure 2:
Frequency spectra for simulated AABW export
changes in CTRL, simulation including AIS melt
(AABW FWF), LOVECLIM-based subsurface
Southern Ocean temperature changes used as
forcing of the UVic model (‘Subsurface
temperature forcing’) and the AIS discharge
and reconstructed IBRD stack from the Scotia
Sea. Data are normalized to a mean of 0 and
standard deviation of 1 to allow direct
comparison of the shape of the spectra.
Shading indicates the range of periodicities
over which AIS discharge does (green) and
does not (red) affect AABW.
Figure 3:
CESM-based annual mean atmospheric
temperature anomalies. Simulation is forced by
a constant 48mSv AIS discharge forcing for
200yrs. Results are shown for the last 20yrs.
Three-member mini ensemble was performed
with slightly different initial conditions. Map
and red line in right-hand panel show
ensemble mean.
Lat.band1
Lat.band3
Lat.band2
Figure 4:
Anomalies of zonal winds (left) and precipitation (right) simulated by CESM forced by 48mSv AIS discharge. Top panels give annual and
zonal mean values as a function of latitude. The absolute zonal wind values are given for reference (blue in top left-hand panel). Bottom
panels give seasonality for specific latitude bands. Individual ensemble members in black and ensemble mean in red. Precipitation
anomalies are given as percentage change relative to the control simulation.
8
4
0
-4