2 measure of central tendency
•Als DOCX, PDF herunterladen•
4 gefällt mir•7,572 views

Stats Practice material

Empfohlen
Weitere ähnliche Inhalte
Was ist angesagt?
Was ist angesagt? (20)
Andere mochten auch
Andere mochten auch (18)
Ähnlich wie 2 measure of central tendency
Ähnlich wie 2 measure of central tendency (20)
Mehr von Anas Farooq Maniya AFM
Kürzlich hochgeladen
Kürzlich hochgeladen (20)
2 measure of central tendency
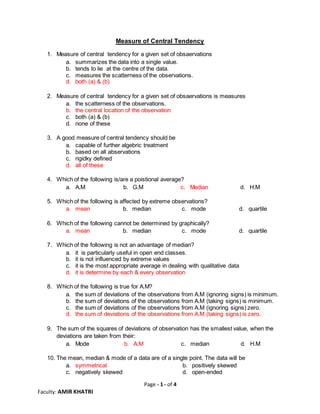
- 1. Page - 1 - of 4 Faculty: AMIR KHATRI Measure of Central Tendency 1. Measure of central tendency for a given set of obsaervations a. summarizes the data into a single value. b. tends to lie at the centre of the data. c. measures the scatterness of the observations. d. both (a) & (b) 2. Measure of central tendency for a given set of obsaervations is measures a. the scatterness of the observations. b. the central location of the observation c. both (a) & (b) d. none of these 3. A good measure of central tendency should be a. capable of further algebric treatment b. based on all abservations c. rigidky defined d. all of these 4. Which of the following is/are a poistional average? a. A.M b. G.M c. Median d. H.M 5. Which of the following is affected by extreme observations? a. mean b. median c. mode d. quartile 6. Which of the following cannot be determined by graphically? a. mean b. median c. mode d. quartile 7. Which of the following is not an advantage of median? a. it is particularly useful in open end classes. b. it is not influenced by extreme values c. it is the most appropriate average in dealing with qualitative data d. it is determine by each & every observation 8. Which of the following is true for A.M? a. the sum of deviations of the observations from A.M (ignoring signs) is minimum. b. the sum of deviations of the observations from A.M (taking signs) is minimum. c. the sum of deviations of the observations from A.M (ignoring signs) zero. d. the sum of deviations of the observations from A.M (taking signs) is zero. 9. The sum of the squares of deviations of observation has the smallest value, when the deviations are taken from their: a. Mode b. A.M c. median d. H.M 10. The mean, median & mode of a data are of a single point. The data will be a. symmetrical b. positively skewed c. negatively skewed d. open-ended
- 2. Page - 2 - of 4 Faculty: AMIR KHATRI 11. Which of the following statement is true? a. the sum of deviations taken from median is zero. b. the sum of squares of deviations taken from median is minimum. c. the sum of absolute deviations taken from median is minimum. d. none of these 12. Which is the most popular & widely used measure of central tendency? a. median b. G.M c. A.M d. mode 13. Which of the following is the empirical relationship among mean, median & mode? a. Mean – Median = 1 3 (Mean –Mode) b. Mode = 3 Median – 2 Mean c. Median = Mode + 2 3 (Mean – Mode) d. all of these 14. If every item in the data set is replaced by its A.M, then the sum of these substituitions will be: a. greater than the sum of the individual observations. b. less than the sum of the individual observations. c. equal to the sum of the individual observations. d. always positive. 15. If each observation of a data set is miltipled by 5, the mean of the new data set: a. is multiplied with 5 b. is multiplied by 1/3 c. remain same d. none of these 16. If the A.M & G.M for two numbers are 6.5 & 6 respectively then the two numbers are a. 6 & 7 b. 9 & 4 c. 10 & 3 d. 8 & 5 17. For a data set G.M is 10 then A.M will be a. 8 b. 9 c. 12 d. 7 18. The best measures of finding average rate of increase or decrease is a. A.M b. median c. mode d. G.M 19. If an organization wants to give more importance to marks obtained in personal interview than the marks obtained in group discussion & written test then the best method is a. simple average b. weighted average c. combined average d. none of these 20. For locating mode graphically we have to use a. Pie diagram b. Ogive curves c. Histogram d. None of these 21. Median can be determined graphically using a. Pie diagram b. Ogive curves c. Histogram d. Frequency polygon
- 3. Page - 3 - of 4 Faculty: AMIR KHATRI 22. 55% of observations are more than a value ‘A’ in a given data set. What is ‘A’? a. P45 b. P55 c. 0.55 d. 0.45 23. What is the lower limit of the central 505 of observations in a data set? a. Q3 b. P25 c. P75 d. Median 24. When a company registers both profit & loss, which of the following measure of central tendency cannot be considered? a. A.M b. median c. G.M d. mode 25. Given that the median sales of shoes was Rs.24000, find the missing frequency Sale (‘000 Rs.) 0 – 10 10 – 20 20 – 30 30 – 40 40 – 50 No. of Shops 5 25 - 18 7 a. 20 b. 24 c. 25 d. 15 26. The median of the observations x – 12, x – 9, x – 7, x – 5, x + 1, x + 3, x + 10, x + 15, x + 20, x + 23 arranged in ascending prder is 22. Find Q1. a. 12.5 b. 20 c. 15 d. data insufficient 27. Mean of 10 observations is 32.2. If by mistake, one observation is taken as 4, in place of – 4. Find the correct mean. a. 34 b. 32.2 c. 31.4 d. none of these 28. Mean of 5 observations is 8. Out of them, three observations are 2, 6, 11. In remaining two observations, one is twice the other. Find the least of the remaining two observations. a. 7 b. 14 c. 6 d. 12 29. If p & q are related variables such that 3p + 4q = 120 & G.M of p is 20 then G.M of q is a. 15 b. 6 c. 20 d. none of these 30. In case of open ended class, which measure is most appropriate? a. A.M b. median c. G.M d. H.M 31. Deciles divides the given data set into _____ equal parts. a. 10 b. 4 c. 100 d. 2 32. Which of the following results hold for a set of distinct positive observations? a. A.M ≥ G.M ≥ H.M b. H.M ≥ G.M ≥ A.M c. G.M > A.M > H.M d. A.M > G.M ≥ H.M
- 4. Page - 4 - of 4 Faculty: AMIR KHATRI 33. The mean of 10 observations is 7.5. if 2.5 is deducted from each observation & then it is multiplied by 2. Mean of new observations is: a. 20 b. 10 c. 15 d. 5 34. If a constant 5 is deducted from each observation of a set having median M, then median of set of new observations will be a. 5 – M b. M c. M – 5 d. M + 5 35. For a data set having 15 observations median is 7 & ∑| 𝑥 − 7|= 12 then ∑| 𝑥 − 𝐴| = ……. where A ≠ 7. a. 10 b. 17 c. 9 d. 0 36. What % of observations lies between P20 & P78 ? a. 20 b. 78 c. 58 d. None of these 37. In a frequency distribution, third quartile is 22 & ∑ 𝑓 = 100, then find the missing frequency for the class 24 – 30. Class 0 – 6 6 – 12 12 – 18 18 – 24 24 – 30 30 – 36 36 – 42 Frequency 12 18 - 30 - 4 2 a. 25 b. 9 c. 29 d. 5 38. The average runs of a cricketer in 4 innings are 32. How many runs he should score in the fifth innings so that his average score becomes 50 runs? a. 132 b. 122 c. 128 d. 126