Lydia Yeshitla, Research Scholar at the Neurobiology Section of UCSD
Final poster (002)
1. Discovery of Small Molecules that Bind to RhoA GTPase
Activator
David Xu,a Khuchtumur Brum-Erdene,a Degang Liu,a Mona Ghozayel,a Ananda Mishra,b and Samy Meroueha
aIndiana University School of Medicine, Department of Biochemistry and Molecular Biology
b Earlham College
ABSTRACT
Rho GTPases serve as molecular switches in cell signaling. They play important
roles in the regulation of various cellular functions comprising several
cytoskeleton-related effects and gene transcription. In all eukaryotes, the Rho
GTPase-activating proteins (RhoGAPs) are important regulators of Rho GTPases
that are essential in cell cytoskeletal regulations, growth, differentiation,
neuronal development and synaptic functions. Recent scientific studies have
linked Rho GTPases as specific negative regulators of Rho protein signaling
pathways. The studies allow understanding reaction progression of RhoGAP-
catalyzed GTPase. Rho family GTPases are turned on and off in response to a
variety of extracellular stimuli. In the GTP-bound active state, Rho protein can
interact with a variety of effectors to transduce signals leading to diverse
biological responses including actin cytoskeletal rearrangements, regulation of
gene transcriptions, cell cycle regulation, control of apoptosis and membrane
trafficking.
INTRODUCTION
Differential scanning fluorimetry (DSF) is a thermal shift assay method that
measures the denaturation of proteins caused due to increasing temperature.
Increased temperature breaks the non-covalent bonds that hold protein folding.
A stable protein denatures at a high temperature, whereas denaturation of an
unstable protein will occur at a lower temperature. DSF assay uses a fluorescent
dye that yields high fluorescence in a nonpolar condition. The fluorescent dye
probes the hydrophobic sites exposed on the unfolded proteins. An increase in
temperature unfolds the protein to expose more hydrophobic residues
progressively, until the protein is fully unfolded, which in turn produces more
fluorescence by the interaction of fluorescent dye and the exposed protein
hydrophobic residues. During the experiment, we used a conventional RT-PCR
instrument and 96 multi-well plates to test ARHGAP11A (Rho GTPase activing
protein 11A) stability and protein-ligand interactions.
MATERIALS AND METHODS
RESULTS
ACKNOWLEDGEMENTS
RESULTS
MECHANISM OF Rh0A ACTIVATION
1. Moon S.Y., Zheng Y. January 2003. Rho GTPase-activating proteins in cell regulation. Trends in Cell Bilogy Volume
13, Issue 1, Pages 13–22
2. Niesen FH, Berglund H, and Vedadi M. 2007. The use of differential scanning fluorimetry to detect ligand
interactions that promote protein stability. Nature Protocols 2:2212-2221.
3. Pantoliano MW, Petrella EC, Kwasnoski JD, Lobanov VS, Myslik J, Graf E, Carver T, Asel E, Springer BA, Lane P, and
Salemme F.R. 2001. High-density miniaturized thermal shift assays as a general strategy for drug discovery. Journal
of Biomolecular Screening 6:429-440.
4. Semisotnov GV, Rodionova NA, Razgulyaev OI, Uversky VN, Gripas AF, and Gilmanshin RI. 1991. Study of the
molten globule intermediate state in protein folding by a hydrophobic fluorescent probe. Biopolymers 31:119-128
5. Niesen, F.H., Berglund, H. & Vedadi, M. The use of differential scanning fluorimetry to detect ligand interactions
that promote protein stability. Nature protocols. doi:10.103 VOL.2 NO.9, 2212-2221 (2007)
6. Vivoli M, Novak HR, Littlechild JA, and Harmer NJ. 2014. Determination of protein-ligand interactions using
differential scanning fluorimetry. Jove-Journal of Visualized Experiments.
The protein of interest was ARHGAP11A. The proteins were purified in the lab
and optimized with suitable buffer (PBS) at suitable pH. Around 65 compounds
were tested with the protein in order to identify the ligand interactions that
promote stability of this protein. The samples were prepared with protein and
compound in it and loaded on RT-PCR. Realplex software was used in order to
analyze the data which is plotted in the figure below.
Figure 1. Flow chart of DSF data analysis and display
Compounds with high magnitude (positive or negative) thermal shift were
further tested with concentration dilution curve to understand the protein
ligand interactions. Compounds that showed stronger binding activity with the
protein in concentration dilution curve were further tested using Microscale
Thermophoresis (MST) technology.
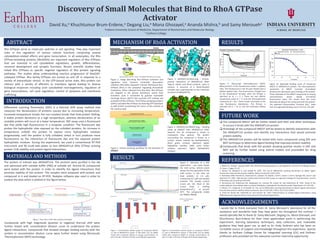
Stephan Huveneers, and Erik H. J. Danen J Cell Sci 2009;122:1059-1069, Journal of Science
Figure 2. Image describing Rho-GTPases activation and
regulation cycle. Guanine nucleotide dissociation
inhibitors (Rho-GDIs) sequester inactive GDP-bound Rho-
GTPases (Rho) in the cytoplasm regulating intracellular
localization. When released from Rho-GDIs, Rho-GTPases
are targeted to the plasma membrane, where their
activation cycle is monitored by guanine nucleotide
exchange factors (GEFs) that promote GTP loading and
activation of Rho-GTPases. The GTPase-activating proteins
(GAPs) inactivate Rho-GTPases by fostering GTP hydrolysis
to GDP further accelerating the return of the proteins to
the inactive state.
Melt Curve
Melt Peak
Figure 6. Overview of a DSF
experiment – top panel shows
the melt curves, bottom panel
shows the first derivative of the
melt curves. In this case, we
have proteins at 2.5 μM,
compounds at 5 μM and sample
controls. The sample control
curves are red. Most of the
curves show a melting
temperature(Tm) at around
45°C. The compounds tested
are ARG01-ARG40.
-1.2
-1
-0.8
-0.6
-0.4
-0.2
0
25 6.25 1.56 0.39 0.098
Tmshift
Concentration (μL)
Tm shift vs Concentration
(ARG16)
First set Duplicate
-1.2
-1
-0.8
-0.6
-0.4
-0.2
0
0.2
50 12.5 3.12 0.8 0.2
Tmshift
Concentration(μL)
Tm Shift vs Concentration
(ARG 37)
1st 2nd 3rd
Figure 7. Concentration dilution graph of compound ARG16.
2.5 μM of ARHGAP11A protein in PBS buffer and 1% DMSO
mixed with compound ARG16 at varying concentrations 25
μM, 6.25 μM, 1.56 μM, 0.39 μM, and 0.098 μM respectively.
Figure 8. Concentration dilution graph of compound ARG37.
2.5 μM of ARHGAP11A protein in PBS buffer and 1% DMSO
mixed with compound ARG37 at varying concentrations 50
μM, 12.5 μM, 3.125 μM, 0.78 μM, and 0.20 μM respectively.
Figure 9. Microscale thermophoresis (MST).
Measurement of the fluorescence inside a capillary
tube. The fluorescence in the IR-Laser heated spot is
plotted against time. The fluorescence changes due
to the temperature increase when the IR-laser is
switched on at t = 5 s. There are two effects:
temperature jump at ≈ 3 s and the thermophoretic
movement at ≈ 30 s. These results contribute to the
new fluorescence distribution. The IR-laser is
switched off (t = 35 s), and the molecules diffuse
back.
Figure 10. Sigmoidal binding curve of compound
ARG37 in ARHGAP11A protein. The thermophoretic
movement of ARG37 increases (normalized
fluorescence decreases) upon binding of the protein.
Three replicates of the ARG37 compounds at varying
concentrations shows steady normalized
fluorescence value. The results form the curve
illustrates binding of the compound with the protein.
The obtained Disassociation Constant (KD) value
from the sigmoidal binding curve is 45.5+/-3.91 μM.
I would like to thank everyone from Dr. Samy Meroueh’s laboratory for all the
assistance and wonderful help they have given me throughout the summer. I
would specially like to thank Dr. Samy Meroueh, Degang Liu, Mona Ghozayel, and
Khuchtumur Bum-Erdene for their most appreciated assist in performing the
experiment, learning laboratory techniques, data collection, and invaluable
guidance they have given me, as well as Dr. Andy Hudmon who has been an
incredible source of support and knowledge throughout this experience. Special
thanks to Earlham College Center for Integrated Learning (CIL) and Earlham
professors who provided me this awesome summer internship opportunity.
FUTURE WORK
REFERENCES
The compound ARG37 will be further tested with MST and other techniques
to ensure it binds with the ARHGAP11A protein
Homologs of the compound ARG37 will be tested to identify interactions with
the ARHGAP11A protein and identify any interactions that would promote
protein stability
The ARHGAP11A protein will be tested with more compounds using DSF and
MST technique to determine ligand binding that improves protein stability
Compounds that binds with the protein showing positive results in DSF and
MST will be further tested using animal models and proceeded for drug
screening
Figure 3. ARHGAP11A-RhoA.png – Protein-
protein interaction of ARHGAP11A (PDB:
3eap.A, white) and RhoA (1ow3.A, cyan) in
cartoon. A structure of a RhoA-RhoGAP
complex was superimposed on the monomer
structure of ARHGAP11A.
Virtual Screening – AutoDock Vina
~5.9 Million Compounds (PAINS/REOS filtered) to ARHGAP11A-RhoA interface
Rescoring of Docked Poses – SVMGEN
Collect Top 10000 from ~5.9 Million Compounds
Rescore of Top Compounds – GlideSP
Collect Top 1000 from Top 10000
Clustering of Top Hits
Top 1000 to 50 Compounds
Experimental Validation
11 Compounds
Figure 5. Virtual screening workflow for the discovery of
ARG037.
Figure 4. ARHGAP11A-ARG037.png – Binding
mode of ARG037 with ARHGAP11A (PDB:
3eap.A). The hit compound is shown in
transparent blue spheres. The protein
surrounding the compound is shown as a
surface render colored by hydrophobicity.
More green surfaces represent higher
hydrophilic residues while more brown
surfaces represent higher hydrophobic
residues.