

Empfohlen
Weitere ähnliche Inhalte
Ähnlich wie geography_tools_unit
Ähnlich wie geography_tools_unit (20)
Mehr von Ana Arias Castro
Mehr von Ana Arias Castro (20)
Kürzlich hochgeladen
Kürzlich hochgeladen (20)
geography_tools_unit
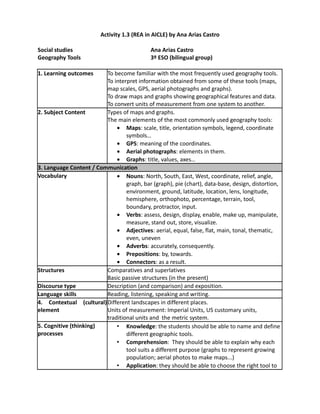
- 1. Activity 1.3 (REA in AICLE) by Ana Arias Castro Social studies Geography Tools 1. Learning outcomes Ana Arias Castro 3º ESO (bilingual group) To become familiar with the most frequently used geography tools. To interpret information obtained from some of these tools (maps, map scales, GPS, aerial photographs and graphs). To draw maps and graphs showing geographical features and data. To convert units of measurement from one system to another. 2. Subject Content Types of maps and graphs. The main elements of the most commonly used geography tools: • Maps: scale, title, orientation symbols, legend, coordinate symbols… • GPS: meaning of the coordinates. • Aerial photographs: elements in them. • Graphs: title, values, axes… 3. Language Content / Communication Vocabulary • Nouns: North, South, East, West, coordinate, relief, angle, graph, bar (graph), pie (chart), data-base, design, distortion, environment, ground, latitude, location, lens, longitude, hemisphere, orthophoto, percentage, terrain, tool, boundary, protractor, input. • Verbs: assess, design, display, enable, make up, manipulate, measure, stand out, store, visualize. • Adjectives: aerial, equal, false, flat, main, tonal, thematic, even, uneven • Adverbs: accurately, consequently. • Prepositions: by, towards. • Connectors: as a result. Structures Comparatives and superlatives Basic passive structures (in the present) Discourse type Description (and comparison) and exposition. Language skills Reading, listening, speaking and writing. 4. Contextual (cultural) Different landscapes in different places. element Units of measurement: Imperial Units, US customary units, traditional units and the metric system. 5. Cognitive (thinking) • Knowledge: the students should be able to name and define processes different geographic tools. • Comprehension: They should be able to explain why each tool suits a different purpose (graphs to represent growing population; aerial photos to make maps...) • Application: they should be able to choose the right tool to
- 2. 6. (a) Task(s) 6. (b) Activities depict data and help understand it. They should be able to make charts, basic maps, etc. • Analysis: students should be able to illustrate written information with the best graphs. • Evaluation: they should be able to conduct a debate about the advantages and disadvantages of using the metric system. 1. Brainstorming for geography tools already known. 2. Understand maps: which types suit different purposes. 3. Make one's own maps to represent geography. 4. Understand the advantages of using maps. 5. Make one's own maps to represent geographic features and information related to them. 6. Comprehension of the most frequently used units of measurement in the metric system, imperial units and US customary units. 7. Basic conversion from / to the metric system. 8. Comprehension of the different types of charts studied and their specific use. 9. Illustration of information with the most suitable graphs. 10. Debate on the advantages and disadvantages of the metric system. 1 Brainstorming for geography tools already known. 1.1 The names of tools already known are written on the blackboard or digital board in a word map. 1.2 These names are defined and explained if necessary. The teacher will try to elicit more types of tools showing examples of each of them (on the screen) 2 Understand maps: which types suit different purposes. 2.1 Different types of maps are displayed and matched with the different purposes they may have (real maps and other shown on the screen are analysed) 2.2 Information about each type of tool and map is read and attention is drawn to the elements in each of them. 2.3 Students have to choose what type of map best represents information. 3 Make one's own maps to represent geography. 3.1 The group of students have to draw their own maps to represent given information. Blank templates are provided for this purpose. 3.2 Students are reminded to include the elements a map should have. 4 Understand the advantages of using maps. 4.1 Comparing maps of the same place at different times
- 3. (historical maps), comparing the features of different places (topographic maps), human activity, economy, etc. 5 Make one's own maps to represent geographic features and information related to them. 5.1 In pairs, draw a map to represent different types of information. 5.2 Maps are displayed on the class board or wall. Even a GPS could be shown. 6 Comprehension of the most frequently used units of measurement in the metric system, imperial units and US customary units. 6.1 Charts with the equivalence of various units of measurement in the three systems are displayed. 6.2 The students are encouraged to talk about traditional units of measurement still used in the area. 7 Basic conversion from / to the metric system. 7.1 Using an online converter, students are encouraged to express different units using the various systems. 8 Comprehension of the different types of charts studied and their specific use. 8.1 Different types of charts are shown on the screen or blackboard together with their main uses and advantages. 8.2 The teacher draws attention to the elements that help understand the information given. 9 Illustration of information with the most suitable graphs. 9.1 The students are encouraged to choose the most suitable maps for each purpose. 9.2 Using computers, each student should create different types of graphs to represent the information and data given. 9.3 These graphs are sent to the teacher. 10 Debate on the advantages and disadvantages of the metric system. 10.1 Finally, a debate about the advantages and disadvantages of the metric system is held and the main conclusions are shown in the class blog (whole class) 7. Methodology Organization and class 5 50-minute sessions: distribution / timing • session 1: tasks 1 and 2 • session 2: tasks 3 and 4 • session 3: task 5 • session 4: task 6, 7 and 8 • session 5: tasks 9 and 10
- 4. class distribution has been mentioned in the activities section. Resources / Materials • Presentation with all the information made by the teacher: the contents and examples. • Digital interactive screen • Computers for the students (only for certain activities) • Software: presentation and word processor. • Internet • New and old maps on paper. • A GPS to show how information can be shown and used. Key Competences Communication in the L2. Mathematical competence and basic competence in technology. Digital competence. Learning to learn. Interpersonal, intercultural and social competences and civic competence. 8. Evaluation (criteria and Evaluation criteria: instruments) • Creative, active participation in all the activities. • Adequate choice and elaboration of maps and graphs. • Positive, reflexive criticism of maps, charts and systems of units of measurement. Evaluation instruments: rubric together with the materials produced along the unit. Template for this activity by Isabel Pérez Torres.