Real-time pasture biomass estimation by Karl Andersson
•
1 gefällt mir•575 views

Real-time pasture biomass estimation by Karl Andersson, SPAA Symposium Aug 2016.

Empfohlen
Weitere ähnliche Inhalte
Andere mochten auch
Ähnlich wie Real-time pasture biomass estimation by Karl Andersson
Ähnlich wie Real-time pasture biomass estimation by Karl Andersson (16)
Mehr von Amanda Woods
Mehr von Amanda Woods (20)
Kürzlich hochgeladen
Kürzlich hochgeladen (20)
Real-time pasture biomass estimation by Karl Andersson
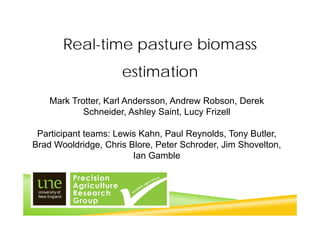
- 1. Real-time pasture biomass estimation Mark Trotter, Karl Andersson, Andrew Robson, Derek Schneider, Ashley Saint, Lucy Frizell Participant teams: Lewis Kahn, Paul Reynolds, Tony Butler, Brad Wooldridge, Chris Blore, Peter Schroder, Jim Shovelton, Ian Gamble
- 2. B.GSM.0010, P4.18 Real Time Pasture Biomass Estimation
- 4. Aims and why What we’re doing Some results Mobile app Future directions
- 5. Aims 1. Evaluate the potential for Active Optical Sensors (AOS) 2. Develop a series calibrations for use by producers 3. Develop a Mobile Device Application (MDA) to support AOS
- 6. Aims: Current biomass Growth rate Paddock 963 23 Black leg 750 21 Plumb tree 894 25 Parkers 675 11 Parkers west 762 18 Gumtree 1 1256 31 Gumtree 2 1766 34 500 1000 1500 Export data
- 7. Why? Pasture utilisation Estimate biomass compared to benchmarks Help make objective decisions on stocking rates Calibrate other methods (e.g. pastures from space)
- 8. Why? Pasture utilisation Help make objective decisions on stocking rates Estimate biomass compared to benchmarks Calibrate other methods (e.g. pastures from space)
- 9. Why? Pasture utilisation Help make objective decisions on stocking rates Estimate biomass compared to benchmarks Calibrate other methods (e.g. pastures from space)
- 10. Why? Pasture utilisation Help make objective decisions on stocking rates Estimate biomass compared to benchmarks Calibrate other methods
- 11. Correlating sensors to GDM… >200 samples taken from across Australia Each sample consists of 8-12 individual cuts Each site is scanned with a Greenseeker Handheld Height measured by plate meter Digital image (before and after cut) Quadrat is harvested using clippers or knives – cut to ground
- 12. Preliminary results… • The ok, more common • Tablelands Fescue • The good, • Tasmanian Ryegrass
- 13. Preliminary results… • The problems… • Poor calibrations • NDVI Saturation
- 15. Effect of plant mix
- 16. Season State Species Input variable Model type Model R2 1 Winter NSW Fescue NDVI*Height LM -204 + 368.8 x 0.95 2 Winter Vic Ryegrass NDVI*Height GLM exp^(6.1 + 0.21 x) 0.79 3 Winter Vic Phalaris_Ryegrass NDVI*Height LM -189 + 244.7 x 0.68 4 Winter Vic Phalaris NDVIxLHt LM -62 + 862.3 x 0.67 5 Winter Vic Mixed LNDVI LM -22 -811.5 x 0.33 6 Winter NSW Fescue NDVI GLM exp^(4.2 + 5.75 x) 0.91 7 Winter NSW Lucerne NDVI LM -571 + 2464.7 x 0.92 8 Winter Vic Mixed NDVI LM -75157 + 104337.6 x 0.6 9 Winter Vic Phalaris_Clover NDVIxLHt LM -167 + 945.8 x 0.93 10 Winter Vic Phalaris LHt LM -1378 + 1731.9 x 0.75 11 Winter Vic Phalaris_Ryegrass_Clove r LHt LM -835 + 1509.6 x 0.53 12 Winter Vic Phalaris_Clover NDVIxLHt GLM exp^(4.9 + 1.35 x) 0.86 14 Winter NSW Fescue LNDVI GLM exp^(9.2 + 2.61 x) 0.95 15 Winter Vic Phalaris_Clover NDVIxLHt QLM -30 + 456.1 x + 178.8 x^2 0.92 16 Winter Vic Phalaris LNDVI GLM exp^(9.1 + 10.2 x) 0.73 17 Winter Vic Ryegrass NDVI*Height GLM exp^(4.4 + 0.41 x) 0.71 18 Winter Vic Phalaris_Clover NDVIxLHt LM -347 + 1613.8 x 0.81 19 Winter Vic Phalaris_Ryegrass_Clove r Height GLM exp^(6.7 + 0.15 x) 0.84 20 Spring Vic Ryegrass NDVI*Height LM 925 + 256.1 x 0.87 23 Spring Vic Phalaris_Clover NDVI*Height GLM exp^(8.1 + 0.14 x) 0.47 24 Spring NSW Fescue NDVIxLHt LM -592 + 2141.8 x 0.87 25 Spring NSW Lucerne NDVI GLM exp^(2.2 + 6.79 x) 0.76 26 Spring NSW Phalaris LHt LM -93 + 1113.7 x 0.96 27 Spring Vic Mixed LHt GLM exp^(3.3 + 1.72 x) 0.72 28 Spring Vic Mixed NDVI*Height LM 1333 + 443.3 x 0.51 29 Spring Vic Ryegrass NDVI GLM exp^(-5.9 + 16.2 x) 0.68 30 Spring Vic Phalaris NDVIxLHt GLM exp^(4.6 + 1.64 x) 0.89 31 Spring Vic Phalaris_Clover Height LM 242 + 191.2 x 0.92 32 Spring NSW Cocksfoot_Fescue NDVIxLHt LM -348 + 2069.1 x 0.7 33 Spring NSW Cocksfoot_Fescue_Clove r LNDVI GLM exp^(8.4 + 1.88 x) 0.71 34 Spring Vic Ryegrass_Clover NDVI*Height GLM exp^(6.5 + 0.12 x) 0.86 35 Spring Vic Phalaris_Clover NDVIxLHt LM -75 + 1418.4 x 0.91 36 Spring NSW Fescue_Clover NDVIxLHt LM -60 + 1145.7 x 0.65 37 Spring NSW Ryegrass NDVI LM -578 + 5083.8 x 0.63 38 Spring NSW Fescue NDVIxLHt LM 174 + 1641.4 x 0.74 39 Spring NSW Mixed NDVIxLHt LM -633 + 2381.6 x 0.9 40 Spring Vic Mixed LNDVI LM 8218 + 7283.1 x 0.82 41 Spring Vic Ryegrass NDVIxLHt LM -1112 + 2783.3 x 0.9 42 Spring Vic Phalaris_Ryegrass_Clove r LNDVI LM 3410 + 2241.5 x 0.83 43 Spring Vic Phalaris Clover NDVIxLHt LM 91 + 2256 8 x 0 95
- 18. Solutions? We examined other reflectance bands Excellent correlation but not consistent The best co- variate turns out to be plate height. Question % of possible sites Proportion of sites where ACS470 bands are better than GS NDVI? 97% Proportion of these sites where there is a substantive improvement (increase of more than r2 0.10)? 71% Proportion of sites where ACS470 bands are better than GS NDVI, Height or a combination? 78% Proportion of these sites where there is a substantive improvement (increase of more than r2 0.10)? 29% Date State Locatio n Species/past ure type Best 2 band sensor model r2 Best 3 band sensor model r2 4/06/2014 NSW UNE Fescue Fescue Ln GDM = Ln NDVI ((760‐ 700)/760+700) 0.83 Ln GDM = Band 590, Ln Band 730 0.86 23/06/2014 NSW Sundow n Lucerne GDM = Ln SR (590/730) 0.91 GDM = SR (590/730), SR (730/760) 0.95 23/06/2014 NSW Sundow n Fescue GDM = SR (590/670) 0.93 GDM = SR(730/670), SR(760/590) 0.95 25/07/2014 NSW Sundow n Fescue Ln GDM = SR(530/760) 0.96 Ln GDM = Band 730, Ln NDVI ((760‐ 530)/760+530)) 0.98 18/09/2015 NSW Sundow n Lucerne GDM = Ln((760‐ 530)/760+530)) 0.93 Ln GDM = SR(760/730), Ln Band 700 0.98 18/09/2014 NSW Sundow n Fescue Ln GDM = Band 530 0.85 Ln GDM = Ln Band 760, NDVI ((760‐ 530)/760+530)) 0.90 23/09/2014 NSW Kirby Phalaris GDM = NDVI ((760‐ 730)/(760+730)) 0.88 GDM = Ln SR(670/760), Ln SR(700/730) 0.98
- 19. a) b) c)
- 20. Region Combined Winter+Spring All cuts Northern Tablelands r2 0.70 0.45 n 289 545 Mean 2191 2616 RMSE 982 1312 Central Victoria r2 0.77 n 66 Mean 1373 RMSE 541 Southern Victoria r2 0.62 n 82 Mean 1743 RMSE 375 Western Victoria r2 0.77 n 326 Mean 1206 RMSE 469 Tasmania r2 0.66 0.68 n 82 153 Mean 1189 1120 RMSE 403 380
- 21. WA and SA pastures
- 22. 0 units 21 units 42 units 63 units 0.51 0.55 0.65 0.78
- 26. DIY calibration
- 27. Where to from here? Integrate with weather and satellite data Integrate with LiDAR Integration with feed budgeting/stocking rate software Quality and pasture growth rates
- 29. Dealing with calibration shifts… NDVI profiling
- 30. Soil moisture
- 32. Take home messages NDVI from affordable AOS have the potential to provide pastures biomass estimates In many pastures, the inclusion of height measures improved the correlation with GDM, and was a better universal covariate than other AOS bands Work is still to be done to validate estimates, and provide seasonal, regional, species and calibrations LiDAR may provide convenient height measures, though further development is required