1. How old are the overseas born?
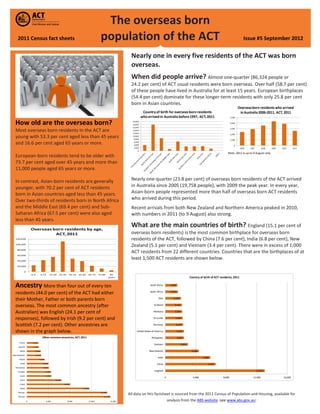
Most overseas born residents in the ACT are
young with 53.3 per cent aged less than 45 years
and 16.6 per cent aged 65 years or more.
European-born residents tend to be older with
73.7 per cent aged over 45 years and more than
11,000 people aged 65 years or more.
In contrast, Asian-born residents are generally
younger, with 70.2 per cent of ACT residents
born in Asian countries aged less than 45 years.
Over two-thirds of residents born in North Africa
and the Middle East (69.4 per cent) and Sub-
Saharan Africa (67.5 per cent) were also aged
less than 45 years.
The overseas born
population of the ACT2011 Census fact sheets Issue #5 September 2012
Nearly one in every five residents of the ACT was born
overseas.
When did people arrive? Almost one-quarter (86,324 people or
24.2 per cent) of ACT usual residents were born overseas. Over half (58.7 per cent)
of these people have lived in Australia for at least 15 years. European birthplaces
(54.4 per cent) dominate for these longer-term residents with only 25.8 per cent
born in Asian countries.
Nearly one-quarter (23.8 per cent) of overseas born residents of the ACT arrived
in Australia since 2005 (19,758 people), with 2009 the peak year. In every year,
Asian-born people represented more than half of overseas born ACT residents
who arrived during this period.
Recent arrivals from both New Zealand and Northern America peaked in 2010,
with numbers in 2011 (to 9 August) also strong.
What are the main countries of birth? England (15.1 per cent of
overseas born residents) is the most common birthplace for overseas born
residents of the ACT, followed by China (7.6 per cent), India (6.8 per cent), New
Zealand (5.1 per cent) and Vietnam (3.4 per cent). There were in excess of 1,000
ACT residents from 22 different countries. Countries that are the birthplaces of at
least 1,500 ACT residents are shown below.
All data on this factsheet is sourced from the 2011 Census of Population and Housing, available for
analysis from the ABS website (see www.abs.gov.au)
0
20,000
40,000
60,000
80,000
100,000
120,000
0-4 5-14 15-24 25-44 45-54 55-64 65-74 75-84 85
years
Overseas born residents by age,
ACT, 2011
Ancestry More than four out of every ten
residents (44.0 per cent) of the ACT had either
their Mother, Father or both parents born
overseas. The most common ancestry (after
Australian) was English (24.1 per cent of
responses), followed by Irish (9.2 per cent) and
Scottish (7.2 per cent). Other ancestries are
shown in the graph below.
13,051
6,591
5,886
4,389
2,954
2,424
2,413
2,332
2,265
2,206
2,167
2,034
1,631
1,560
0 4,000 8,000 12,000 16,000
England
China
India
New Zealand
Vietnam
Philippines
United States of America
Germany
Sri Lanka
Malaysia
Scotland
Italy
South Africa
South Korea
Country of birth of ACT residents, 2011
0
2,000
4,000
6,000
8,000
10,000
12,000
14,000
16,000
18,000
20,000
Countryof birth for overseas born residents
who arrived in Australia before1997, ACT, 2011
Note: 2011 is up to 9 August only
0
1,000
2,000
3,000
4,000
5,000
2006 2007 2008 2009 2010 2011
Overseasborn residents who arrived
in Australia 2006-2011, ACT, 2011
15,533
14,943
11,634
8,059
6,420
4,558
4,509
4,090
4,034
3,320
2,671
2,594
2,243
2,141
0 4,000 8,000 12,000 16,000
German
Chinese
Italian
Indian
Dutch
Greek
Croatian
Vietnamese
Polish
Filipino
New Zealander
Welsh
Spanish
French
Other common ancestries, ACT, 2011