The study analyzed gene expression profiles of MPN leukemia stem cells (LSCs) compared to normal hematopoietic stem cells (HSCs) to identify genes and pathways involved in MPN development. When comparing MPN LSCs to HSCs, differentially expressed genes were identified, including MAMDC2, ABCA13, IFIT2, and IL1RAP, which are involved in interferon response and cytokine signaling pathways. Analysis indicated that cytokine signaling and immune response pathways may be dysregulated in MPN LSCs. This suggests that anti-inflammatory or immunomodulatory drugs could be effective MPN treatments.
SCIENCE TRANS MED Therapeutic targeting of the MYC signal by inhibition of hi...
Poster_Template_Horizontal_Red
1. Dysregulated Gene Expression Profiles in Myeloproliferative
Neoplasm Leukemia Stem Cells
Alexander R. Seutin, Wan-Jen Hong, Ravi Majeti
Department of Medicine, Stanford University School of Medicine, Stanford, CA
Abstract Introduction Results Conclusions
In 1951, William Dameshek was the first to recognize the
unregulated myeloproliferation of CML, PV, ET, and PMF, grouping
together what would later be known as MPNs. MPNs are chronic
myeloid malignancies which originate from normal HSCs, and result
in the proliferation of differentiated myeloid cells: PMF is caused by
atypical megakaryocytic hyperplasia which leads to fibrosis of the
bone marrow, PV results in an increased number of red cells, and
CML causes an overproliferation of all of the myeloid cells inside the
bone marrow. All MPNs can transform into acute myeloid leukemia
(AML) which is a disease that is
difficult to treat. Currently, it is
estimated that approximately
200,000 Americans are living
with a MPN. While certain
mutations are known to be
involved in the development of
MPNs, the role of these
mutations in the pathogenesis of
MPNs is unknown. Similarly, prognostic utility of these mutations is
limited. For PV and ET, the life expectancy remains near normal as
most disease complications are safely and effectively managed
through treatment, however, the long term effects of these treatments
remains unknown. In PMF, the effectiveness of therapies is limited.
Treatment for PMF includes Jak2 inhibitors which have significant
improvement in splenomegaly and fatigue, but does not alter the
course of the disease.
In recent years, gene expression microarrays have been widely
used to measure the expression of thousands of genes at a time.
Microarrays provide an enormous amount of data but analysis of the
data has been challenging. For this reason, several bioinformatic tools
have been developed, allowing us to interpret and understand the
tremendous amount of data derived from microarrays.
Myeloproliferative neoplasms (MPNs) are
clonal disorders arising from normal
hematopoietic stem cells (HSCs) and can lead to
the development of acute myeloid leukemia
(AML). Classical MPNs are characterized by the
proliferation of one or more of the myeloid
lineages and include chronic myeloid leukemia
(CML), primary myelofibrosis (PMF), essential
thrombocythemia (ET) and polycythemia vera
(PV). CML is categorized by a reciprocal
translocation between chromosomes 9 and 22,
resulting in the constitutively active tyrosine
kinase, BCR/ABL. Other BCR/ABL-negative
MPNs, such as PMF and PV, are characterized
by a JAK2 V617F mutation in approximately
50% and 95% of patients respectively. Currently,
the pathogenesis of these diseases is not fully
understood.
In order to identify genes and pathways
involved in the development of MPNs, we
analyzed global gene expression data of
populations enriched for MPN leukemia stem
cells (LSCs). Using microarray data, we
compared gene expression profiles of MPN LSCs
to normal HSCs alongside other cell populations
found through public datasets in order to identify
differentially expressed genes. We then used
other bioinformatics tools, such as Gene
Expression Commons and Gene Set Enrichment
Analysis (GSEA) to validate our previous
findings and to identify pathways involved in the
proliferation of MPNs.
We identified several candidate genes that
were differentially expressed between MPN LSC
and normal HSC. We also showed that the
cytokine mediated signaling pathway and
immune response may be deregulated in MPN
LSCs.
1: LSCs and HSCs were isolated using
fluorescence activated cell sorting (FACS)
from 17 MPN patients and 5 normal bone
marrow samples. Total RNA was extracted
using RNeasy Micro Plus Kit from Qiagen.
Amplification and hybridization to
Affymetrix U133 Plus 2.0 gene expression
microarrays was performed according to
manufacturer’s protocol.
2: Gene expression values were normalized
using the Robust Multi-Array Average
(RMA) algorithm and differentially
expressed genes were identified using
GenePattern (2). Comparative marker
selection was used to create a surpervised
list of genes. Hierarchical clustering was
then performed on this list.
3 & 4: GSEA (3) and Gene Expression
Commons (4) were also used to analyze
microarray data.
• 1- World Health Organization (WHO). (2013). The 2008 WHO
classification system for myeloid neoplasms.
• 2- Reich M, Liefeld T, Gould J, Lerner J, Tamayo P, Mesirov JP (2006)
GenePattern 2.0 Nature Genetics 38 no. 5 (2006):pp500-501 doi:
10.1038/ng0506-500.
• 3- Subramanian, Tamayo, et al. (2005, PNAS 102, 15545-15550)
• 3- Mootha, Lindgren, et al. (2003, Nat Genet 34, 267-273).
• 4- Jun Seita, Debashis Sahoo, Derrick J. Rossi, Deepta Bhattacharya,
Thomas Serwold, Matthew A. Inlay, Lauren I. R. Ehrlich, John W.
Fathman, David L. Dill, Irving L. Weissman. (2012) Gene Expression
Commons: an open platform for absolute gene expression profiling.
PLoS ONE 7(7):e40321.
• 5- Huang DW, Sherman BT, Lempicki RA. Systematic and integrative
analysis of large gene lists using DAVID Bioinformatics Resources.
Nature Protoc. 2009;4(1):44-57.
• 5- Huang DW, Sherman BT, Lempicki RA. Bioinformatics enrichment
tools: paths toward the comprehensive functional analysis of large
gene lists. Nucleic Acids Res. 2009;37(1):1-13.
- 0 +
1 2
3
4
NES: 1.89
P-value: 0.0
FDR: 0.52
NES: 1.82
P-value: 0.0
FDR: 0.42
NES: 1.80
P-value: 0.0
FDR: 0.30
NES: 1.77
P-value: 0.0
FDR: 0.34
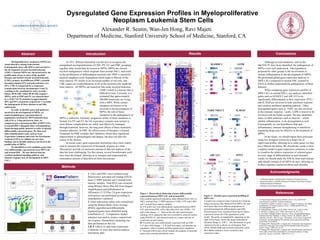
Figure 1: Hierarchical clustering of genes differentially
expressed between MPN LSC and normal HSC.
Each column represents microarray data obtained from LSCs or
HSCs isolated from 17 MPN patients (5 CML, 6 PV and 6 MF)
and 5 normal bone marrow samples.
A: 874 probe sets were differentially expressed between MPN
LSC and normal HSC with a false discovery rate (FDR) < 0.2
and a fold change > 2 . Bars on the left side represent gene
ontology (GO) categories that were enriched in selected clusters
using DAVID (5) and selected based on p values and rate of
occurrence in each cluster.
B: 93 probe sets were differentially expressed with an FDR <
0.15 and a fold change > 4. In both heat maps, red indicates up
regulation, white is neutral and blue signals down regulation.
C: Selected GSEA plots which indicate the quantity of enriched
genes and a running enrichment score.
Although several mutations, such as the
Jak2V617F, have been identified, the pathogenesis of
MPNs is not well understood. One hypothesis
proposed by other groups is the involvement of
chronic inflammation in the development of MPNs.
We performed global gene expression analysis of
MPN LSCs compared to normal HSC isolated by
FACS to further understand the pathogenesis of these
diseases.
When comparing gene expression profiles of
MPN LSCs to normal HSCs, our analyses identified
genes such as MAMDC2 and ABCA13 to be
significantly differentiated in their expression. IFIT2
and IL1RAP are involved in both interferon response
and cytokine mediated signaling pathway. Other
dysregulated genes such as TARP, are also involved
in the immune response,. Lastly, LEPR is known to be
involved with the leptin receptor. We also identified
many of other pathways such as annexin – which
inhibits inflammation- to be dysregulated as well.
Consequently we can hypothesize that anti-
inflammatory, immune strengthening or interferon
regulating drugs may be effective in the treatment of
MPNs.
In the future, we should repeat these processes
using less stringent criteria for a larger list of
supervised probes, allowing us to study genes we may
have filtered out before. We should also create a more
complete model in gene expression commons in order
to visualize the relative expression of selected genes
in every stage of differentiation in each disorder.
Lastly, we should study the GSEAs from each disease
individually instead of all MPNs at once, allowing us
to draw separate conclusion about each disorder.
• California Institute of Regenerative Medicine (Funding Source)
• Stanford Institutes of Medical Research Summer Internship Program
• Stanford School of Medicine
• Members of the Majeti Laboratory
LEPR
IL1R1
HCK
HLA-DRA
IL1RAP
CISH
HLA-DQB1
CCRL2 STAT4
HLA-DQB1
LOC100133583
IFITM1
PTPRC
DPP4
GLI2
IL2RA
APC
CASP3
ICOS
MPZL2
PF4
LEPR
IFIT2
CAV1
IFIT1
HLA-DQA1
AXL
IFIT3
TNFAIP3
PRDM16
FLT3
CCR7
SOD2
PTGER4
BLNK
TNFAIP3
TNFSF8
ITPKB
IL8
GPR183
IRAK3
Cytokinemediated
signalingpathway
Immunesystem
development
Tcellactivation///
Cytokinemediatedsignalingpathway
CMLLSC
CMLLSC
CMLLSC
CMLLSC
CMLLSC
PVLSC
MFLSC
MFLSC
MFLSC
MFLSC
MFLSC
MFLSC
PVLSC
PVLSC
PVLSC
PVLSC
PVLSC
NBMHSC
NBMHSC
NBMHSC
NBMHSC
NBMHSC
Figure 2: Absolute gene expression profiling of
MPN LSC.
A model was created in Gene Expression Commons
using microarray data obtained from MPN LSC and
microarray data from different populations of
normal hematopoietic differentiation and AML.
Selected genes were visualized showing its relative
expression across all of the populations in the
model. The probe set metaprofile, appearing on the
right of the model, shows the range (indicated by
Dynamic Range or “DR”) . The distribution of gene
expression levels is shown as a histogram. Red
colors indicate high and recurrent expression while
blue shades indicate a lower recurrence and
expression value.
AREGB
NR4A2
SLC2A3
AREG
SIK1
PALLD
KIAA1462
PDE4B
ANK3
ABCA13
PPP1R16B
LOC100302650
NR4A2
NR4A2
ST6GAL2
PCDH17
---
PCSK5
WIF1
SPON1
---
---
DNTT
DNTT
---
---
CXCL11
CXCL11
LOC144481
CLEC7A
CACNA1D
GAS2
SGMS2
TUBB6
SOCS2
MRC1
MRC1L1
FAM38B
GLI2
FAM38B
DPP4
RASA1
CISH
MARCKS
MARCKS
MARCKS
LEPR
LEPR
LEPR
LEPR
KCNK5
MEIS3P1
TUBAL3
VWF
CAV1
CD36
CNRIP1
MYCN
DPP10
S100A10
CRIP1
ANXA2
ANXA2
ANXA2
---
WDR49
DPYSL3
TSPAN2
TSPAN2
TSPAN2
CD9
PTPN14
HRASLS
REN
MAL
TM4SF1
TM4SF1
TARP
TARP
TARP
FAM83A
RXFP1
RXFP1
RXFP1
C1orf226
SYBU
C3orf59
NRXN3
ID1
---
MAF
MAF
MAMDC2
FLJ39632
CMLLSC
MFLSC
PVLSC
CMLLSC
CMLLSC
CMLLSC
CMLLSC
PVLSC
MFLSC
MFLSC
MFLSC
MFLSC
PVLSC
MFLSC
PVLSC
PVLSC
PVLSC
NBMHSC
NBMHSC
NBMHSC
NBMHSC
NBMHSC
Acknowledgments
References
Methods
GRANDVAUX IRF3 TARGETS UP DER IFN GAMMA RESPONSE UP
DER IFN ALPHA RESPONSE UP RAGHAVACHARI PLATELET SPECIFIC GENES
LEPR
DR: 8.54
CB
BM
CML
MF
PV
AML
IL1RAP
DR: 6.28
CB
BM
CML
MF
PV
AML
DR: 8.78
TARP, TRGC2
CB
BM
CML
MF
PV
AML
MAMDC2
DR: 7.31
CB
BM
CML
MF
PV
AML
ABCA13
DR: 7.48
CB
BM
CML
MF
PV
AML
IFIT2
DR: 8.47
CB
BM
CML
MF
PV
AML
(1)