SlideShare ist ein Scribd-Unternehmen logo
1 von 7
Topic Three: Menu Engineering & Analysis
MENU ENGINEERING
The menu analysis technique described in the following pages was developed by Michael L. Kasavana
and Donald I. Smith and was described in a book published in 1982. Known as menu engineering, the
technique is now widely known and respected and has been the subject of numerous papers and
articles.Althoughsome donotagree entirely with the conclusions drawn by Kasavana and Smith, their
approach to menu analysis is still timely, and is both interesting and revealing.
Figure 11.1
Menu engineeringcanbestbe explainedbyexample.A MenuEngineeringWorksheetshowingsales
of entrée items of the Grandview Bistro for the month of February is illustrated in Figure 11.1 .
Initially, one notes many similarities to the Menu Pre - Cost and Abstract form illustrated and
discussed in previous article. Column headings such as “ Menu Item Name, ” “ Number Sold, ” “
Food Cost, ” “ Sales Price, ” “ Menu Cost, ” and “ Menu Revenues ” give one a sense of familiarity.
Although the terms differ slightly, these are much the same as those used on the Menu Pre - Cost
and Abstractform.Specifically, the Menu Engineering Worksheet closely corresponds to the right,
or abstract, side of the form in previous article. The sources of the data and the required
computations are exactly the same.
There are several additional columnsthatdistinguishthe MenuEngineering Worksheet: (C) “ Menu
Mix %”; (F) “ Item CM”; (L) “ Menu CM”; (P) “ CMCategory ” ; (R) “ MMCategory ” ; and (S) “ Menu
Item Classification. ” At the bottom of the worksheet, there are several additional computations.
Both the additional columns and the computations require some explanation.
Column C: Menu Mix Percent
The menumix percentisthe same as the popularityindex,whichwascalculatedinpreviousarticles.
The percentage foreach itemiscalculatedbydividingthe numberof units sold by the total number
of unitssoldforall items.Forexample,252portionsof StripSteakwere sold,anda total portionsale
for all items was 2,635. The menu mix percent for this item is calculated as 9.564 percent. In
addition,207 portionsof ChickenAlbuferawere sold,andthe menu mix percentage was calculated
at 7.856 percent. The menu mix percent for each of the other items is calculated the same way.
Question
Sales records for a luncheon in the Zalika’s Restaurant for a recent week were: Given this
information, calculate the sales mix.
Item A, 196
Item B, 72
Item C, 142
Item D, 24
Item E, 112
Item F,224
Item G,162
Column F: Item CM
The studentwill recall fromdiscussioninprevious articles that contribution margin (CM) is defined
as salesprice minusvariable costperunit.Itisanotherphrase for grossprofit,previously calculated
for Strip Steak and Chicken Albufera. Thus, the CM for Strip Steak and all other menu items is
determinedbysubtractingthe portioncostforthe itemfromits salesprice,aspreviouslyillustrated.
For Strip Steak:
Sales price $23.65 – Food cost $ 7.50=CM $16.15
The CM is the amount available from each sale to contribute toward meeting all other costs of
operation, and, when those costs have been met, to provide profit for the owner.
Column G: Menu Cost
The menu cost for the item is simply the number sold, as shown in column B, times the individual
cost, as shown in Column D. It is the same as the “Total Cost” column in the Menu Pre - Cost and
Abstract form.
252 portions of Strip Steak sold x $7.50 = $1,890 menu cost
Column H: Menu Revenues
Similarly,menurevenue foranitemisthe numbersold,asshownin column B, times the sales price
of the item, as shown in Column E.
252 units sold x $23.65 = $5,959.80 menu revenues
Column L: Menu CM
The menucontributionmarginisfoundbymultiplyingthe numberof units sold for each menu item
by its contribution margin. Thus, for Strip Steak, 252 units sold x $16.15 CM= $4,069.80 menu CM
Thiscalculationshowsthe total of contribution margins provided by the particular menu item. The
sum of all the individual totals is found in Box M. For the Grandview Bistro, the total contribution
margins for all items for the month of February are shown as $36,056.75. This amount of money is
available tobe applied to all other costs in the restaurant and to provide a profit. It is important to
note that the amount shown in Box M is the contribution margins for entrées only and does not
include othersalessuchas appetizers,desserts,andbeverages.There would be a larger total menu
contribution if one were toinclude sales of otheritems.The MenuEngineering worksheet shown in
Figure 11.1 includes only entrées, because the analysis would be skewed and invalid if sales of all
menu items were included in one worksheet.
Column P: CM Category
The entries in this column, L for low and H for high, are made after comparing the contribution
marginfor eachmenuitem(ColumnF) withthe average contribution margin for the menu (Box O).
If the contributionmarginforagivenmenuitemislowerthanthe average contribution margin, the
entry for that item in Column P is L for low. If the contribution margin is higher than average, the
entry is H for high. For example, the contribution margin for Strip Steak is $16.15, which is higher
than the average contributionmarginforthe menu,$13.68. Thus, the entry for that item in Column
P is an H for high. Chicken Albufera has a CM of $11.25, which is lower than the average
contribution margin of $13.68, and the entry in Column P for that item is L for low .
Column R: MM Category
The entries in Column R (L and H for low and high) are determined by comparingthe menu mix
percentage for each item in Column C with the figure in Box Q. For example, the menu mix
percentage for Strip Steak is 9.564 percent.
Compared with the 4.375 percent figure in Box Q, this is high, so the entry for Strip Steak is the
letterH.The menumix percentage forChickenAlbufera is 7.856 percent, also higher than the 4.375
percent in Box Q. However, Roasted Duck Breast represents only 3.871 percent and is lower than
the 4.375 percent in Box Q, so it receives an L. Because all entries in Column P and Column R must
be one of two letters (either H or L), there are four possible combinations of letters: H/H, L/L, H/L,
and L/H. These fourpossible combinationsare usedtoidentify menu items. In the special language
of menu engineering, each has been given a name:
• H/H isa star.A star is a menuitemthatproducesbothhigh contribution margin and high volume.
These are the items that foodservice operators prefer to sell when they can.
• L/L is a dog. A dog is a menu item that produces a comparatively low contribution margin and
accounts forrelativelylowvolume.Theseare probablythe leastdesirableitems to have on a menu.
• L/H is a plow horse. A plow horse is a menu item that produces a low contribution margin, but
accounts for relatively high volume. These are items that have broad appeal to customers, but
contribute comparatively little profit per unit sold.
• H/L isa puzzle.A puzzle isamenuitemthat produces a high contribution margin but accounts for
comparatively low sales volume.
Because it provides a demonstration of the extent to which each menu item contributes to
profitability, the Menu Engineering Worksheet can be of great use to restaurateurs who are
interested in maximizing profit.
MENU ANALYSIS
Description of Stars, Plow horses, Puzzles, and Dogs
Having completed the worksheet, a restaurateur can use the general guidelines offered in the
followingparagraphstoanalyze the list of menu offerings and then determine the changes, if any,
that would improve the menu.
Stars
Stars are both profitable and popular and should normally be left alone, unless there is a valid
reason for change. Because of the popularity of stars, it is sometimes possible to increase their
menu prices without affecting volume, thus increasing their profitability.
Plow horses
Plowhorsesare popular,butrelativelyunprofitable.Theyshouldbe keptonthe menu,butattempts
shouldbe made to increase theircontributionmargins withoutdecreasingvolume.A possibilityis to
decrease standardportionsize slightlywhileimprovingthe appearance of the product.Anotheris to
raise pricesonsuch items,assumingthatthe volume of those itemswill notbe adverselyaffectedto
any great extent.
Puzzles
Puzzles are comparatively profitable, but relatively unpopular. They should be kept on the menu,
but attempts should be made to increase their popularity without decreasing their profitability
substantially. There are any numbers of ways to do this, including repositioning items to more
favorable locations on the menu, featuring items as specials suggested to diners by servers, and
changing the appearances or menu descriptions of these items to increase their appeal.
Dogs
Because dogs are both unprofitable and unpopular, they should be removed from the menu and
replacedwithmore profitable itemsunless(1) there isavalid reason for continuing to sell a dog (as
with an item that promotes other sales) or (2) its profitability can somehow be increased to an
acceptable level.
Thiswill require thatthe itembe changedin some way. One way of changing an item from a dog to
a puzzle is to increase contribution margin per unit, which may be done by increasing sales price.
The Menu Engineering Worksheet in Figure 11.1 shows the following:
 Stars: Strip Steak, Tournedos Rossini, and Steak Diane.
 Plow horses:GingerShrimp,Tea - SmokedSalmon,Pan - Seared Chicken, Chicken Albufera,
Trout Grenobloise, Shrimp a la Marseille, Fruits de Mer, and Catch of the Day.
 Puzzles : Roasted Duck Breast, Parmesan Veal Steak, Loin of Pork, and Lamb Chops
 Dogs : Vegetarian Burrito
However, all stars, plow horses, puzzles, and dogs are not the same. Some stars are truly
outstanding, with very high volume and very high contribution margins. Examples of this are Strip
Steakand TournedosRossini. Tea- SmokedSalmon,onthe otherhand,hasveryhighvolume,butits
contribution margin is $13.45, very close to the average of $13.68. If its price were raised $0.25, it
wouldbe inthe star category.Duck Breast, by contrast, is classified as a puzzle, yet its contribution
margin is $14.10. If its price were just $0.42 lower, it would be in the dog category.
Graphic Representation of Stars, Plow horses, Puzzles, and Dogs
It ispossible tobettervisualize the differencesin the items by plotting them on a chart, as we have
done inFigure 11.2. The numberssoldare shownon the vertical line atthe left of the chart, and the
contributionmarginsare shownonthe horizontal line atthe bottomof the chart. The horizontal line
goingacross the chart at the 115 number, which is 70 percent of the average MM, represents 4.375
percent,the cutoff pointthatdetermineswhetheranitemisclassifiedashighorlow for volume. All
items shown above the 4.375 percent line are classified as high, and all items shown below the
4.375 percent line are classified as low. The vertical line in the center of the chart represents the
cutoff point that determines whether an item is classified as high or low for contribution margin.
All itemsshowntothe left of the line are classified as low, and all items to the right of the line are
classifiedashigh.We have placedeachiteminitsapproximate positionon the chart so that a visual
picture of all items can be shown.
Figure 11.2
Thus one can see thatsome items — Loin of Pork,VegetarianBurrito,Veal Steak, Lamb Chops, Duck
Breast, Shrimp à la Marseille, Fruits de Mer, Ginger Shrimp, and Salmon — are very close to
becoming classified in another category.
Using the Categories to Alter Menus
Having completed the Menu Engineering Worksheet and the Graphic Representation of Stars,
Puzzles,Plow horses,and Dogs, it is now possible to analyze the menu and make changes that will
improve contribution margins.
Restaurant : Period:
A B C D E F G H L P R S
Menu Item
Name
# Sold
Menu
Mix %
Food
Cost
Sales
Price
Item CM
(E-D)
Menu
Cost
(D*B)
Menu
Revenues
(E*B)
Menu CM
(F*B)
CM
Catergory
MM
Catergory
Menu Item
Classification
Fried Chicken 175 $3.00 $7.00
Sirloin Steak 190 $5.50 $13.00
Baked Ham 40 $4.00 $8.00
Stuffed Sole 45 $7.00 $13.00
Swordfish 80 $8.00 $15.00
Lobster 60 $7.50 $16.00
Veal Marsala 90 $5.50 $14.00
Roast Rib 145 $6.00 $13.00
Lamb Chops 125 $6.00 $9.00
Beef Burgundy 50 $3.50 $7.00
Column N I J M
Totals $ $ $
K=I/J O=M/N
Menu Engineering Worksheet
Izati"s café 23rd December 2014
Q=(1/no.of item X 70%)
Exercise
1. George’s Restaurant had the following menu sales during a period of one week:
a. Calculate the menu mix percentage for each menu item.
b. Calculate menu contribution margin for the week.
c. Calculate menu food cost percentage for the week.
Menu Item Sales Food Cost Menu Price
StripSteak 73 $6.50 $18.90
FriedChicken 90 $3.90 $12.75
Lamb Chops 55 $7.00 $20.35
FriedScallops 92 $5.90 $18.50
BroiledHaddock 85 $4.50 $15.65
Roast Turkey 92 $3.00 $12.00
BakedStuffedShrimp 77 $6.70 $18.50
Veal Marsala 65 $6.50 $18.75
2. Generate Menu Engineering and analysis
a. Complete the Menu Engineering Worksheet reproduced in Figure 11.3, filling in the missing
information.
b. Prepare a graph similar to Figure 11.2 showing stars, plow horses, puzzles, and dogs.
Figure 11.3

Weitere ähnliche Inhalte

Was ist angesagt?

Typesoffoodandbeverageservices 121005133457-phpapp01-1
Typesoffoodandbeverageservices 121005133457-phpapp01-1Typesoffoodandbeverageservices 121005133457-phpapp01-1
Typesoffoodandbeverageservices 121005133457-phpapp01-1afrah khurshid
 
Menu Engineering
Menu EngineeringMenu Engineering
Menu EngineeringSyed Abbas
 
Hotel cost control - master class
Hotel cost control - master classHotel cost control - master class
Hotel cost control - master classManish Gupta
 
Suggestive Selling in the Restaurants
Suggestive Selling in the RestaurantsSuggestive Selling in the Restaurants
Suggestive Selling in the RestaurantsBhavana Agarwal
 
Food and Beverage Operations Management System
Food and Beverage Operations Management SystemFood and Beverage Operations Management System
Food and Beverage Operations Management SystemAssignment Prime
 
Introduction -History of Culinary
Introduction -History of CulinaryIntroduction -History of Culinary
Introduction -History of Culinaryhaysell12
 
Food and beverage service operating equipments
Food and beverage service operating equipmentsFood and beverage service operating equipments
Food and beverage service operating equipmentsLeslie
 
History of Food Service Industry
History of Food Service IndustryHistory of Food Service Industry
History of Food Service IndustryEkta Dugar
 
Breakfast Cookery: www.chefqtrainer.blogspot.com
Breakfast Cookery: www.chefqtrainer.blogspot.com   Breakfast Cookery: www.chefqtrainer.blogspot.com
Breakfast Cookery: www.chefqtrainer.blogspot.com Culinary Training Program
 
GARDE MANGER & CHARCUTERIE
GARDE MANGER & CHARCUTERIEGARDE MANGER & CHARCUTERIE
GARDE MANGER & CHARCUTERIEHarshal Kamble
 
Styles of table service ppt
Styles of table service pptStyles of table service ppt
Styles of table service pptKrouern Sopheak
 
Menu Engineering
Menu EngineeringMenu Engineering
Menu Engineeringangelagrace
 

Was ist angesagt? (20)

Food costing
Food costingFood costing
Food costing
 
Typesoffoodandbeverageservices 121005133457-phpapp01-1
Typesoffoodandbeverageservices 121005133457-phpapp01-1Typesoffoodandbeverageservices 121005133457-phpapp01-1
Typesoffoodandbeverageservices 121005133457-phpapp01-1
 
Food Costing
Food CostingFood Costing
Food Costing
 
MENU
MENUMENU
MENU
 
Menu Engineering
Menu EngineeringMenu Engineering
Menu Engineering
 
Garde manger
Garde mangerGarde manger
Garde manger
 
Chapter 2 mise-en-place(1)
Chapter 2   mise-en-place(1)Chapter 2   mise-en-place(1)
Chapter 2 mise-en-place(1)
 
Hotel cost control - master class
Hotel cost control - master classHotel cost control - master class
Hotel cost control - master class
 
Suggestive Selling in the Restaurants
Suggestive Selling in the RestaurantsSuggestive Selling in the Restaurants
Suggestive Selling in the Restaurants
 
Chapter 41 yield
Chapter 41 yieldChapter 41 yield
Chapter 41 yield
 
Food and Beverage Operations Management System
Food and Beverage Operations Management SystemFood and Beverage Operations Management System
Food and Beverage Operations Management System
 
Introduction -History of Culinary
Introduction -History of CulinaryIntroduction -History of Culinary
Introduction -History of Culinary
 
Chapter 5 - Serving Techniques
Chapter 5 - Serving TechniquesChapter 5 - Serving Techniques
Chapter 5 - Serving Techniques
 
Food and beverage service operating equipments
Food and beverage service operating equipmentsFood and beverage service operating equipments
Food and beverage service operating equipments
 
MENU
MENUMENU
MENU
 
History of Food Service Industry
History of Food Service IndustryHistory of Food Service Industry
History of Food Service Industry
 
Breakfast Cookery: www.chefqtrainer.blogspot.com
Breakfast Cookery: www.chefqtrainer.blogspot.com   Breakfast Cookery: www.chefqtrainer.blogspot.com
Breakfast Cookery: www.chefqtrainer.blogspot.com
 
GARDE MANGER & CHARCUTERIE
GARDE MANGER & CHARCUTERIEGARDE MANGER & CHARCUTERIE
GARDE MANGER & CHARCUTERIE
 
Styles of table service ppt
Styles of table service pptStyles of table service ppt
Styles of table service ppt
 
Menu Engineering
Menu EngineeringMenu Engineering
Menu Engineering
 

Andere mochten auch (20)

Menu pricing
Menu pricingMenu pricing
Menu pricing
 
F&B Budgeting
F&B BudgetingF&B Budgeting
F&B Budgeting
 
Food and Beverage Cost Control
Food and Beverage Cost ControlFood and Beverage Cost Control
Food and Beverage Cost Control
 
Menu analysis engineering382
Menu analysis engineering382Menu analysis engineering382
Menu analysis engineering382
 
Food cost %
Food cost %Food cost %
Food cost %
 
Wine of italy
Wine of italyWine of italy
Wine of italy
 
Wine of france
Wine of franceWine of france
Wine of france
 
Quick Service Restaurant Costs
Quick Service Restaurant CostsQuick Service Restaurant Costs
Quick Service Restaurant Costs
 
Basic operating procedure – haveli kitchen
Basic operating procedure – haveli kitchenBasic operating procedure – haveli kitchen
Basic operating procedure – haveli kitchen
 
Vodka
VodkaVodka
Vodka
 
Up selling skills
Up selling skillsUp selling skills
Up selling skills
 
Food cost control
Food cost controlFood cost control
Food cost control
 
Up Selling-Restaurants
Up Selling-RestaurantsUp Selling-Restaurants
Up Selling-Restaurants
 
Standard cocktails
Standard  cocktailsStandard  cocktails
Standard cocktails
 
French wines
French wines French wines
French wines
 
Tequila
TequilaTequila
Tequila
 
Food and beverage cost control (2nd edition)
Food and beverage cost control (2nd edition)Food and beverage cost control (2nd edition)
Food and beverage cost control (2nd edition)
 
Hospitality
HospitalityHospitality
Hospitality
 
Purchasing
PurchasingPurchasing
Purchasing
 
Storage
StorageStorage
Storage
 

Ähnlich wie Topic 3: Menu Engineering & Analysis

Proven Menu Engineering Techniques - 2017 Mid America Restaurant Expo
Proven Menu Engineering Techniques - 2017 Mid America Restaurant ExpoProven Menu Engineering Techniques - 2017 Mid America Restaurant Expo
Proven Menu Engineering Techniques - 2017 Mid America Restaurant ExpoReturn On Ingredients
 
Latest in Menu Reengineering by Chef Josh Boutwood
Latest in Menu Reengineering by Chef Josh Boutwood Latest in Menu Reengineering by Chef Josh Boutwood
Latest in Menu Reengineering by Chef Josh Boutwood Homer Nievera
 
TOPIC 2: Menu cost and Pricing Strategies
TOPIC 2:  Menu cost and Pricing StrategiesTOPIC 2:  Menu cost and Pricing Strategies
TOPIC 2: Menu cost and Pricing StrategiesAkmal Hafiz
 
2015 DMC2523 Topic 7 cost and sales concept
2015 DMC2523 Topic 7 cost and sales concept2015 DMC2523 Topic 7 cost and sales concept
2015 DMC2523 Topic 7 cost and sales conceptLaura Law
 
Chapter3
Chapter3Chapter3
Chapter3juegojr
 
Chapter3
Chapter3Chapter3
Chapter3juegojr
 
Using the data below, I need answers to the following questionsa).pdf
Using the data below, I need answers to the following questionsa).pdfUsing the data below, I need answers to the following questionsa).pdf
Using the data below, I need answers to the following questionsa).pdfanandastores
 
2015 DMC2523 Topic 9 cost control-profit relationship
2015 DMC2523 Topic 9 cost control-profit relationship2015 DMC2523 Topic 9 cost control-profit relationship
2015 DMC2523 Topic 9 cost control-profit relationshipLaura Law
 
FBS Theory sms 5 ppt 2.pptx
FBS Theory sms 5 ppt 2.pptxFBS Theory sms 5 ppt 2.pptx
FBS Theory sms 5 ppt 2.pptxnovnyandryani1
 
Agribusiness market analysis
Agribusiness market analysisAgribusiness market analysis
Agribusiness market analysisDaisy Ifeoma
 
Psychology of a menu
Psychology of a menuPsychology of a menu
Psychology of a menuanthimog
 
Pricing strategies for the catering industry midterms
Pricing strategies for the catering industry midtermsPricing strategies for the catering industry midterms
Pricing strategies for the catering industry midtermsArnold Manus
 
food and bverage cost controls
food and bverage cost controlsfood and bverage cost controls
food and bverage cost controlsashok kumar
 
Operations Management ~ Intro
Operations Management ~ IntroOperations Management ~ Intro
Operations Management ~ IntroWill Bohmann
 
How to Cut Costs without Reducing Quality
How to Cut Costs without Reducing QualityHow to Cut Costs without Reducing Quality
How to Cut Costs without Reducing QualityProfitable Hospitality
 

Ähnlich wie Topic 3: Menu Engineering & Analysis (20)

Proven Menu Engineering Techniques - 2017 Mid America Restaurant Expo
Proven Menu Engineering Techniques - 2017 Mid America Restaurant ExpoProven Menu Engineering Techniques - 2017 Mid America Restaurant Expo
Proven Menu Engineering Techniques - 2017 Mid America Restaurant Expo
 
Latest in Menu Reengineering by Chef Josh Boutwood
Latest in Menu Reengineering by Chef Josh Boutwood Latest in Menu Reengineering by Chef Josh Boutwood
Latest in Menu Reengineering by Chef Josh Boutwood
 
Menu engineering
Menu engineeringMenu engineering
Menu engineering
 
TOPIC 2: Menu cost and Pricing Strategies
TOPIC 2:  Menu cost and Pricing StrategiesTOPIC 2:  Menu cost and Pricing Strategies
TOPIC 2: Menu cost and Pricing Strategies
 
2015 DMC2523 Topic 7 cost and sales concept
2015 DMC2523 Topic 7 cost and sales concept2015 DMC2523 Topic 7 cost and sales concept
2015 DMC2523 Topic 7 cost and sales concept
 
Chapter3
Chapter3Chapter3
Chapter3
 
Chapter3
Chapter3Chapter3
Chapter3
 
Using the data below, I need answers to the following questionsa).pdf
Using the data below, I need answers to the following questionsa).pdfUsing the data below, I need answers to the following questionsa).pdf
Using the data below, I need answers to the following questionsa).pdf
 
2015 DMC2523 Topic 9 cost control-profit relationship
2015 DMC2523 Topic 9 cost control-profit relationship2015 DMC2523 Topic 9 cost control-profit relationship
2015 DMC2523 Topic 9 cost control-profit relationship
 
COST CONTROL
COST CONTROLCOST CONTROL
COST CONTROL
 
FBS Theory sms 5 ppt 2.pptx
FBS Theory sms 5 ppt 2.pptxFBS Theory sms 5 ppt 2.pptx
FBS Theory sms 5 ppt 2.pptx
 
Agribusiness market analysis
Agribusiness market analysisAgribusiness market analysis
Agribusiness market analysis
 
Psychology of a menu
Psychology of a menuPsychology of a menu
Psychology of a menu
 
Psychology of a menu
Psychology of a menuPsychology of a menu
Psychology of a menu
 
Pricing strategies for the catering industry midterms
Pricing strategies for the catering industry midtermsPricing strategies for the catering industry midterms
Pricing strategies for the catering industry midterms
 
food and bverage cost controls
food and bverage cost controlsfood and bverage cost controls
food and bverage cost controls
 
meat_money
meat_moneymeat_money
meat_money
 
Operations Management ~ Intro
Operations Management ~ IntroOperations Management ~ Intro
Operations Management ~ Intro
 
Chap 6
Chap 6Chap 6
Chap 6
 
How to Cut Costs without Reducing Quality
How to Cut Costs without Reducing QualityHow to Cut Costs without Reducing Quality
How to Cut Costs without Reducing Quality
 

Mehr von Akmal Hafiz

The business of sustainability
The business of sustainabilityThe business of sustainability
The business of sustainabilityAkmal Hafiz
 
Topic 1 the menu
Topic 1 the menuTopic 1 the menu
Topic 1 the menuAkmal Hafiz
 
Classification of-commodities2204-120114234912-phpapp02
Classification of-commodities2204-120114234912-phpapp02Classification of-commodities2204-120114234912-phpapp02
Classification of-commodities2204-120114234912-phpapp02Akmal Hafiz
 
Principles of food sanitation
Principles of food sanitationPrinciples of food sanitation
Principles of food sanitationAkmal Hafiz
 
Chapter 1 intro to hospitality and tourism
Chapter 1 intro to hospitality and tourismChapter 1 intro to hospitality and tourism
Chapter 1 intro to hospitality and tourismAkmal Hafiz
 

Mehr von Akmal Hafiz (6)

The business of sustainability
The business of sustainabilityThe business of sustainability
The business of sustainability
 
Topic 1 the menu
Topic 1 the menuTopic 1 the menu
Topic 1 the menu
 
Classification of-commodities2204-120114234912-phpapp02
Classification of-commodities2204-120114234912-phpapp02Classification of-commodities2204-120114234912-phpapp02
Classification of-commodities2204-120114234912-phpapp02
 
Purchasing
PurchasingPurchasing
Purchasing
 
Principles of food sanitation
Principles of food sanitationPrinciples of food sanitation
Principles of food sanitation
 
Chapter 1 intro to hospitality and tourism
Chapter 1 intro to hospitality and tourismChapter 1 intro to hospitality and tourism
Chapter 1 intro to hospitality and tourism
 

Kürzlich hochgeladen

APM Welcome, APM North West Network Conference, Synergies Across Sectors
APM Welcome, APM North West Network Conference, Synergies Across SectorsAPM Welcome, APM North West Network Conference, Synergies Across Sectors
APM Welcome, APM North West Network Conference, Synergies Across SectorsAssociation for Project Management
 
Beyond the EU: DORA and NIS 2 Directive's Global Impact
Beyond the EU: DORA and NIS 2 Directive's Global ImpactBeyond the EU: DORA and NIS 2 Directive's Global Impact
Beyond the EU: DORA and NIS 2 Directive's Global ImpactPECB
 
Unit-IV- Pharma. Marketing Channels.pptx
Unit-IV- Pharma. Marketing Channels.pptxUnit-IV- Pharma. Marketing Channels.pptx
Unit-IV- Pharma. Marketing Channels.pptxVishalSingh1417
 
ICT Role in 21st Century Education & its Challenges.pptx
ICT Role in 21st Century Education & its Challenges.pptxICT Role in 21st Century Education & its Challenges.pptx
ICT Role in 21st Century Education & its Challenges.pptxAreebaZafar22
 
Grant Readiness 101 TechSoup and Remy Consulting
Grant Readiness 101 TechSoup and Remy ConsultingGrant Readiness 101 TechSoup and Remy Consulting
Grant Readiness 101 TechSoup and Remy ConsultingTechSoup
 
Accessible design: Minimum effort, maximum impact
Accessible design: Minimum effort, maximum impactAccessible design: Minimum effort, maximum impact
Accessible design: Minimum effort, maximum impactdawncurless
 
SOCIAL AND HISTORICAL CONTEXT - LFTVD.pptx
SOCIAL AND HISTORICAL CONTEXT - LFTVD.pptxSOCIAL AND HISTORICAL CONTEXT - LFTVD.pptx
SOCIAL AND HISTORICAL CONTEXT - LFTVD.pptxiammrhaywood
 
Russian Escort Service in Delhi 11k Hotel Foreigner Russian Call Girls in Delhi
Russian Escort Service in Delhi 11k Hotel Foreigner Russian Call Girls in DelhiRussian Escort Service in Delhi 11k Hotel Foreigner Russian Call Girls in Delhi
Russian Escort Service in Delhi 11k Hotel Foreigner Russian Call Girls in Delhikauryashika82
 
How to Give a Domain for a Field in Odoo 17
How to Give a Domain for a Field in Odoo 17How to Give a Domain for a Field in Odoo 17
How to Give a Domain for a Field in Odoo 17Celine George
 
1029-Danh muc Sach Giao Khoa khoi 6.pdf
1029-Danh muc Sach Giao Khoa khoi  6.pdf1029-Danh muc Sach Giao Khoa khoi  6.pdf
1029-Danh muc Sach Giao Khoa khoi 6.pdfQucHHunhnh
 
SECOND SEMESTER TOPIC COVERAGE SY 2023-2024 Trends, Networks, and Critical Th...
SECOND SEMESTER TOPIC COVERAGE SY 2023-2024 Trends, Networks, and Critical Th...SECOND SEMESTER TOPIC COVERAGE SY 2023-2024 Trends, Networks, and Critical Th...
SECOND SEMESTER TOPIC COVERAGE SY 2023-2024 Trends, Networks, and Critical Th...KokoStevan
 
Web & Social Media Analytics Previous Year Question Paper.pdf
Web & Social Media Analytics Previous Year Question Paper.pdfWeb & Social Media Analytics Previous Year Question Paper.pdf
Web & Social Media Analytics Previous Year Question Paper.pdfJayanti Pande
 
psychiatric nursing HISTORY COLLECTION .docx
psychiatric  nursing HISTORY  COLLECTION  .docxpsychiatric  nursing HISTORY  COLLECTION  .docx
psychiatric nursing HISTORY COLLECTION .docxPoojaSen20
 
Seal of Good Local Governance (SGLG) 2024Final.pptx
Seal of Good Local Governance (SGLG) 2024Final.pptxSeal of Good Local Governance (SGLG) 2024Final.pptx
Seal of Good Local Governance (SGLG) 2024Final.pptxnegromaestrong
 
Advanced Views - Calendar View in Odoo 17
Advanced Views - Calendar View in Odoo 17Advanced Views - Calendar View in Odoo 17
Advanced Views - Calendar View in Odoo 17Celine George
 
Holdier Curriculum Vitae (April 2024).pdf
Holdier Curriculum Vitae (April 2024).pdfHoldier Curriculum Vitae (April 2024).pdf
Holdier Curriculum Vitae (April 2024).pdfagholdier
 
1029 - Danh muc Sach Giao Khoa 10 . pdf
1029 -  Danh muc Sach Giao Khoa 10 . pdf1029 -  Danh muc Sach Giao Khoa 10 . pdf
1029 - Danh muc Sach Giao Khoa 10 . pdfQucHHunhnh
 
Introduction to Nonprofit Accounting: The Basics
Introduction to Nonprofit Accounting: The BasicsIntroduction to Nonprofit Accounting: The Basics
Introduction to Nonprofit Accounting: The BasicsTechSoup
 
Nutritional Needs Presentation - HLTH 104
Nutritional Needs Presentation - HLTH 104Nutritional Needs Presentation - HLTH 104
Nutritional Needs Presentation - HLTH 104misteraugie
 

Kürzlich hochgeladen (20)

APM Welcome, APM North West Network Conference, Synergies Across Sectors
APM Welcome, APM North West Network Conference, Synergies Across SectorsAPM Welcome, APM North West Network Conference, Synergies Across Sectors
APM Welcome, APM North West Network Conference, Synergies Across Sectors
 
Beyond the EU: DORA and NIS 2 Directive's Global Impact
Beyond the EU: DORA and NIS 2 Directive's Global ImpactBeyond the EU: DORA and NIS 2 Directive's Global Impact
Beyond the EU: DORA and NIS 2 Directive's Global Impact
 
Mattingly "AI & Prompt Design: The Basics of Prompt Design"
Mattingly "AI & Prompt Design: The Basics of Prompt Design"Mattingly "AI & Prompt Design: The Basics of Prompt Design"
Mattingly "AI & Prompt Design: The Basics of Prompt Design"
 
Unit-IV- Pharma. Marketing Channels.pptx
Unit-IV- Pharma. Marketing Channels.pptxUnit-IV- Pharma. Marketing Channels.pptx
Unit-IV- Pharma. Marketing Channels.pptx
 
ICT Role in 21st Century Education & its Challenges.pptx
ICT Role in 21st Century Education & its Challenges.pptxICT Role in 21st Century Education & its Challenges.pptx
ICT Role in 21st Century Education & its Challenges.pptx
 
Grant Readiness 101 TechSoup and Remy Consulting
Grant Readiness 101 TechSoup and Remy ConsultingGrant Readiness 101 TechSoup and Remy Consulting
Grant Readiness 101 TechSoup and Remy Consulting
 
Accessible design: Minimum effort, maximum impact
Accessible design: Minimum effort, maximum impactAccessible design: Minimum effort, maximum impact
Accessible design: Minimum effort, maximum impact
 
SOCIAL AND HISTORICAL CONTEXT - LFTVD.pptx
SOCIAL AND HISTORICAL CONTEXT - LFTVD.pptxSOCIAL AND HISTORICAL CONTEXT - LFTVD.pptx
SOCIAL AND HISTORICAL CONTEXT - LFTVD.pptx
 
Russian Escort Service in Delhi 11k Hotel Foreigner Russian Call Girls in Delhi
Russian Escort Service in Delhi 11k Hotel Foreigner Russian Call Girls in DelhiRussian Escort Service in Delhi 11k Hotel Foreigner Russian Call Girls in Delhi
Russian Escort Service in Delhi 11k Hotel Foreigner Russian Call Girls in Delhi
 
How to Give a Domain for a Field in Odoo 17
How to Give a Domain for a Field in Odoo 17How to Give a Domain for a Field in Odoo 17
How to Give a Domain for a Field in Odoo 17
 
1029-Danh muc Sach Giao Khoa khoi 6.pdf
1029-Danh muc Sach Giao Khoa khoi  6.pdf1029-Danh muc Sach Giao Khoa khoi  6.pdf
1029-Danh muc Sach Giao Khoa khoi 6.pdf
 
SECOND SEMESTER TOPIC COVERAGE SY 2023-2024 Trends, Networks, and Critical Th...
SECOND SEMESTER TOPIC COVERAGE SY 2023-2024 Trends, Networks, and Critical Th...SECOND SEMESTER TOPIC COVERAGE SY 2023-2024 Trends, Networks, and Critical Th...
SECOND SEMESTER TOPIC COVERAGE SY 2023-2024 Trends, Networks, and Critical Th...
 
Web & Social Media Analytics Previous Year Question Paper.pdf
Web & Social Media Analytics Previous Year Question Paper.pdfWeb & Social Media Analytics Previous Year Question Paper.pdf
Web & Social Media Analytics Previous Year Question Paper.pdf
 
psychiatric nursing HISTORY COLLECTION .docx
psychiatric  nursing HISTORY  COLLECTION  .docxpsychiatric  nursing HISTORY  COLLECTION  .docx
psychiatric nursing HISTORY COLLECTION .docx
 
Seal of Good Local Governance (SGLG) 2024Final.pptx
Seal of Good Local Governance (SGLG) 2024Final.pptxSeal of Good Local Governance (SGLG) 2024Final.pptx
Seal of Good Local Governance (SGLG) 2024Final.pptx
 
Advanced Views - Calendar View in Odoo 17
Advanced Views - Calendar View in Odoo 17Advanced Views - Calendar View in Odoo 17
Advanced Views - Calendar View in Odoo 17
 
Holdier Curriculum Vitae (April 2024).pdf
Holdier Curriculum Vitae (April 2024).pdfHoldier Curriculum Vitae (April 2024).pdf
Holdier Curriculum Vitae (April 2024).pdf
 
1029 - Danh muc Sach Giao Khoa 10 . pdf
1029 -  Danh muc Sach Giao Khoa 10 . pdf1029 -  Danh muc Sach Giao Khoa 10 . pdf
1029 - Danh muc Sach Giao Khoa 10 . pdf
 
Introduction to Nonprofit Accounting: The Basics
Introduction to Nonprofit Accounting: The BasicsIntroduction to Nonprofit Accounting: The Basics
Introduction to Nonprofit Accounting: The Basics
 
Nutritional Needs Presentation - HLTH 104
Nutritional Needs Presentation - HLTH 104Nutritional Needs Presentation - HLTH 104
Nutritional Needs Presentation - HLTH 104
 

Topic 3: Menu Engineering & Analysis

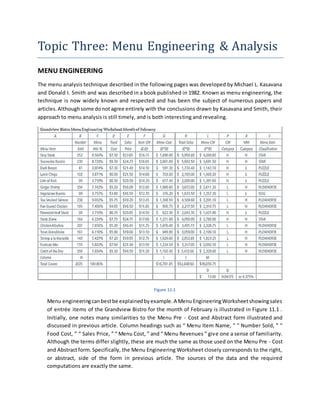
  • 1. Topic Three: Menu Engineering & Analysis MENU ENGINEERING The menu analysis technique described in the following pages was developed by Michael L. Kasavana and Donald I. Smith and was described in a book published in 1982. Known as menu engineering, the technique is now widely known and respected and has been the subject of numerous papers and articles.Althoughsome donotagree entirely with the conclusions drawn by Kasavana and Smith, their approach to menu analysis is still timely, and is both interesting and revealing. Figure 11.1 Menu engineeringcanbestbe explainedbyexample.A MenuEngineeringWorksheetshowingsales of entrée items of the Grandview Bistro for the month of February is illustrated in Figure 11.1 . Initially, one notes many similarities to the Menu Pre - Cost and Abstract form illustrated and discussed in previous article. Column headings such as “ Menu Item Name, ” “ Number Sold, ” “ Food Cost, ” “ Sales Price, ” “ Menu Cost, ” and “ Menu Revenues ” give one a sense of familiarity. Although the terms differ slightly, these are much the same as those used on the Menu Pre - Cost and Abstractform.Specifically, the Menu Engineering Worksheet closely corresponds to the right, or abstract, side of the form in previous article. The sources of the data and the required computations are exactly the same.
  • 2. There are several additional columnsthatdistinguishthe MenuEngineering Worksheet: (C) “ Menu Mix %”; (F) “ Item CM”; (L) “ Menu CM”; (P) “ CMCategory ” ; (R) “ MMCategory ” ; and (S) “ Menu Item Classification. ” At the bottom of the worksheet, there are several additional computations. Both the additional columns and the computations require some explanation. Column C: Menu Mix Percent The menumix percentisthe same as the popularityindex,whichwascalculatedinpreviousarticles. The percentage foreach itemiscalculatedbydividingthe numberof units sold by the total number of unitssoldforall items.Forexample,252portionsof StripSteakwere sold,anda total portionsale for all items was 2,635. The menu mix percent for this item is calculated as 9.564 percent. In addition,207 portionsof ChickenAlbuferawere sold,andthe menu mix percentage was calculated at 7.856 percent. The menu mix percent for each of the other items is calculated the same way. Question Sales records for a luncheon in the Zalika’s Restaurant for a recent week were: Given this information, calculate the sales mix. Item A, 196 Item B, 72 Item C, 142 Item D, 24 Item E, 112 Item F,224 Item G,162 Column F: Item CM The studentwill recall fromdiscussioninprevious articles that contribution margin (CM) is defined as salesprice minusvariable costperunit.Itisanotherphrase for grossprofit,previously calculated for Strip Steak and Chicken Albufera. Thus, the CM for Strip Steak and all other menu items is determinedbysubtractingthe portioncostforthe itemfromits salesprice,aspreviouslyillustrated. For Strip Steak: Sales price $23.65 – Food cost $ 7.50=CM $16.15 The CM is the amount available from each sale to contribute toward meeting all other costs of operation, and, when those costs have been met, to provide profit for the owner.
  • 3. Column G: Menu Cost The menu cost for the item is simply the number sold, as shown in column B, times the individual cost, as shown in Column D. It is the same as the “Total Cost” column in the Menu Pre - Cost and Abstract form. 252 portions of Strip Steak sold x $7.50 = $1,890 menu cost Column H: Menu Revenues Similarly,menurevenue foranitemisthe numbersold,asshownin column B, times the sales price of the item, as shown in Column E. 252 units sold x $23.65 = $5,959.80 menu revenues Column L: Menu CM The menucontributionmarginisfoundbymultiplyingthe numberof units sold for each menu item by its contribution margin. Thus, for Strip Steak, 252 units sold x $16.15 CM= $4,069.80 menu CM Thiscalculationshowsthe total of contribution margins provided by the particular menu item. The sum of all the individual totals is found in Box M. For the Grandview Bistro, the total contribution margins for all items for the month of February are shown as $36,056.75. This amount of money is available tobe applied to all other costs in the restaurant and to provide a profit. It is important to note that the amount shown in Box M is the contribution margins for entrées only and does not include othersalessuchas appetizers,desserts,andbeverages.There would be a larger total menu contribution if one were toinclude sales of otheritems.The MenuEngineering worksheet shown in Figure 11.1 includes only entrées, because the analysis would be skewed and invalid if sales of all menu items were included in one worksheet. Column P: CM Category The entries in this column, L for low and H for high, are made after comparing the contribution marginfor eachmenuitem(ColumnF) withthe average contribution margin for the menu (Box O). If the contributionmarginforagivenmenuitemislowerthanthe average contribution margin, the entry for that item in Column P is L for low. If the contribution margin is higher than average, the entry is H for high. For example, the contribution margin for Strip Steak is $16.15, which is higher than the average contributionmarginforthe menu,$13.68. Thus, the entry for that item in Column P is an H for high. Chicken Albufera has a CM of $11.25, which is lower than the average contribution margin of $13.68, and the entry in Column P for that item is L for low .
  • 4. Column R: MM Category The entries in Column R (L and H for low and high) are determined by comparingthe menu mix percentage for each item in Column C with the figure in Box Q. For example, the menu mix percentage for Strip Steak is 9.564 percent. Compared with the 4.375 percent figure in Box Q, this is high, so the entry for Strip Steak is the letterH.The menumix percentage forChickenAlbufera is 7.856 percent, also higher than the 4.375 percent in Box Q. However, Roasted Duck Breast represents only 3.871 percent and is lower than the 4.375 percent in Box Q, so it receives an L. Because all entries in Column P and Column R must be one of two letters (either H or L), there are four possible combinations of letters: H/H, L/L, H/L, and L/H. These fourpossible combinationsare usedtoidentify menu items. In the special language of menu engineering, each has been given a name: • H/H isa star.A star is a menuitemthatproducesbothhigh contribution margin and high volume. These are the items that foodservice operators prefer to sell when they can. • L/L is a dog. A dog is a menu item that produces a comparatively low contribution margin and accounts forrelativelylowvolume.Theseare probablythe leastdesirableitems to have on a menu. • L/H is a plow horse. A plow horse is a menu item that produces a low contribution margin, but accounts for relatively high volume. These are items that have broad appeal to customers, but contribute comparatively little profit per unit sold. • H/L isa puzzle.A puzzle isamenuitemthat produces a high contribution margin but accounts for comparatively low sales volume. Because it provides a demonstration of the extent to which each menu item contributes to profitability, the Menu Engineering Worksheet can be of great use to restaurateurs who are interested in maximizing profit. MENU ANALYSIS Description of Stars, Plow horses, Puzzles, and Dogs Having completed the worksheet, a restaurateur can use the general guidelines offered in the followingparagraphstoanalyze the list of menu offerings and then determine the changes, if any, that would improve the menu. Stars Stars are both profitable and popular and should normally be left alone, unless there is a valid reason for change. Because of the popularity of stars, it is sometimes possible to increase their menu prices without affecting volume, thus increasing their profitability.
  • 5. Plow horses Plowhorsesare popular,butrelativelyunprofitable.Theyshouldbe keptonthe menu,butattempts shouldbe made to increase theircontributionmargins withoutdecreasingvolume.A possibilityis to decrease standardportionsize slightlywhileimprovingthe appearance of the product.Anotheris to raise pricesonsuch items,assumingthatthe volume of those itemswill notbe adverselyaffectedto any great extent. Puzzles Puzzles are comparatively profitable, but relatively unpopular. They should be kept on the menu, but attempts should be made to increase their popularity without decreasing their profitability substantially. There are any numbers of ways to do this, including repositioning items to more favorable locations on the menu, featuring items as specials suggested to diners by servers, and changing the appearances or menu descriptions of these items to increase their appeal. Dogs Because dogs are both unprofitable and unpopular, they should be removed from the menu and replacedwithmore profitable itemsunless(1) there isavalid reason for continuing to sell a dog (as with an item that promotes other sales) or (2) its profitability can somehow be increased to an acceptable level. Thiswill require thatthe itembe changedin some way. One way of changing an item from a dog to a puzzle is to increase contribution margin per unit, which may be done by increasing sales price. The Menu Engineering Worksheet in Figure 11.1 shows the following:  Stars: Strip Steak, Tournedos Rossini, and Steak Diane.  Plow horses:GingerShrimp,Tea - SmokedSalmon,Pan - Seared Chicken, Chicken Albufera, Trout Grenobloise, Shrimp a la Marseille, Fruits de Mer, and Catch of the Day.  Puzzles : Roasted Duck Breast, Parmesan Veal Steak, Loin of Pork, and Lamb Chops  Dogs : Vegetarian Burrito However, all stars, plow horses, puzzles, and dogs are not the same. Some stars are truly outstanding, with very high volume and very high contribution margins. Examples of this are Strip Steakand TournedosRossini. Tea- SmokedSalmon,onthe otherhand,hasveryhighvolume,butits contribution margin is $13.45, very close to the average of $13.68. If its price were raised $0.25, it wouldbe inthe star category.Duck Breast, by contrast, is classified as a puzzle, yet its contribution margin is $14.10. If its price were just $0.42 lower, it would be in the dog category.
  • 6. Graphic Representation of Stars, Plow horses, Puzzles, and Dogs It ispossible tobettervisualize the differencesin the items by plotting them on a chart, as we have done inFigure 11.2. The numberssoldare shownon the vertical line atthe left of the chart, and the contributionmarginsare shownonthe horizontal line atthe bottomof the chart. The horizontal line goingacross the chart at the 115 number, which is 70 percent of the average MM, represents 4.375 percent,the cutoff pointthatdetermineswhetheranitemisclassifiedashighorlow for volume. All items shown above the 4.375 percent line are classified as high, and all items shown below the 4.375 percent line are classified as low. The vertical line in the center of the chart represents the cutoff point that determines whether an item is classified as high or low for contribution margin. All itemsshowntothe left of the line are classified as low, and all items to the right of the line are classifiedashigh.We have placedeachiteminitsapproximate positionon the chart so that a visual picture of all items can be shown. Figure 11.2 Thus one can see thatsome items — Loin of Pork,VegetarianBurrito,Veal Steak, Lamb Chops, Duck Breast, Shrimp à la Marseille, Fruits de Mer, Ginger Shrimp, and Salmon — are very close to becoming classified in another category. Using the Categories to Alter Menus Having completed the Menu Engineering Worksheet and the Graphic Representation of Stars, Puzzles,Plow horses,and Dogs, it is now possible to analyze the menu and make changes that will improve contribution margins.
  • 7. Restaurant : Period: A B C D E F G H L P R S Menu Item Name # Sold Menu Mix % Food Cost Sales Price Item CM (E-D) Menu Cost (D*B) Menu Revenues (E*B) Menu CM (F*B) CM Catergory MM Catergory Menu Item Classification Fried Chicken 175 $3.00 $7.00 Sirloin Steak 190 $5.50 $13.00 Baked Ham 40 $4.00 $8.00 Stuffed Sole 45 $7.00 $13.00 Swordfish 80 $8.00 $15.00 Lobster 60 $7.50 $16.00 Veal Marsala 90 $5.50 $14.00 Roast Rib 145 $6.00 $13.00 Lamb Chops 125 $6.00 $9.00 Beef Burgundy 50 $3.50 $7.00 Column N I J M Totals $ $ $ K=I/J O=M/N Menu Engineering Worksheet Izati"s café 23rd December 2014 Q=(1/no.of item X 70%) Exercise 1. George’s Restaurant had the following menu sales during a period of one week: a. Calculate the menu mix percentage for each menu item. b. Calculate menu contribution margin for the week. c. Calculate menu food cost percentage for the week. Menu Item Sales Food Cost Menu Price StripSteak 73 $6.50 $18.90 FriedChicken 90 $3.90 $12.75 Lamb Chops 55 $7.00 $20.35 FriedScallops 92 $5.90 $18.50 BroiledHaddock 85 $4.50 $15.65 Roast Turkey 92 $3.00 $12.00 BakedStuffedShrimp 77 $6.70 $18.50 Veal Marsala 65 $6.50 $18.75 2. Generate Menu Engineering and analysis a. Complete the Menu Engineering Worksheet reproduced in Figure 11.3, filling in the missing information. b. Prepare a graph similar to Figure 11.2 showing stars, plow horses, puzzles, and dogs. Figure 11.3