1. FIN242 – FUNDAMENTAL OF FINANCE CHAPTER 2: RATIOS
PREPARED BY: HUSNIZAM HOSIN, UITM JOHOR 1
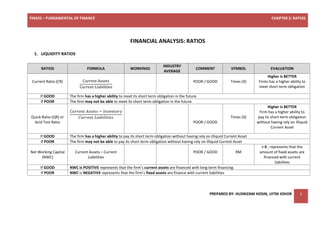
FINANCIAL ANALYSIS: RATIOS
1. LIQUIDITY RATIOS
RATIOS FORMULA WORKINGS
INDUSTRY
AVERAGE
COMMENT SYMBOL EVALUATION
Current Ratio (CR) Current Assets
Current Liabilities
POOR / GOOD Times (X)
Higher is BETTER
Firms has a higher ability to
meet short term obligation
If GOOD The firm has a higher ability to meet its short term obligation in the future
If POOR The firm may not be able to meet its short term obligation in the future
Quick Ratio (QR) or
Acid Test Ratio
𝐶𝑢𝑟𝑟𝑒𝑛𝑡 𝐴𝑠𝑠𝑒𝑡𝑠 − 𝐼𝑛𝑣𝑒𝑛𝑡𝑜𝑟𝑦
𝐶𝑢𝑟𝑟𝑒𝑛𝑡 𝐿𝑖𝑎𝑏𝑖𝑙𝑖𝑡𝑖𝑒𝑠
POOR / GOOD
Times (X)
Higher is BETTER
Firm has a higher ability to
pay its short term obligation
without having rely on illiquid
Current Asset
If GOOD The firm has a higher ability to pay its short term obligation without having rely on illiquid Current Asset
If POOR The firm may not be able to pay its short term obligation without having rely on illiquid Current Asset
Net Working Capital
(NWC)
Current Assets – Current
Liabilities
POOR / GOOD RM
< 0 , represents that the
amount of fixed assets are
financed with current
liabilities
If GOOD NWC is POSITIVE represents that the firm’s current assets are financed with long term financing.
If POOR NWC is NEGATIVE represents that the firm’s fixed assets are finance with current liabilities
2. FIN242 – FUNDAMENTAL OF FINANCE CHAPTER 2: RATIOS
PREPARED BY: HUSNIZAM HOSIN, UITM JOHOR 2
2. ACTIVITY / ASSET MANAGEMENT RATIOS
RATIOS FORMULA WORKINGS
INDUSTRY
AVERAGE
COMMENT SYMBOL EVALUATION
Inventory Turnover
(ITO) or
Inventory Utilization
Ratio
𝐶𝑂𝐺𝑆 @ 𝑁𝑒𝑡 𝑆𝑎𝑙𝑒𝑠
𝐼𝑛𝑣𝑒𝑛𝑡𝑜𝑟𝑦
POOR / GOOD Times (X)
Higher is BETTER
Firms is effectively using its
inventory to generate sales
If GOOD The firms is effectively using its inventory to generate sales
If POOR The firms is ineffectively using its inventory to generate sales and holding excess and unproductive stocks.
Average Collection
Period (ACP)
𝐴𝑐𝑐𝑜𝑢𝑛𝑡 𝑅𝑒𝑐𝑒𝑖𝑣𝑎𝑏𝑙𝑒𝑠
𝑁𝑒𝑡 𝑆𝑎𝑙𝑒𝑠
𝑥 360
POOR / GOOD Days
Lower is BETTER
Firm is good in managing its
credit sales & more cash in
hands
If GOOD (Shorter) The firm is good in managing its credit sales & more cash in hands
If POOR (Longer) The firm is not good in managing its credit sales & less cash in hands
Fixed Assets
Turnover (FATO)
Net Sales
Net Fixed Assets
POOR / GOOD Times (X)
Higher is BETTER
Firm is able to utilize its fixed
assets and good in managing
its assets.
If GOOD The firm is able to utilize its fixed assets and good in managing its assets and more revenues generated per Ringgit of the investment.
If POOR The firm unable to utilize its fixed assets and not good in managing its assets and less revenue generated per Ringgit of the investment.
Total Assets
Turnover (TATO)
Net Sales
Total Assets
POOR / GOOD Times (X)
Higher is BETTER
Firm is able to utilize its
overall assets and good in
managing its assets
If GOOD The firm is able to utilize its overall assets and good in managing its assets.
If POOR The firm is unable to utilize its overall assets and not good in managing its assets.
3. FIN242 – FUNDAMENTAL OF FINANCE CHAPTER 2: RATIOS
PREPARED BY: HUSNIZAM HOSIN, UITM JOHOR 3
3. LEVERAGE / DEBT RATIOS
RATIOS FORMULA WORKINGS
INDUSTRY
AVERAGE
COMMENT SYMBOL EVALUATION
Debt Ratio
(DR)
Long Term Debt
Total Assets
x 100
POOR / GOOD %
Lower is BETTER
Firms is good in managing
its debt & low financial risk
If GOOD (Lower) The firm is good in managing its debt & low financial risk.
If POOR (Higher) The firms is not good in managing its debt & indicates higher financial risk
Debt to Equity Ratio
(DER)
𝐿𝑜𝑛𝑔 𝑇𝑒𝑟𝑚 𝐷𝑒𝑏𝑡
𝑇𝑜𝑡𝑎𝑙 𝐸𝑞𝑢𝑖𝑡𝑖𝑒𝑠 POOR / GOOD Times (X)
< 1, represents that more
funds provided by owners
If MORE THAN 1 It indicates that the creditor provided more funds compared to owners.
If LESS THAN 1 It indicates that more funds provided by owners compared to creditors.
Times Interest
Earned (TIE)
EBIT
Interest
POOR / GOOD Times (X)
Higher is BETTER
Firm is good in meeting
their interest payment
obligation
If GOOD The firm is good in meeting their interest payments obligation and higher capability and lower risks of default.
If POOR The firm is not good in meeting their interest payments obligation and lower capability and higher risks of default.
4. FIN242 – FUNDAMENTAL OF FINANCE CHAPTER 2: RATIOS
PREPARED BY: HUSNIZAM HOSIN, UITM JOHOR 4
4. PROFITABILITY RATIOS
RATIOS FORMULA WORKINGS
INDUSTRY
AVERAGE
COMMENT SYMBOL EVALUATION
Gross Profit Margin
(GPM)
Gross Profit
Net Sales
x 100
POOR / GOOD %
Higher is BETTER
Firm is able to control COGS
relative to its sales revenue
If GOOD The firm is able to control COGS relative to its sales revenue.
If POOR The firm unable to control COGS relative to its sales revenue.
Operating Profit
Margin (OPM)
𝐸𝐵𝐼𝑇
𝑇𝑜𝑡𝑎𝑙 𝑆𝑎𝑙𝑒𝑠
𝑥 100
POOR / GOOD %
Higher is BETTER
Firm is able to provide more
return because the firm is
productively managing its
assets.
If GOOD (Shorter) The firm is able to provide more return because the firm is productively manage its assets
If POOR (Longer) The firm unable to provide more return because the firm is unproductively manage its assets
Net Profit Margin
(NPM)
Earning After Taxes
Net Sales
x 100
POOR / GOOD %
Higher is BETTER
Firm has a better growth
prospect & able to generate
net earnings to shareholders
(earn more ringgit).
If GOOD The firm has a better growth prospect & able to generate net earnings to shareholders (earn more ringgit)
If POOR The firm don’t have a better growth prospect & unable to generate net earnings to shareholders.
5. FIN242 – FUNDAMENTAL OF FINANCE CHAPTER 2: RATIOS
PREPARED BY: HUSNIZAM HOSIN, UITM JOHOR 5
Return On Assets
(ROA)
Earnings After Taxes
Total Assets
𝑥 100
POOR / GOOD
%
Higher is BETTER
Firm is able to control costs
in its operation (assets are
productive) and provide
more return.
If GOOD The firm is able to control costs in its operation (assets are productive) and provide more return.
If POOR The firm is unable to control costs in its operation (assets are productive) and didn’t provide more return.
Return On Equity
(ROE)
Earnings After Taxes
Total Equity
x 100
POOR / GOOD %
Higher is BETTER
Firm is able to maximize the
owner’s wealth
If GOOD The firm is able to maximize the owner’s wealth and give higher return for the owners of the firm.
If POOR The firm is unable to maximize the owner’s wealth and didn’t give higher return for the owners of the firm.
6. FIN242 – FUNDAMENTAL OF FINANCE CHAPTER 2: RATIOS
PREPARED BY: HUSNIZAM HOSIN, UITM JOHOR 6
5. MARKET RATIOS
RATIOS FORMULA WORKINGS
INDUSTRY
AVERAGE
COMMENT SYMBOL EVALUATION
Earnings per Share
(EPS)
Net Income − 𝑃𝑆 𝐷𝑖𝑣
No. of Shares POOR / GOOD RM
Higher is BETTER
Firms is profitable enough
to pay out more money to
its shareholders.
If GOOD The firm is profitable enough to pay out more money to its shareholders.
If POOR The firm is unprofitable enough to pay out more money to its shareholders.
Dividend per Share
(DPS)
Total Dividend
No. of Shares
POOR / GOOD RM
Higher is BETTER
Shows the great way for a
company to signal strong
performance and great
portion of company’s
earnings to its
shareholders.
If GOOD The firm is able to give signal strong performance and great portion of the company’s earnings that is paid out to each shareholders
If POOR The firm unable to give signal strong performance and lower portion of the company’s earnings that is paid to each shareholders.
Dividend Payout
Ratio
(DPR)
Dividend per Share (DPS)
Earnings per Share (EPS)
x 100
Dividend paid
Net Income
x 100
POOR / GOOD
%
Higher is BETTER
How much money a
company is returning to
shareholders versus how
much it is keeping on hand
to reinvest in growth, pay
off debt, or add to cash
reserves (retained
earnings).
7. FIN242 – FUNDAMENTAL OF FINANCE CHAPTER 2: RATIOS
PREPARED BY: HUSNIZAM HOSIN, UITM JOHOR 7
If GOOD The firm is able to pay out all their earnings to shareholders as dividend, while only small pay out portion is retained by the business.
If POOR The firm is unable to pay out all their earnings to shareholders as dividend, but portion remaining retained by the business.
Dividend Yield
(DY)
Dividend per Share (DPS)
Market Price per Share (MPS)
𝑥 100
POOR / GOOD %
Higher is BETTER
Measures the quantum of
cash dividends paid out to
shareholders relative to
the market value per share
If GOOD The firm is able to pays a substantial share of its profits in the form of dividends.
If POOR The firm is unable to pays a substantial share of its profits in the form of dividends..
Price Earnings
Ratio
(PER)
Market Price per Share (MPS)
Earnings per Share (EPS)
POOR / GOOD times
Higher is BETTER
Firm is able to maximize
the owner’s wealth
If GOOD The investors are anticipating higher growth in the future.
If POOR The investors are not anticipating higher growth in the future.
8. FIN242 – FUNDAMENTAL OF FINANCE CHAPTER 2: RATIOS
PREPARED BY: HUSNIZAM HOSIN, UITM JOHOR 8
ITEMS IN CURRENT ASSETS ITEMS IN
FIXED ASSETS
ITEMS IN
CURRENT LIABILITIES
ITEMS IN LONG TERM
LIABILITIES ITEMS IN EQUITIES
1. Cash
2. Cheque or Bank Draft or
other Negotiable
Instruments
3. Deposits
4. Marketable Securities
5. Account Receivable
6. Inventories
7. Prepaid Expenses
8. Prepayment
1. Land
2. Building
3. Motor vehicles
4. Equipment
5. Plant
6. Pattern
7. Goodwill
1. Account payable
2. Tax payable
3. Tax accrual
4. Accrued Expenses
5. Short Term Debt
6. Accounts Liabilities
7. Notes payable
8. Short term borrowing
1. Long term debt
2. Mortgage
3. Bonds
4. Leases
5. Debentures
1. Retained Earnings
2. Paid in capital
3. Common shares
4. Preferred Shares
5. Shareholders’ Equity