Enhancing and Restoring Safety & Quality Cultures - Dave Litwiller - May 2024...
Tata Multicap Fund - Draft NFO Presentation.pdf
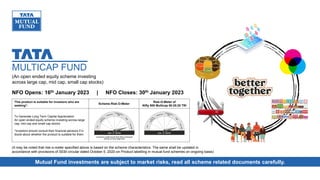
1. NFO Opens: 16th January 2023 | NFO Closes: 30th January 2023
(An open ended equity scheme investing
across large cap, mid cap, small cap stocks)
(It may be noted that risk-o-meter specified above is based on the scheme characteristics. The same shall be updated in
accordance with provisions of SEBI circular dated October 5, 2020 on Product labelling in mutual fund schemes on ongoing basis)
This product is suitable for investors who are
seeking*:
Scheme Risk-O-Meter
Risk-O-Meter of
Nifty 500 Multicap 50:25:25 TRI
To Generate Long Term Capital Appreciation
An open ended equity scheme investing across large
cap, mid cap and small cap stocks
*Investors should consult their financial advisors if in
doubt about whether the product is suitable for them
Mutual Fund investments are subject to market risks, read all scheme related documents carefully.
MULTICAP FUND
2. Its hard to Imagine...
2
Looking for masalas in different
boxes while cooking?
Going to multiple markets to buy
monthly groceries
Searching for tools on the go?
Carrying a calculator,
camera everyday?
A family with just adults? A world with only reds?
4. Combinations all around us
4
A Masala Box makes
cooking easier
Supermarkets are one
stop shops
A swiss knife acts as multiple
tools in one
A cell phone brings together
multiple devices
Each generation adds a new
layer to a family
The three base colours combine
to create the world around us
6. The Bronze Age: The Big Leap For Humans
6
3300 BC to 1200 BC
WHAT IS THE HARDNESS OF A COMBINATION TIN & COPPER?
Tin Copper
Softest Hardest
Hardness of Metals
(On Mohs Scale of 1 to 10)
1.5 3 10
1
7. The Bronze Age: The Big Leap For Humans
7
3300 BC to 1200 BC
Tin Copper
1.5 + 3
Bronze
Softest Hardest
1.5 3 4.5 6 10
1
Two soft metals combined to make a metal hard
enough to make tools and weapons
Hardness of Metals
(On Mohs Scale of 1 to 10)
8. 8
THERE ARE SO MANY
POSSIBLE COMBINATIONS
FOR INVESTMENTS
Which
Themes?
Which
Sectors?
Which
Market Cap?
Value or
Growth?
Or GARP?
Top Down?
Bottom
Up?
10. If You Picked The Previous Winning Segment Each Year?
Source: NSE 10
CY12 CY13 CY14 CY15 CY16 CY17 CY18 CY19 CY20 CY21
44% 6% 70% 10% 5% 57% 1% 10% 25% 62%
38% -3% 60% 8% 4% 54% -13% 0% 24% 47%
31% -8% 33% –2% 0% 31% -27% -8% 15% 25%
Your selection would have been the top performer thrice over ten years
Your selection would have been the worst performer four times over ten years
100 97
129 142 143
220
161 178
205
331
0
100
200
300
400
CY12 CY13 CY14 CY15 CY16 CY17 CY18 CY19 CY20 CY21
Value of investment of Rs 100
Best performing
Nifty 100 Nifty Midcap 150 Nifty Smallcap 250
11. If You Picked The Previous Losing Segment Each Year?
Source: NSE 11
CY12 CY13 CY14 CY15 CY16 CY17 CY18 CY19 CY20 CY21
44% 6% 70% 10% 5% 57% 1% 10% 25% 62%
38% -3% 60% 8% 4% 54% -13% 0% 24% 47%
31% -8% 33% –2% 0% 31% -27% -8% 15% 25%
Your selection would have been the top performer five times over ten years
Your selection would have been the worst performer thrice over ten years
Nifty 100 Nifty Midcap 150 Nifty Smallcap 250
100
106
181 176 183
287 290
266
333
417
0
100
200
300
400
500
CY12 CY13 CY14 CY15 CY16 CY17 CY18 CY19 CY20 CY21
Value of investment of Rs 100
worst performing
12. “A Whole is Greater Than the Sum of Its Parts”
Composite constructed in a 40:35:25 ratio of Largecaps:Midcaps:Smallcaps | For illustration purposes only|
The portfolio may or may not be managed in a similar manner | Source: NSE 12
A composite would have been the worst or top performer zero times over ten years
But your investment journey would have been much smoother
CY12 CY13 CY14 CY15 CY16 CY17 CY18 CY19 CY20 CY21
44% 6% 70% 10% 5% 57% 1% 10% 25% 62%
38% 0% 60% 8% 4% 54% –12% 2% 24% 47%
37% -3% 50% 5% 3% 47% -13% 0% 21% 42%
31% -8% 33% -2% 0% 31% -27% -8% 15% 25%
Nifty 100 Nifty Midcap 150 Nifty Smallcap 250 Composite
13. A Combination gives you a smoother path
Composite constructed in a 40:35:25 ratio of Largecaps:Midcaps:Smallcaps | For illustration purposes only|
The portfolio may or may not be managed in a similar manner | Source: NSE 13
A composite combines the best of each segment, resulting in potentially a more stable portfolio
100 97
129
142 143
220
161
178
205
331
100 106
181 176 183
287 290
266
333
417
100 100
150 157 162
237
208 212
256
362
0
50
100
150
200
250
300
350
400
450
CY12 CY13 CY14 CY15 CY16 CY17 CY18 CY19 CY20 CY21
Value of investment of Rs 100
Best performing worst performing Composite
15. 1st to 100th
by Market Cap
LARGE CAPS
101st to 250th
by Market Cap
MID CAPS
251st onwards
by Market Cap
SMALL CAPS
Each Market Cap Contains Something Different
Source: NSE 15
Description
Mature businesses with
proven track record
Less Volatile compared to
Mid and Small Caps
Emerging companies in High
growth phase
Scalable Business Models
Niche businesses
Potential multi-baggers
16. Higher liquidity in a segment can
provide stability to the portfolio
while lower liquidity provides alpha
generation opportunities
Liquidity
Sector allocation is varied
across Market Caps
Sector Exposure
Value and Growth opportunities
are present across Market Caps
Valuation
Each Market Cap has Different Characteristics
Source: NSE 16
Key Characteristics
Index
Rs Lakh Cr
Total Free
Float
Market
Cap
Average
Free Float
Market
Cap
NIFTY 100 180.35 1.80
NIFTY MIDCAP 150 42.39 0.28
NIFTY SMALLCAP 250 21.24 0.08
KEY SECTORS
NIFTY 100
Financial Services, IT, Oil
& Gas, FMCG
NIFTY MIDCAP 150
Financial Services,
Capital Goods,
Healthcare, Automobile &
Auto Components
NIFTY SMALLCAP 250
Financial Services,
Capital Goods,
Healthcare, Chemicals
Index
Trailing
P/E
P/B
NIFTY 100 22.07 4.38
NIFTY MIDCAP 150 24.45 3.32
NIFTY SMALLCAP 250 19.05 2.99
17. Each Market Cap Adds Something Different
Source: NSE 17
Weight allocation to sectors is different for each market cap
0 25 50 75 100
NIFTY 100
NIFTY MIDCAP 150
NIFTY SMALLCAP 250
Capital Goods Chemicals Construction Construction Materials Consumer Durables
Automobile and Auto Components
Consumer Services Diversified Fast Moving Consumer Goods Financial Services Forest Materials
Healthcare Information Technology Media, Entertainment & Publication Oil, Gas & Consumable Fuels Power
Metals & Mining
Realty Services Telecommunication Textiles
18. Each Market Cap Adds Something Unique
• Electrodes
• Copper
• Sanitary Ware
• Petrochemicals
• Refractories
• Education
• Carbon Black
• Digital Entertainment
• Pharmacy Retail
• Dyes And Pigments
• Industrial Minerals
• Trading – Gas
• Sugar
• Shipping
• Packaging
• Lubricants
• Industrial Machinery
• Household Products
• Civil Construction
… And More
Source: NSE 18
Unique basic industries across Market Caps
• Castings & Forgings
• Other Beverages
• Commercial Vehicles
• Edible Oil
• Diesel Engines
• Fastener
• Explosives
• Airport & Airport services
• Industrial Electronics
• Healthcare Research,
Analytics & Technology
• Zinc
• Tractors
• Industrial Gases
• Dairy Products
• Diversified FMCG
• Power - Transmission
• Trading - Minerals
• Coal
• Diversified Metals
Nifty 100 Nifty Midcap 150 Nifty Smallcap 250
24. MULTI – STYLE INVESTING
FOR AN ALL WEATHER PORTFOLIO
Internally developed strategy subject to change with change in market conditions 24
Earnings Stability
Earnings Upgrades
Earnings Turnaround
Well rounded investment strategy
Combination of investment ideas across earnings cycle
Portfolio construct flexible in terms of market cap
Each segment plays a role in optimizing risk-return trade-off
Diversified portfolio
25. MULTI – STYLE INVESTING
EARNINGS STABILITY
Internally developed strategy subject to change with change in market conditions 25
Earnings Stability
Earnings Upgrades
Earnings Turnaround
Earnings Stability Segment Characteristics
Purpose Aim deliver consistent profits and returns
Portfolio Construction Focus on high liquidity stocks
Selection Criteria Relatively predictable, sustainable, Low risk business model
26. Multi – Style Investing
Earnings Turnaround
Internally developed strategy subject to change with change in market conditions 26
Earnings Turnaround Segment Characteristics
Purpose Potentially generate disproportionate returns but at higher risk
Selection Criteria
Cases where companies or sectors have gone through challenges
and dislocation leading to depressed earnings and valuation
Downturn could be company-specific (leverage, capex) or industry
level cyclical
Turnaround Potential
• Correction in the industry scenario
• Company level management change or shift in strategy
Earnings Stability
Earnings Upgrades
Earnings Turnaround
27. MULTI – STYLE INVESTING
EARNINGS UPGRADE
Internally developed strategy subject to change with change in market conditions 27
Earnings Stability
Earnings Upgrades
Earnings Turnaround
Earnings Upgrades Segment Characteristics
Purpose
Aim to enhance returns through positive earning surprises and
valuation re-rating
Selection Criteria
Visible corrective actions by the company or in industry structure
Companies in which profit growth is expected to deliver positive
surprise in a ~12-18 month period.
28. Growth at Reasonable Price
Internally developed strategy subject to change with change in market conditions 28
DEEP VALUE
Valuation is right, timing
may or may not be
Our
Philosophy
Value with triggers
• At multi-year valuation discount
• In early stages of improving outlook
Thematic
• Change in sector
dynamics
• Macro tailwinds
Upgrade cycle
• Upgrade cycle vs.
consensus
• Valuation re-rating +
earning upgrades
GROWTH AT ANY PRICE
Typically associated with
high perceived quality
29. Fund Details
29
Scheme Name TATA MULTICAP FUND
NFO Date 16th January 2023 to 30th January 2023
Investment Objective
The investment objective of the scheme is to generate long-term capital appreciation from a portfolio of equity and
equity related securities across market capitalization. However, there is no assurance or guarantee that the
investment objective of the Scheme will be achieved. The scheme does not assure or guarantee any returns.
Type Of Scheme An open ended equity scheme investing across large cap, mid cap, small cap stocks
Fund Manager Rahul Singh and Tejas Gutka
Benchmark Nifty 500 Multicap 50:25:25 TRI
Min. Investment Amount (During NFO) Rs. 5,000/- and in multiple of Re.1/- thereafter
Load Structure
Entry Load: N.A.
Exit Load: Redemption/Switch-out/SWP/STP on or before expiry of 365 days from the date of allotment: If the
withdrawal
amount or switched out amount is not more than 12% of the original cost of investment-NIL
Redemption/Switch-out/SWP/STP on or before expiry of 365 days from the date of allotment: If the withdrawal
amount or switched out amount is more than 12% of the original cost of investment-1%
Redemption/Switch-out/SWP/STP after expiry of 365 days from the date of allotment-NIL
30. 30
Mutual Fund Investments are subject to market risks, read all scheme related documents carefully
This product is suitable for investors who are seeking*:
• To Generate Long Term Capital Appreciation
• An open ended equity scheme investing across large cap, mid cap
and small cap stocks
*Investors should consult their financial advisors if in doubt about
whether the product is suitable for them
TATA MULTICAP FUND
Fund
Risk-o-meter
Benchmark
Risk-o-meter
Distributed by: