SlideShare ist ein Scribd-Unternehmen logo
1 von 1
Collect data from US Census
2000 and 2010 and American
Community Survey from 2010
to 2014
Gather population, age
groups, and incomes from
these sources
Find trends by comparing
data between years
Hillsborough Community Profile
Adam DiSarro, Intern
David K. Maski, Preceptor
Purpose
• Compile relevant economic and
demographic data
• Compare Hillsborough to county
and surrounding municipalities
• Prepare for future trends
Significance
• Region changes constantly,
sometimes unexpectedly
• Housing and commuting
preferences change along with
job locations
Methodology Outcomes
• Population continues to slowly
grow and median age continues
to increase
• Population of 45 years and older
increased by about 44 percent
from 2000 to 2010
• Population 44 years and younger
decreased by about 14 percent
from 2000 to 2010
Conclusions
Population has slowly gained
while median age has significantly
climbed. Much land remains
undeveloped but not preserved.
Infrastructure and facilities need to
accommodate future changes.
Acknowledgements
Special thanks to Planning Director David K. Maski,
Internship Coordinator Ann Marie Hill, IT Instructor
Tamara Swedberg, Hillsborough Township
Administrator Anthony Ferrera, and the entire
Township Planning and Zoning Office
0
2000
4000
6000
8000
10000
12000
14000
16000
0 to 19 20 to 44 45 to 64 65+
2000
2010
Population Aging – 2000 to 2010
0
10000
20000
30000
40000
50000
60000
US Census
Population
Estimate:
1930-2010
NJTPA
Projection
data
Population Growth – 1930 to 2040
Background: Hillsborough Township preserved farmland photo by Adam DiSarro
Hillsborough Municipal Building
serves as the site of my summer
internship at the Planning and Zoning
Department. Photo by Adam DiSarro.

Weitere ähnliche Inhalte

Ähnlich wie postersession_adamdisarro

DMPED DCHA EcoDistricts session 2014
DMPED DCHA EcoDistricts session 2014DMPED DCHA EcoDistricts session 2014
DMPED DCHA EcoDistricts session 2014Reyna Alorro
 
Poverty mary wiley_2015-05-01 good15 knowledge session data & poverty master
Poverty mary wiley_2015-05-01 good15 knowledge session data & poverty masterPoverty mary wiley_2015-05-01 good15 knowledge session data & poverty master
Poverty mary wiley_2015-05-01 good15 knowledge session data & poverty masterGO Open Data (GOOD)
 
10/13/16 Breakout Session II Defining and Designing Collective Placemaking Im...
10/13/16 Breakout Session II Defining and Designing Collective Placemaking Im...10/13/16 Breakout Session II Defining and Designing Collective Placemaking Im...
10/13/16 Breakout Session II Defining and Designing Collective Placemaking Im...RUPRI
 
The economic contributions of immigrants in minnesota
The economic contributions of immigrants in minnesotaThe economic contributions of immigrants in minnesota
The economic contributions of immigrants in minnesotaMinnesota Chamber of Commerce
 
Ontario East - Newcomer and Youth Community Indicators tool
Ontario East - Newcomer and Youth Community Indicators toolOntario East - Newcomer and Youth Community Indicators tool
Ontario East - Newcomer and Youth Community Indicators toolStephen Morris Ec.D.
 
Work-based Learning as a Lever for Economic and Workforce Development
Work-based Learning as a Lever for Economic and Workforce DevelopmentWork-based Learning as a Lever for Economic and Workforce Development
Work-based Learning as a Lever for Economic and Workforce DevelopmentBlack Hawk Economic Development
 
12 9-21 • Imagine Housing Fireside Chat Presentation
12 9-21 • Imagine Housing Fireside Chat Presentation12 9-21 • Imagine Housing Fireside Chat Presentation
12 9-21 • Imagine Housing Fireside Chat PresentationImagine Housing
 
Importance of Demographic Data to Local Governments
Importance of Demographic Data to Local GovernmentsImportance of Demographic Data to Local Governments
Importance of Demographic Data to Local GovernmentsJim Flick
 
Brockville Welcomes Cultural Diversity
Brockville Welcomes Cultural DiversityBrockville Welcomes Cultural Diversity
Brockville Welcomes Cultural DiversityBrockville Ontario
 
Newcomer and Youth Community Indicator Tool - AMO presentation
Newcomer and Youth Community Indicator Tool - AMO presentationNewcomer and Youth Community Indicator Tool - AMO presentation
Newcomer and Youth Community Indicator Tool - AMO presentationStephen Morris Ec.D.
 
Introducing PLANiTULSA, a presentation by John Fregonese
Introducing PLANiTULSA, a presentation by John FregoneseIntroducing PLANiTULSA, a presentation by John Fregonese
Introducing PLANiTULSA, a presentation by John FregoneseJanet Tharp
 
Economic Impact of Illinois Community Colleges
Economic Impact of Illinois Community CollegesEconomic Impact of Illinois Community Colleges
Economic Impact of Illinois Community CollegesIllinois workNet
 
FinalPresentation._JinheeLee
FinalPresentation._JinheeLeeFinalPresentation._JinheeLee
FinalPresentation._JinheeLeeJinhee Lee
 
Fcar presentation 1 Oct 2015
Fcar presentation 1 Oct 2015Fcar presentation 1 Oct 2015
Fcar presentation 1 Oct 2015FCARMD
 

Ähnlich wie postersession_adamdisarro (20)

DMPED DCHA EcoDistricts session 2014
DMPED DCHA EcoDistricts session 2014DMPED DCHA EcoDistricts session 2014
DMPED DCHA EcoDistricts session 2014
 
Poverty mary wiley_2015-05-01 good15 knowledge session data & poverty master
Poverty mary wiley_2015-05-01 good15 knowledge session data & poverty masterPoverty mary wiley_2015-05-01 good15 knowledge session data & poverty master
Poverty mary wiley_2015-05-01 good15 knowledge session data & poverty master
 
Good Enough is No Longer Good Enough
Good Enough is No Longer Good EnoughGood Enough is No Longer Good Enough
Good Enough is No Longer Good Enough
 
Steuben County Snapshot
Steuben County SnapshotSteuben County Snapshot
Steuben County Snapshot
 
10/13/16 Breakout Session II Defining and Designing Collective Placemaking Im...
10/13/16 Breakout Session II Defining and Designing Collective Placemaking Im...10/13/16 Breakout Session II Defining and Designing Collective Placemaking Im...
10/13/16 Breakout Session II Defining and Designing Collective Placemaking Im...
 
Elizabeth Garner - Colorado State Demographer
Elizabeth Garner - Colorado State DemographerElizabeth Garner - Colorado State Demographer
Elizabeth Garner - Colorado State Demographer
 
The economic contributions of immigrants in minnesota
The economic contributions of immigrants in minnesotaThe economic contributions of immigrants in minnesota
The economic contributions of immigrants in minnesota
 
Ontario East - Newcomer and Youth Community Indicators tool
Ontario East - Newcomer and Youth Community Indicators toolOntario East - Newcomer and Youth Community Indicators tool
Ontario East - Newcomer and Youth Community Indicators tool
 
Work-based Learning as a Lever for Economic and Workforce Development
Work-based Learning as a Lever for Economic and Workforce DevelopmentWork-based Learning as a Lever for Economic and Workforce Development
Work-based Learning as a Lever for Economic and Workforce Development
 
12 9-21 • Imagine Housing Fireside Chat Presentation
12 9-21 • Imagine Housing Fireside Chat Presentation12 9-21 • Imagine Housing Fireside Chat Presentation
12 9-21 • Imagine Housing Fireside Chat Presentation
 
The Avenues
The AvenuesThe Avenues
The Avenues
 
2040 Socioeconomic Study - VLMPO Presentation
2040 Socioeconomic Study - VLMPO Presentation2040 Socioeconomic Study - VLMPO Presentation
2040 Socioeconomic Study - VLMPO Presentation
 
Importance of Demographic Data to Local Governments
Importance of Demographic Data to Local GovernmentsImportance of Demographic Data to Local Governments
Importance of Demographic Data to Local Governments
 
Brockville Welcomes Cultural Diversity
Brockville Welcomes Cultural DiversityBrockville Welcomes Cultural Diversity
Brockville Welcomes Cultural Diversity
 
Newcomer and Youth Community Indicator Tool - AMO presentation
Newcomer and Youth Community Indicator Tool - AMO presentationNewcomer and Youth Community Indicator Tool - AMO presentation
Newcomer and Youth Community Indicator Tool - AMO presentation
 
Introducing PLANiTULSA, a presentation by John Fregonese
Introducing PLANiTULSA, a presentation by John FregoneseIntroducing PLANiTULSA, a presentation by John Fregonese
Introducing PLANiTULSA, a presentation by John Fregonese
 
Economic Impact of Illinois Community Colleges
Economic Impact of Illinois Community CollegesEconomic Impact of Illinois Community Colleges
Economic Impact of Illinois Community Colleges
 
FinalPresentation._JinheeLee
FinalPresentation._JinheeLeeFinalPresentation._JinheeLee
FinalPresentation._JinheeLee
 
Marion County Data Snapshot
Marion County Data SnapshotMarion County Data Snapshot
Marion County Data Snapshot
 
Fcar presentation 1 Oct 2015
Fcar presentation 1 Oct 2015Fcar presentation 1 Oct 2015
Fcar presentation 1 Oct 2015
 

postersession_adamdisarro

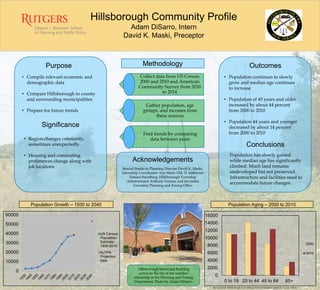
  • 1. Collect data from US Census 2000 and 2010 and American Community Survey from 2010 to 2014 Gather population, age groups, and incomes from these sources Find trends by comparing data between years Hillsborough Community Profile Adam DiSarro, Intern David K. Maski, Preceptor Purpose • Compile relevant economic and demographic data • Compare Hillsborough to county and surrounding municipalities • Prepare for future trends Significance • Region changes constantly, sometimes unexpectedly • Housing and commuting preferences change along with job locations Methodology Outcomes • Population continues to slowly grow and median age continues to increase • Population of 45 years and older increased by about 44 percent from 2000 to 2010 • Population 44 years and younger decreased by about 14 percent from 2000 to 2010 Conclusions Population has slowly gained while median age has significantly climbed. Much land remains undeveloped but not preserved. Infrastructure and facilities need to accommodate future changes. Acknowledgements Special thanks to Planning Director David K. Maski, Internship Coordinator Ann Marie Hill, IT Instructor Tamara Swedberg, Hillsborough Township Administrator Anthony Ferrera, and the entire Township Planning and Zoning Office 0 2000 4000 6000 8000 10000 12000 14000 16000 0 to 19 20 to 44 45 to 64 65+ 2000 2010 Population Aging – 2000 to 2010 0 10000 20000 30000 40000 50000 60000 US Census Population Estimate: 1930-2010 NJTPA Projection data Population Growth – 1930 to 2040 Background: Hillsborough Township preserved farmland photo by Adam DiSarro Hillsborough Municipal Building serves as the site of my summer internship at the Planning and Zoning Department. Photo by Adam DiSarro.