

Empfohlen
Empfohlen
Weitere ähnliche Inhalte
Was ist angesagt?
Was ist angesagt? (20)
Ähnlich wie ITbuzz introduction Slides
Ähnlich wie ITbuzz introduction Slides (20)
Mehr von Computer Aid, Inc
Mehr von Computer Aid, Inc (20)
Kürzlich hochgeladen
Kürzlich hochgeladen (20)
ITbuzz introduction Slides
- 2. Agenda • Introduction • Introduce APO – What will I as the PMO mgr / VP of IT get from APO? • Pepsi Challenges – How will it make my people – Consolidating IT Orgs more productive? – Lack qualified PMs – Dashboards today yield surprises • Demonstration – Need for better PM – High level – Discuss reasons and – Drill down as / if impact appropriate • Capabilities needed? • Next steps – – –
- 3. Origins Need – We were beginning to make mistakes – Quickly needed to get a communications, visibility, and enforcement system in place Solution – Internal solution: Automated Project Office (APO) – Virtual implementation of Management by Walking Around Valued by clients – Commercialization of APO – Created ITBuzz (greater need beyond projects)
- 4. Management by walking around 1. Managers can clearly communicate what needs to be done 2. Spot early warning signs before projects fail 3. Managers can ensure best practices are followed and critical steps are not overlooked
- 5. Effects of MBWA 100% 90% Morale Performance 80% Time on task 70% 60% 50% Never/Rarely 1-2 Times/Month Weekly Regularly Finding: Managers who more frequently engaged their teams were re- evaluating decisions and reprioritizing risks/issues earlier in the project.
- 6. The ITBuzz difference… Know what is in need of attention Apply the knowledge of your best people All activities are visible in a central repository Accurate data to make correct decisions
- 7. What is ITBuzz? Seven Domains Portfolio Service Management Delivery IT Service HealthCheck Management Project Management (APO) Process Capability Issue Management Management Improvement Results Management Powered by
- 8. ITBuzz in the AMI framework ITBuzz Suite Client Specific Solutions Portfolio Management Service Management AMI IT HealthCheck App … … Supply Chain Store Drug Trial Wellness APO Advanced Management Insight (AMI) Q&A Knowledge Data Control Engine & Dashboard AMI Repository Feeds Room Scheduler Frame work Application Authoring Powered by
- 9. Demonstration Click Here to Launch
- 10. How we collect “soft” data and communicate what needs to be done Role based Rule Based Electronic checklists Weekly assessments 10
- 11. ITBuzz delivers the numbers Cut reporting effort up to 2 hours per person/week and 10 hours per project manager / week Reduce rework by up to 40% Improve productivity by up to 30%
- 12. Summary Control room Process data against rules and best practices Gathers and filters data from each of the domain areas A completely integrated system
- 13. Dave Smith Product Manager Dave_smith@compaid.com www.CAIBuzz.com
- 15. Portfolio Management – Master List 15
- 16. Portfolio Management - Backlog 16
- 17. Portfolio Management - Validation 17
- 18. Portfolio Management – Resource Load 18
- 19. Portfolio Management – Budgetary Plan 19
- 20. Predictive Analytics 20
- 21. Stage Gating 21
- 22. Scorecards 22
- 23. Other Dashboards Providing Visibility 23
- 24. With Drill Down Capability 24
Hinweis der Redaktion
- PerformancePerformance becomes increasingly standard as expectations are communicated and re-enforced more often
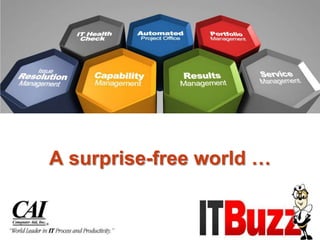
- Buzz identifies five IT management domains, shown here:Portfolio Management. This establishes standard criteria for evaluating proposals making it easier to compare projects on an apples-to-apples basis. It ensures that all work is authorized, valuable, aligned, and balanced. Project Management. Ensures that the project’s cost, scope, schedule and risk profile are fully developed, documented and agreed upon by all stakeholders before development starts. You can verify that the project plan is feasible from the point of view of the team charged with the work. Service Management. Service Management provides oversight of the IT products and services deployed to support the day-to-day operations of your business. It monitors performance, stability, conformance to service level commitments, fit-for-purpose and helps track end user satisfaction.Capability Management. Leverage experience on concluded projects to refine your formal processes for future projects. This includes processes for estimating the work required, managing the risks, controlling scope, handling communications. Results Management. Find out how your projects performed. Did you deliver on time and on budget? Did you deliver all the functionality that was expected? Did the project result in a high quality solution? These five domains form two closed (feedback) loops: <click> one for service delivery and <click> one for process improvement with Project Management (the original APO) lying at the conjunction of the two.
- RPL – Rework Prevention LevelSMART – Clarity of Task Assignments (Specific, Measurable, Accountable, Relevant, Timely)SMPL – Senior Management Participation LevelPAL – Process Adherence Level
- RPL – Rework Prevention LevelSMART – Clarity of Task Assignments (Specific, Measurable, Accountable, Relevant, Timely)SMPL – Senior Management Participation LevelPAL – Process Adherence Level
- RPL – Rework Prevention LevelSMART – Clarity of Task Assignments (Specific, Measurable, Accountable, Relevant, Timely)SMPL – Senior Management Participation LevelPAL – Process Adherence Level
- RPL – Rework Prevention LevelSMART – Clarity of Task Assignments (Specific, Measurable, Accountable, Relevant, Timely)SMPL – Senior Management Participation LevelPAL – Process Adherence Level
- RPL – Rework Prevention LevelSMART – Clarity of Task Assignments (Specific, Measurable, Accountable, Relevant, Timely)SMPL – Senior Management Participation LevelPAL – Process Adherence Level
- RPL – Rework Prevention LevelSMART – Clarity of Task Assignments (Specific, Measurable, Accountable, Relevant, Timely)SMPL – Senior Management Participation LevelPAL – Process Adherence Level
- The soft and hard data behind the dashboards. This is an example of the virtual MBWA data collected.We can look at this by project, organization, portfolio of projects…… all the way down to the person.