
Empfohlen
Empfohlen
Weitere ähnliche Inhalte
Empfohlen
Empfohlen (20)
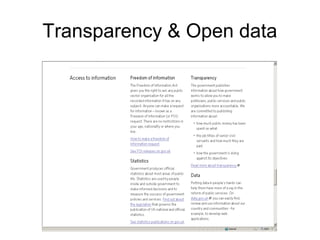
Transparency & open data
- 1. Transparency & Open data
- 2. Data.gov.uk
- 3. Apps can be developed using open data
- 5. Open data in machine readable format
- 7. How your money is spent
Hinweis der Redaktion
- Accident Black Spots in England 2010 This series of embeddable maps plots accident rates per thousand registered vehicles in England using 2010 data from The Department of Transport. Weather Chart charts are produced from data supplied by the UK Met Office, and updated hourly. The Interactive UK Energy Consumption Guide This interactive guide provides viewers with relevant data from the 2011 Energy Consumption in the UK report from the Department of Energy and Climate Change. Numberhood The Numberhood app for iPhone and iPad shows how your local area fares on the important issues – the economy, unemployment, education, health, crime, housing and community strength.