Weitere ähnliche Inhalte
Ähnlich wie Array_nmeth.3507
Ähnlich wie Array_nmeth.3507 (20)
Array_nmeth.3507
- 1. ©2015NatureAmerica,Inc.Allrightsreserved.
Articles
nature methods | ADVANCE ONLINE PUBLICATION |
Induced pluripotent stem cells (iPSCs) are an essential
tool for modeling how causal genetic variants impact
cellular function in disease, as well as an emerging source
of tissue for regenerative medicine. The preparation of
somatic cells, their reprogramming and the subsequent
verification of iPSC pluripotency are laborious, manual
processes limiting the scale and reproducibility of this
technology. Here we describe a modular, robotic platform for
iPSC reprogramming enabling automated, high-throughput
conversion of skin biopsies into iPSCs and differentiated
cells with minimal manual intervention. We demonstrate
that automated reprogramming and the pooled selection of
polyclonal pluripotent cells results in high-quality, stable
iPSCs. These lines display less line-to-line variation than
either manually produced lines or lines produced through
automation followed by single-colony subcloning. The robotic
platform we describe will enable the application of iPSCs to
population-scale biomedical problems including the study
of complex genetic diseases and the development of
personalized medicines.
The reprogramming of somatic cells into iPSCs and the devel-
opment of methods for directing stem cell differentiation into
relevant cell types offers an unprecedented opportunity to study
the cellular phenotypes that underlie disease1,2. The study of these
emerging disease models has led to new mechanistic insights into
a wide variety of disease conditions3.
Automated, high-throughput derivation,
characterization and differentiation of induced
pluripotent stem cells
Daniel Paull1,10, Ana Sevilla1,10, Hongyan Zhou1,10, Aana Kim Hahn1,10, Hesed Kim1,10,
Christopher Napolitano1,10, Alexander Tsankov2–4, Linshan Shang1, Katie Krumholz1, Premlatha Jagadeesan1,
Chris M Woodard1, Bruce Sun1, Thierry Vilboux5,6, Matthew Zimmer1, Eliana Forero1,
Dorota N Moroziewicz1, Hector Martinez1, May Christine V Malicdan5, Keren A Weiss1,9, Lauren B Vensand1,
Carmen R Dusenberry1, Hannah Polus1, Karla Therese L Sy1, David J Kahler1,9, William A Gahl5,7,
Susan L Solomon1, Stephen Chang1, Alexander Meissner2–4, Kevin Eggan2–4,8 Scott A Noggle1
Despite these opportunities, several limitations remain.
Variation between iPSCs can affect functional properties in dis-
ease modeling. To date, most reports have relied on studying a
small number of iPSCs derived from individuals harboring highly
penetrant genetic variants. If stem cells are to facilitate studying
important but common genetic variants of modest effect size4,
minimizing biological and technical variance will be essential.
Furthermore, many differentiation protocols have been optimized
using a small number of cell lines and replicating these proto-
cols across multiple lines has proven challenging5. Solving these
problems could improve experimental power for resolving the
phenotypic contribution to a given genetic variant.
A number of factors have been reported to influence the effi-
ciency of reprogramming and the performance of iPSCs, includ-
ing genetic background, tissue source6, reprogramming factor
stoichiometry7 and culture-related stress8. Furthermore, a lack of
standardization in methodology between laboratories likely intro-
duces further variability9. While previous work has automated the
expansion of individual lines10–13, we reasoned that developing a
fully automated, modular platform for parallel iPSC derivation,
expansion and differentiation would allow us to identify, and
minimize, factors contributing to variability in iPSC behavior as
well as provide a platform for large-scale in vitro iPSC studies.
Here we report the development of liquid-handling plat-
forms that automate the process of deriving, characterizing and
differentiating iPSCs. We have systematically explored several
factors reported to be important sources of variance in the
1The New York Stem Cell Foundation Research Institute, New York, New York, USA. 2The Broad Institute, Cambridge, Massachusetts, USA. 3The Harvard Stem Cell Institute,
Harvard University, Cambridge, Massachusetts, USA. 4Department of Stem Cell and Regenerative Biology, Harvard University, Cambridge, Massachusetts, USA.
5Section on Human Biochemical Genetics, Medical Genetics Branch, National Human Genome Research Institute, National Institutes of Health, Bethesda, Maryland,
USA. 6Division of Medical Genomics, Inova Translational Medicine Institute, Inova Health System, Falls Church, Virginia, USA. 7NIH Undiagnosed Diseases Program,
Common Fund, Office of the Director, National Institute of Health and National Human Genome Research Institute, National Institute of Health, Bethesda, Maryland,
USA. 8The Howard Hughes Medical Institute, Cambridge, Massachusetts, USA. 9Present addresses: New York University School of Medicine, RNAi High Throughput
Screening Core, New York, New York, USA (D.J.K.); Department of Cell Molecular Therapies, Royal Prince Alfred Hospital, Camperdown, New South Wales, Australia
(K.A.W.). 10These authors contributed equally to this work. Correspondence should be addressed to D.P. (dpaull@nyscf.org) or S.A.N. (snoggle@nyscf.org).
Received 25 September 2014; accepted 25 June 2015; published online 3 august 2015; doi:10.1038/nmeth.3507
- 2. ©2015NatureAmerica,Inc.Allrightsreserved.
| ADVANCE ONLINE PUBLICATION | nature methods
Articles
reprogramming process. We found that automated reprogram-
ming using isolation of polyclonal, pooled populations of iPSCs
through cell-surface antigen expression, rather than clonal colony
growth, can give rise to bona fide iPSCs expressing established
pluripotency markers and retaining a stable karyotype. Upon dif-
ferentiation, the lines showed a substantially lower variance in
gene expression than are seen in manually derived lines, with
continued culturing not affecting their differentiation capabil-
ity. Overall this system enables the high-throughput production,
maintenance and differentiation of iPSCs required for large-scale
in vitro iPSC studies.
RESULTS
System overview
Central iPSC derivation hubs may be optimal for a seamless con-
nection between biological or clinical donor samples and end
user scientists performing large-scale in vitro phenotypic assays
(Fig. 1a). We describe the construction of a modular, auto-
mated derivation hub composed of eight robotic instruments
(Supplementary Figs. 1 and 2a,b, Supplementary Videos 1–6).
Two distinct modules were used for fibroblast derivation and bio-
hazard screening, operating under quarantine conditions. Two
further interconnected clusters, each composed of three individ-
ual liquid-handling systems, automated incubators, centrifuges
and microscopes connected through two central robotic arms,
were used for all subsequent steps of iPSC production. A detailed
description of these clusters can be found in the Online Methods,
and a visual guide of the workflow is available (Supplementary
Fig. 1). Our system uses standard tissue culture plates to derive,
quality-control (QC), expand, and cryopreserve low-passage
fibroblasts and iPSCs with standard liquid-handling instruments
and associated technology.
Automated fibroblast production
We generated a genetically diverse bank of fibroblasts from
donated biopsies using liquid-handling automation. Mycoplasma-
free biopsy outgrowths were measured every 5 d using automated
image acquisition and quantification (Supplementary Fig. 2c–e)
and were enzymatically passaged using automation. As increased
population doublings have been shown to decrease reprogram-
ming potential14, fibroblasts were banked in an automated −80 °C
freezer as low-passage (P2) stocks for reprogramming, with
backup stocks stored in liquid nitrogen. The average number of
cells frozen in a cryovial was 121,437 cells, which upon manual
thawing and counting had an average viability of 84% ± 1.43%
(mean ± s.e.m., n = 167).
During initial development, at a rate of more than 15 biopsies
per week, a total of 640 skin tissue samples were collected, and
fibroblast cultures were successfully established and frozen from
89.4% (n = 572). Failures were primarily due to either bacterial
or fungal contamination (4.7%, n = 30), attributable to handling
of samples before they entered the system (Supplementary
Table 1). Twenty independent samples were spot tested for karyo-
type, and the majority (19 of 20, 95%) have a normal diploid
karyotype (Supplementary Fig. 3).
As the growth rate of somatic cells are an important determi-
nant of reprogramming efficiency15, we reasoned that parallel
automated reprogramming of many fibroblast lines would require
controlling for this variable. Although growth rates determined
via automated imaging during initial fibroblast derivation (under
low-serum conditions) were variable (n = 298 cell lines) (Fig. 1b,c),
we observed a decline in variance upon subsequent automated
thawing and expansion of fibroblasts, with no significant differ-
ence in average doubling times across the lines analyzed (P = 0.24;
Fig. 1c), greatly streamlining the automated reprogramming
process. Interestingly, we did not find an obvious correlation
between donor age and fibroblast growth rate (Fig. 1d).
Automated reprogramming
The second robotic cluster was designed to automate the thawing
and seeding of fibroblasts, delivery of reprogramming factors,
selection of reprogrammed cells and imaging of cultures to iden-
tify nascent stem cell colonies following surface marker staining
(Fig. 2a, Supplementary Videos 2–4). We initially automated
Sendai virus reprogramming16, but observed low, variable effi-
ciency as well as residual Sendai virus expression after reprogram-
ming, warranting the investigation of additional reprogramming
methods (n = 168 reprogramming attempts; Supplementary
Figs. 4a–c and 5a–c). We next automated the delivery of modi-
fied mRNAs encoding reprogramming transcription factors17
(Supplementary Fig. 6a) in 21 experimental production runs of
48 samples per run, launched at a rate of one to two experiments
per week. From 1,008 total attempts, we excluded 334 attempts
because of incomplete data or use of fibroblasts not derived under
25Clinics Patient
samples
Derivation
hub
Automation
for iPSC
derivation Repository
automation
Custom-
rearrayed
lines
Banking site End-user sites
User
robots
User
robots
User
robots
Differentiation
Data
Data
Clinic
n = 298 n = 298
20
5
0
0 50 100 150
0
Banked
fibroblasts
Thawed
fibroblasts
0 20 40 60 80 100
Donor age (years)
50
100
150
0
50
100
150
Fibroblast doubling time (h)
Fibroblastdoublingtime(h)
15
10
Frequency
Doublingtime(h)
n = 33
a b c d
Genome
editing
Endpoint
assays
Master
hiPSCs
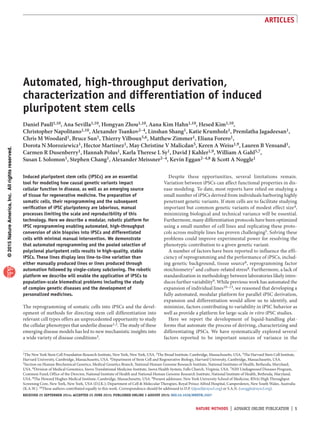
Figure 1 | Automated fibroblast and iPSC production. (a) Schematic illustrating how the robotic platform can act as a derivation hub interacting with
clinics and other sources to recruit samples for iPSC reprogramming. Repository stocks of both fibroblasts and iPSCs could be distributed to banking sites
for storage and expansion. End-user sites could request custom-arrayed lines and perform downstream assays with one or two focused instruments.
(b) Histogram of fibroblast doubling times calculated from confluence scans of fibroblasts during expansion. (c) Comparison of doubling times of
fibroblasts grown in low-serum medium before cryopreservation and after thawing in medium containing a higher percentage of serum. The bold line
represents the median, with upper and lower boundaries of the box showing the 1st and 3rd quartiles, respectively. Upper and lower whiskers represent
75th and 25th percentile, respectively. Circles indicate potential outliers. (d) Scatterplot of doubling time versus age of donor.
- 3. ©2015NatureAmerica,Inc.Allrightsreserved.
nature methods | ADVANCE ONLINE PUBLICATION |
Articles
automation. An additional 151 attempts
failed owing to poor growth of fibroblasts
after thawing, leaving 523 independent
individual reprogramming attempts for
analysis. Of these, 375 were from adult
fibroblasts (110 unique donors) and 148
from control BJ fibroblasts (included in
each run to monitor run-to-run variation)
(Supplementary Tables 2 and 3). Of the 523 reprogramming
attempts, 221 were successful, as defined by the presence of
nascent TRA-1-60+ iPSC colonies (typically observed between
days 16 and 22 of culture; Fig. 2b). Established cultures
demonstrated a pluripotent human embryonic stem cell (hESC)-
like morphology and expressed common markers of pluripo-
tency, including NANOG, OCT4, SOX2, SSEA4 and TRA-1-81
(Supplementary Fig. 6b,c). Using an automated colony-counting
algorithm combined with live TRA-1-60+ antibody staining, we
counted an average of seven colonies per well (Supplementary
Fig. 6d). Samples dissociated during the enrichment step
(see below) contained a high proportion of TRA-1-60+ SSEA4+
CD13− cells before enrichment. In contrast to what was seen
with Sendai reprogramming, only 5.4% of TRA-1-60+ SSEA4+
cells retained CD13 expression (23–30 d after the final mRNA
transfection, n = 34 independent reprogrammings; Fig. 2c).
Overall reprogramming efficiency was between 0.001% and
0.16% per plated somatic cell, consistent with previous results
obtained under feeder-free conditions18, and was slightly higher
for control BJ fibroblasts (0.043%) than for adult fibroblasts
(0.014%). Although we were able to reprogram fibroblasts from
older donors, post hoc analysis indicated that increasing donor
age negatively influenced the number of colonies produced, and
so does fibroblast doubling time (Fig. 2d,e), although in wells
where fibroblasts grew to confluence during the reprogramming
process, a high cell density negatively correlated with reprogram-
ming efficiency (Fig. 2f). Importantly, this analysis revealed that
switching from high-serum recovery medium to a serum-free
reprogramming medium had a negative impact on reprogram-
ming efficiency (Fig. 2g, Supplementary Tables 2 and 3).
On the basis of these data, we implemented a modified
reprogramming strategy, whereby a gradual serum reduction was
performed daily over the first 5 d of reprogramming. We observed
that overall reprogramming success increased to 76.9% (166 of
216 total samples). Of the 102 unique samples used in these runs,
86% (88 of 102) were reprogrammed on the first attempt, with
an average of 17.7 colonies per well. Of the 14 unique samples
that did not reprogram, 5 failed on multiple occasions. Of the
remaining nine, one sample was attempted only once, whereas the
other eight were part of a run with mechanical errors. In this
overall set of experiments, a total of 65 unique donor lines were
run in duplicate and 61 reprogrammed successfully on both occa-
sions. The remaining samples were run either in triplicate or as
single samples.
Automated iPSC purification
Building upon our previous work19, we employed negative
selection against incompletely reprogrammed cells with an
immunomagnetic bead separation device (MACS) (Fig. 3a,
Supplementary Fig. 7a,b) to achieve a 26-fold enrichment of
reprogrammed cells (Supplementary Fig. 7c). Enriched primary
iPSCs were robotically transferred into 96-well plates. TRA-1-60+
colonies formed within 7–10 d after enrichment (Fig. 3b,
Supplementary Fig. 8a). Although it was possible to isolate
clonal lines using the serial dilution strategy (Supplementary
Fig. 8b), we instead selected polyclonal wells with similar
growth characteristics, as identified through automated imaging,
for downstream expansion, characterization and variance
analysis. Flow cytometry analysis showed that ~80% of the cells
were SSEA4+ TRA-1-60+ and expressed the pluripotency marker
NANOG, and doubling times were consistent with those of
PSCs (Supplementary Fig. 8c–e). We analyzed enriched samples
using a gene expression panel covering pluripotency and
germ-layer marker genes20 (Fig. 3c). Nine of 11 polyclonal lines
Fibroblast
bank Fibroblast
thaw and
recovery
Fibroblast
passaging
mRNA
reprogramming
Imaging and
colony count
Day 8
0.72
98.9
Day 16
3.5 n = 523
n = 523
n = 234 n = 61 n = 228
FM10 M106
Recovery medium
Pluri10
3.0
2.5
2.0
1.5
0 20 40 60 80
Day 22
– – –Data collection
37.2
CD13
Colonycount
Colonycount
TRA-1-60 SSEA4
2.0
2.5
3.0
3.5
4.0
SSEA4
Age (years)
TRA-1-60
stain
a b
c d
n = 523
Colonycount
4.0
3.5
3.0
2.5
2.0
0 20 40 50 80 100
Confluence (%)
fn = 523
Colonycount
0.5
1.0
1.5
2.0
2.5
3.0
3.5
4.0
e g
0 20 40 60 80 100 120 140
Fibroblast doubling time (h)
Figure 2 | Automated reprogramming.
(a) Experimental scheme for automated
fibroblast thawing and reprogramming.
(b) Representative time course of mRNA
transfection, with development of colonies
over 22 d. (c) Representative flow cytometry
analysis of 34 biological replicates of
reprogrammed cultures from automated mRNA
transfection, displaying a higher proportion of
cells expressing the pluripotency markers
TRA-1-60+ and SSEA4+ 23 d after the final mRNA
transfection (left) and lack of the fibroblast
surface marker CD13 (right). (d–g) Effect plots
of Poisson regression analysis of factors that
contribute to reprogramming success: colony
count versus age (d); colony count versus
fibroblast doubling time (e); colony count
versus confluence (f); colony count versus
recovery medium post thaw (g). Gray areas and
red bars indicate confidence intervals.
- 4. ©2015NatureAmerica,Inc.Allrightsreserved.
| ADVANCE ONLINE PUBLICATION | nature methods
Articles
Figure 3 | Automated iPSC purification
and arraying. (a) Flow cytometry analysis
for TRA-1-60+ SSEA4+ CD13− cells before and
after automated MACS purification.
(b) Representative images of one well of
a 96-well plate for bulk-sorted cells 9 d post
sorting (9 dps), with right panel showing
TRA-1-60 expression pattern captured by
automated imaging. Scale bars, 500 µm.
(c) Clustering of sorted samples
against reference hESC and fibroblast
lines based upon gene expression of
pluripotency and early differentiation
markers. (d) Box plot of the pluripotency
scores for reference hESC lines, iPSC lines
and fibroblast cell lines. Numbers of
unique samples shown in parentheses.
The bold line represents the median, with
upper and lower boundaries of the box
showing the 1st and 3rd quartiles, respectively.
Upper and lower whiskers represent the 75th
and 25th percentiles, respectively. Circles
indicate potential outliers. (e) Example
growth rates of a robotically passaged
iPSC plate over 5 d of culture. y axis,
percentage of total well confluence from
0 to 100; x axis, time from 0 to 120 h.
Each graph is of a single well of a 96-well
plate. (f) Summary of flow cytometry
analysis of TRA-1-60+ SSEA4+ population before and after automated passage 1:3 for control hESC lines and iPSC lines derived on the system
(error bars, s.d.; n = 3 replicates per line per condition).
had scores consistent with those of an hESC reference panel
(Fig. 3d, Supplementary Fig. 9a). Two outlying samples
(10005_421 and 1005_350), while pluripotent, displayed elevated
differentiation scores, attributable to overgrowth-induced spon-
taneous differentiation (Supplementary Fig. 9b,c), thus failing
the quality-control check. Therefore, high-purity undifferentiated
iPSC lines could be established and validated at low passage by
high-throughput processing in 96-well plates.
Automated, parallel culture of multiple iPSCs
The second of the two robotic clusters expands and freezes down
cells into barcoded cryotubes, creates embryoid bodies (EBs) for
QC analysis and collects cell pellets for RNA and DNA isolation
(Supplementary Fig. 1). Although iPSCs from the first clus-
ter showed a narrow range in doubling times (Supplementary
Fig. 8c), to accommodate variable growth rates, we developed
automated processes for the cryopreservation and recovery of
nascent iPSCs with similar growth characteristics (Supplementary
Fig. 2a (Stage 3), Supplementary Fig. 10a,b, Supplementary
Video 5). Following robotic cryopreservation and thawing, iPSCs
reattached, resumed proliferating and showed a normal morphol-
ogy (Supplementary Fig. 10c). Pre-freeze and post-thaw conflu-
ence correlation was highest 1 d post thaw (Pearson’s r 0.91) but
decreased as the wells approached full confluence (r 0.71 on
day 3, r 0.41 on day 6) (Supplementary Fig. 10d). Expression
of the cell-surface markers SSEA4 and TRA-1-60 was unaffected
by freezing or thawing (Supplementary Fig. 10e). Cells grow-
ing in 96-well plates could be successfully maintained for up to
7 d between passages (Fig. 3e). Passage ratios ranging from 1:1
to 1:15 were successfully used, with low plate-to-plate variation
(Supplementary Fig. 10f), without affecting marker expression
or cell morphology (Fig. 3f, Supplementary Fig. 10g).
Although previous reports have stated that chromosomal abnor-
malities occur in approximately 20% of iPSCs21, the majority of
30.3
Pre-purification Post-purification
66.3
0.59
65.3
9 dps9 dps
TRA-1-60
3 SampleNANOG
LIN28
SOX2
ZFP42
POU5F1
AFP
ANPEP
NR2F2
SOX17
28999_BJ
28303_BJ
ND2.0
HUES8
HUES_1
HUES45
0 50 100
% Tra 1-60+/
SSEA4+
Gene set
2
1
0
–1
–2
–3
SSEA4
28
CD13
5
100
0 120
Time (h)
Confluence
(%)
0
–5
–10
R
eference
lines
(15)Autom
ated
lines
(11)Fibroblasts
(3)
–15
Pluripotencyscore
(medianTscore)
CD13
TRA-1-60
TRA-1-60
TRA-1-60
a b
c
e fd
Automated iPSC
Reference HESC
Differentiation
Pluripotency
Fibroblast
A
1 2 3 4 5 6 7 8 9 10 11 12
3
Hanging drop
V-bottom (Greiner)
V-bottom (Nunc)
2
1
0
–1
–2
–3
EC ME EN
Germ layer
Meandifferentiationpropensity
B
C
D
E
F
G
H
a b cFigure 4 | Automated embryoid body assay.
(a) Image (automated) of EBs generated from
iPSC ubiquitously expressing GFP. Scale bar,
200 µm. (b) Representative image of all
experiments using the preferred Greiner 96-well
V-bottom plate, after automated passage to
form EBs. Scale bar, 500 µm. (c) Comparison of
average scorecard differentiation propensities
for each germ layer (EC, ectoderm; ME,
mesoderm; EN, endoderm) observed in an iPSC
line when differentiated using one of three
different automation-compatible methods (indicated by colored line marking the average score for each method, n = 4 replicates per method). The black
box plots indicate scorecard data for ten hESC reference lines.
- 5. ©2015NatureAmerica,Inc.Allrightsreserved.
nature methods | ADVANCE ONLINE PUBLICATION |
Articles
our iPSCs (89%, n = 38) showed a nor-
mal diploid karyotype (Supplementary
Fig. 11a). Three of the abnormal lines all
originated from a common fibroblast (BJ)
and shared the same genomic aberration,
suggesting that they derived from a low-
percentage heterogeneity pre-existing in
the original fibroblast.
We subjected an additional eight lines
to higher-resolution single-nucleotide
polymorphism (SNP) array analyses at
both low (P8) and high passage (P20). From two independent
fibroblast samples, three iPSC lines were derived as pooled popu-
lations and a further five were derived as clonal lines via manual
picking following automated reprogramming. Seven of the eight
lines displayed single de novo copy-number variations (CNVs) at
low passage, with mosaic CNVs found in two of the pooled lines
(Supplementary Note). Two lines (one clone and one pool) devel-
oped either one or two de novo CNVs over continued culture22,23.
These numbers are in accordance with other CNV studies
in iPSCs and highlight the need for continual monitoring of any
pluripotent stem cell line.
Automated analysis of differentiation propensity
To quantitatively assess pluripotency, we automated the sponta-
neous differentiation of EBs in V-bottom plates and performed a
modified version of the previously described stem cell “scorecard”
gene expression assay19,20 to measure propensity for differentiation
into the embryonic germ layers (ectoderm, mesoderm and endo-
derm) relative to hESC EBs (Fig. 4a,b, Supplementary Fig. 12a,
Supplementary Video 6). Ten reference lines tested exhibited
strong correlations in differentiation propensities with those pre-
viously published20 (Supplementary Fig. 12b–e), with differing
culture conditions presumably underlying the small differences
observed. We also found that the method used to generate EBs
can introduce a large bias in differentiation potential, as lineage
marker gene sets clustered by the method used for EB formation
(Fig. 4c), highlighting the need for method standardization.
Reduced variation in robotically derived iPSCs
Hierarchical clustering of gene expression from the automated
EB assay showed an overall consistency in iPSCs generated by
automation (Fig. 5a), with a significant reduction in variation
seen when comparing entirely manually derived lines to poly-
clonal lines produced under automation (P = 7.08 × 10⁻¹²,
Wilcoxon signed-rank test, Fig. 5b, Supplementary Figure 13,
Supplementary Data). This was true both within a single geno-
type (BJs, P = 7.85 × 10⁻⁹) and between patient lines (donor,
P = 9.28 × 10⁻¹¹). Interestingly, iPSCs initially reprogrammed
robotically with manually picked colonies, and then returned
to the automation system for expansion, showed an elevated
variation similar to that found in existing manually derived iPSC
lines (P value = 0.023). This effect appears to be independent
of reprogramming methodology, as clonal lines derived through
manual picking following robotic Sendai reprogramming
exhibited similar variation (Supplementary Figure 5a). Thus,
our findings indicate that manual clone selection is an important
source of variation. Passage number, however, appears not to play
a significant role in the behavior of any one cell line, whether it
be a pool or a picked clonal line, as the mean differentiation pro-
pensity in the scorecard assay did not deviate significantly over
continued passaging (samples tested at passage 9 and 20, Fig. 5c).
This suggests that pooled lines produced by our automated process
show lower variation at early timepoints after derivation than do
lines derived by current manual procedures (see Discussion).
Automated differentiation
To further test the differentiation capabilities of iPSC lines pro-
duced by automated methods, we used several published or com-
mercially available directed differentiation protocols to generate
lineages from all three germ layers. We first generated cardiomyo-
cytes from automation-derived iPSCs using either an established
protocol24 or a kit-based assay (Fig. 6a, ii–iv, and 6b). These
–4 –2 0 2 4
Process
Automation
Reference
Passage
PoolPick
Source
BJ
Donor
Gene set
Housekeeping
Other
Pluripotency
Scorecard
Sendai
Sex
Pick
Pool
Early
Late
3.5
3.0
1
0
Meandifferentiationpropensity
–1
–2
–3
2.5
Standarddeviation(expression)
2.0
1.5
1.0
0.5
0
M
anual
derivation
(all)Autom
ated
derivation
(all)Autom
ated
derivation
(BJ)Autom
ated
derivation
(donor)
C
olony
picking
(all)
C
olony
picking
(BJ)
C
olony
picking
(donor)
EC ME
Germ layer
EN
Pooled iPSCs - early passage
Pooled iPSCs - late passage
Picked iPSCs - late passage
Picked iPSCs - early passage
a
b c
***
*
***
***
Figure 5 | Reduced variation in robotically
derived iPSCs. (a) Overall cluster analysis of
gene expression analysis from EBs produced
using different plate formats analyzed using
the EB scorecard geneset. (b) Variance analysis
of scorecard gene expression in EBs showing
comparisons of standard deviations of gene
expression values among samples derived on
and off the automated system. *P 0.05,
***P 0.001. Manual (picked) derivation (all,
n = 16), automated (pooled) derivation (all,
n = 21, BJ = 9, donor = 12), colony picking
(after automated reprogramming) (all,
n = 29, BJ = 9, donor = 9), automated
(pooled) derivation (donor, n = 12), automated
(pooled) derivation (BJ, n = 9). (c) The
standard deviations in gene expression of EBs
differentiated from iPSCs across passages.
- 6. ©2015NatureAmerica,Inc.Allrightsreserved.
| ADVANCE ONLINE PUBLICATION | nature methods
Articles
lines showed differentiation efficiencies
comparable to those obtained with pub-
lished protocols and performed as well as
reference lines differentiated in parallel
(Fig. 6a,i, and 6b). In addition, lines
10005_433 and 10005_598 generated by
automation have recently been used to
derive midbrain-type dopaminergic neu-
rons with performance in functional assays
comparable to those of manually produced lines analyzed in
parallel25. These and other cell lines produced under auto-
mation have been used in a range of differentiation protocols
(Supplementary Table 4), including protocols designed to
produce hepatocytes26, metanephric mesenchyme27 and oligoden
drocytes28. In all cases, lines produced by automation performed
comparably to manually derived iPSC or hESC lines differentiated
in parallel (data not shown).
We further tested whether the automated methods described
here could be used to direct differentiation. We used the auto-
mated medium-exchange methods to perform defined medium
exchanges on iPSCs growing in 96-well format toward the defini-
tive endoderm lineage. Cells expressing the endodermal marker
SOX17 could be readily generated in 3 d with efficiency strongly
correlating to their endodermal scorecard value (Pearson correla-
tion = 0.905) (Fig. 6c). To determine whether longer protocols
were amenable to the automated methods, we generated midbrain
dopaminergic neurons through a 30-d protocol of continuous
culture25. We found that both intermediate-stage progenitors
and differentiating neurons could be readily differentiated and
maintained, retaining expression of markers typical for this cell
type (Fig. 6d).
Together these data show that cell lines produced under auto-
mation perform as well as manually produced lines and that it is
possible to automate the differentiation of pluripotent stem cell
lines on a single module of our current system.
DISCUSSION
Here we demonstrate the establishment of fully automated and
robotic processes for generating iPSC lines of high quality and
consistency. In contrast to approaches that automate the expan-
sion and manipulation of only a small number of cell lines at a
time10–13, our system has the capacity to initiate reprogramming,
expansion and characterization of several hundred samples per
month. Not only does the system show a 5- to 6-fold reduction
in reagent cost and a 10- to 12-fold increase in productivity as
compared to previous approaches29, but its capacity can be scaled
with only a minimal increase in personnel time. We envision that
large core facilities would maintain a complete reprogramming
platform, with individual labs potentially having a single system
on which large numbers of iPSCs could be handled. Adaptation
of this system to alternate input material, such as blood, is also
feasible30. Additionally, as automated single-cell isolation is pos-
sible, this approach can also be used in gene-editing workflows,
enabling many large-scale projects using iPSCs to link function
to human genetics31. Although our platform supports a complete
standardized high-throughput workflow, it was designed so that
individual modules can be used for specific applications, such
as maintenance and differentiation enabling population-scale
iPSC assays.
The large scale of our experiments also allowed us to address
several questions. While we were able to successfully reprogram
many samples from subjects at advanced age, our data suggest that
H9
P33 hESC
H9 P33
100
Troponin Hoechst%SOX17
+
50
0
10005_643 P22 iPSC
BJ iPSC01 (96)
BJ iPSC02 (96)
HUES28 (24)
HUES42 (75)
HUES45 (27)
HUES49 (27)
HUES62 (27)
S1013A (27)
10005_237 (15)
LMX1 SOX1 Hoechst SOX2 Nestin Hoechst FOXA2 SOX1 Hoechst TUJ1 TH Hoechst
10005_218 (15)
10006_102 (15)
10006_103 (15)
10006_104 (15)
10006_106 (15)
10006_109 (15)
10001_130 (15)
BJ iPSC03 (15)
PBMC4 (15)
10005_412 P28 iPSC 10005_568 P18 iPSC
10005_643
P22 iPSC
10005_412
P28 iPSC
10005_568
P18 iPSC
41.8%63.6%50.6%52.8%
i ii iii iv
VCAM
Troponin-T
a
b
c
d
Figure 6 | Differentiation of iPSCs derived via
automation and demonstration of automated
differentiation. (a) Flow cytometry analysis
shows expression of the indicated markers
upon direct differentiation of PSCs into
cardiomyocytes via either an established
protocol24 (i, ii) or a kit-based assay (iii, iv)
using three iPSC lines derived under
automation (ii–iv) and one ES line (i) at
the indicated passages. VCAM, vascular cell
adhesion molecule 1. (b) Immunostaining of
troponin-T expression in Cytospin-separated
differentiated cardiomyocytes. Scale bars,
200 µm. (c) Automated directed differentiation
of the indicated iPSCs and hESCs into
Sox17-positive endodermal cells. The number
of independent wells analyzed is indicated
in parentheses. BJ iPSC02 was derived
by automation. Error bars, s.d. (d) The
micrographs show immunostaining of an
automation-produced iPSC line following an
automated directed differentiation to generate
midbrain progenitors expressing the markers
LMX1, SOX1, SOX2, NESTIN and FOXA2 and
midbrain dopaminergic neurons expressing
TUJ1 and TH. Scale bars, 100 µm.
- 7. ©2015NatureAmerica,Inc.Allrightsreserved.
nature methods | ADVANCE ONLINE PUBLICATION |
Articles
advanced age, as previously highlighted32, is a potential inhibi-
tor of reprogramming. However, we found that both the growth
rate and confluence of cell cultures at the time of reprogramming
were primary drivers of whether our automated approach suc-
ceeded in producing iPSCs in each case, consistent with previous
observations15. We found that the reprogramming method had a
substantial effect on the outcome of automated reprogramming.
Although aspects of iPSC production using both mRNA deliv-
ery and Sendai virus infection could be automated, we used a
modified mRNA reprogramming method as our standard pro-
tocol. However, the flexibility of the system allows for the future
adoption of other reprogramming methods.
Notably, we found that manual isolation of newly repro-
grammed iPSC colonies is in itself a substantial contributor
to cell-line-to-cell-line variation. Through automation of the
reprogramming process and the generation of pooled, polyclonal
lines, more than one-third of the variability that existed between
manually selected lines was eliminated. This finding demon-
strates that at the very least, a substantial portion of the variation
observed between manually derived iPSC lines has purely tech-
nical origins that may obscure inherent genotypic differences.
Furthermore, we showed that the level of variability between
pooled cell lines made from many donors was not different from
that found with such lines from a single donor. Previous studies
suggest that genetic factors could be a contributing factor to func-
tional variance between iPSCs33. However, our data suggest that
if these factors do contribute, they do so modestly in comparison
to the technical variation that can be resolved through pooling
and automation.
We observed that for lines derived with our combined approach,
serial passaging had no impact on differentiation capacity.
Additionally, no bias in the development of de novo aneuploidy
was observed when pooled iPSCs were compared with manually
derived, clonal cell lines of the same genetic background. Thus we
have not found any evidence for either differential instability or
the acquisition of clonal dominance with our approach.
Although subcloning may be unavoidable in certain experi-
mental contexts, there are several reasons to avoid single-cell
cloning of stem cells. First, numerous paracrine interactions
among stem cells exist, yet are poorly understood, particularly
for iPSC maintenance. Cell death upon single-cell dissociation
of human PSCs, as mediated by Rho-associated kinase signaling,
for example, could place selective pressure on the cell population
in the absence of these factors, amplifying clones with growth
advantages34 and leading to tremendous variation from the
bottleneck35. Carrying polyclonal lines can help reduce this effect
by providing additional trophic support. Second, much as in many
cancers where driver mutations are frequently not expanded in
polyclonal populations due to density-dependent growth con-
straints36, bystander mutations unmasked by single-cell clonal
isolation may make the cells susceptible to selective pressures
that lead to variation. Finally, epigenetic alterations such as irre-
versible erosion of X-chromosome inactivation can de-repress
X-linked genes in female iPSCs37,38, further amplifying abnor-
mal phenotypes and masking true disease phenotypes. In all of
these cases, clonal selection could introduce variability. Although
monitoring will be important in all cases, the automated approach
described here allows analysis of many more cell lines in parallel
under uniform conditions.
At the moment, most studies using iPSCs for disease mod-
eling have focused on a small number of lines originating from
individuals harboring either one or a small number of highly
penetrant mutations. The expanded scale and reduced variation
of the automated system will provide greatly improved statistical
power to address the question of whether a modest effect observed
in culture is a direct result of genetic background. This increased
sensitivity should assist in accurately assessing the impact of
common variants that influence human health and further enable
the discovery of molecular and genetic pathways that underlie
traits of human development and disease.
Methods
Methods and any associated references are available in the online
version of the paper.
Accession codes. Illumina array data have been deposited at the
GEO under accession number GSE42271.
Note: Any Supplementary Information and Source Data files are available in the
online version of the paper.
Acknowledgments
We thank L. Rubin, Z. Hall and S. Lipnick for critical reading of the manuscript.
This work would not have been possible without S. Solomon’s leadership, vision,
continual encouragement and unstinting support. The authors also thank The
Genomics Core, National Human Genome Research Institute, for performing
the SNP arrays and the Intramural Research Program of the National Human
Genome Research Institute, National Institutes of Health, Bethesda, USA for
their contributions. A.M. receives support as a New York Stem Cell Foundation
Robertson Investigator, with additional funding through US National Institutes
of Health grant P01GM099117.
AUTHOR CONTRIBUTIONS
D.P. designed and performed iPSC reprogramming, expansion and QC assays.
A.S. designed and performed iPSC expansion and RNA QC assays. H.Z. designed
and performed iPSC reprogramming, selection and passaging biology.
A.K.H. engineered methods for iPSC expansion and EB and fibroblast QC methods.
H.K. engineered methods for fibroblast derivation, iPSC reprogramming,
selection and passaging. C.N. designed the integration of the robotic platform
and sample tracking systems, and contributed to engineering methods.
A.T. performed statistical analysis. K.K. and P.J. performed fibroblast derivation.
D.P., A.S., L.S., B.S., C.M.W., D.N.M., H.M., M.Z., K.A.W and S.A.N., performed
iPSC reprogramming, expansion, QC and differentiation experiments. E.F., H.P.,
K.T.L.S., C.R.D. and L.B.V. were involved in the collection of fibroblast samples.
T.V., M.C.V.M. and W.A.G. performed SNP genotyping and analysis. K.K., D.J.K.
and S.A.N. were involved in system protocol development. S.L.S., S.C., K.E.
and S.A.N. designed and supervised the project. A.M. provided statistical
tools and supervised statistical analysis. D.P., K.E. and S.A.N. wrote the
manuscript with contributions from other authors.
COMPETING FINANCIAL INTERESTS
The authors declare no competing financial interests.
Reprints and permissions information is available online at http://www.nature.
com/reprints/index.html.
1. Colman, A. Dreesen, O. Pluripotent stem cells and disease modeling.
Cell Stem Cell 5, 244–247 (2009).
2. Takahashi, K. et al. Induction of pluripotent stem cells from adult human
fibroblasts by defined factors. Cell 131, 861–872 (2007).
3. Robinton, D.A. Daley, G.Q. The promise of induced pluripotent stem
cells in research and therapy. Nature 481, 295–305 (2012).
4. Morris, A.P. et al. Large-scale association analysis provides insights into
the genetic architecture and pathophysiology of type 2 diabetes.
Nat. Genet. 44, 981–990 (2012).
5. Santostefano, K.E. et al. A practical guide to induced pluripotent stem
cell research using patient samples. Lab. Invest. 95, 4–13 (2015).
6. Cahan, P. Daley, G.Q. Origins and implications of pluripotent stem cell
variability and heterogeneity. Nat. Rev. Mol. Cell Biol. 14, 357–368 (2013).
- 8. ©2015NatureAmerica,Inc.Allrightsreserved.
| ADVANCE ONLINE PUBLICATION | nature methods
Articles
7. Carey, B.W. et al. Reprogramming factor stoichiometry influences the
epigenetic state and biological properties of induced pluripotent stem
cells. Cell Stem Cell 9, 588–598 (2011).
8. Liang, G. Zhang, Y. Genetic and epigenetic variations in iPSCs: potential
causes and implications for application. Cell Stem Cell 13, 149–159
(2013).
9. Chen, K.G., Mallon, B.S., McKay, R.D. Robey, P.G. Human pluripotent
stem cell culture: considerations for maintenance, expansion, and
therapeutics. Cell Stem Cell 14, 13–26 (2014).
10. Thomas, R. et al. Automated, scalable culture of human embryonic stem
cells in feeder-free conditions. Biotechnol. Bioeng. 102, 1636–1644
(2009).
11. Terstegge, S. et al. Automated maintenance of embryonic stem cell
cultures. Biotechnol. Bioeng. 96, 195–201 (2007).
12. Conway, M.K. et al. Scalable 96-well plate based iPSC culture and production
using a robotic liquid handling system. J. Vis. Exp. 99, e52755 (2015).
13. Valamehr, B. et al. A novel platform to enable the high-throughput
derivation and characterization of feeder-free human iPSCs. Sci. Rep. 2,
213 (2012).
14. Utikal, J. et al. Immortalization eliminates a roadblock during cellular
reprogramming into iPS cells. Nature 460, 1145–1148 (2009).
15. Hanna, J. et al. Direct cell reprogramming is a stochastic process
amenable to acceleration. Nature 462, 595–601 (2009).
16. Fusaki, N., Ban, H., Nishiyama, A., Saeki, K. Hasegawa, M. Efficient
induction of transgene-free human pluripotent stem cells using a vector
based on Sendai virus, an RNA virus that does not integrate into the host
genome. Proc. Jpn. Acad., Ser. B, Phys. Biol. Sci. 85, 348–362 (2009).
17. Warren, L. et al. Highly efficient reprogramming to pluripotency and
directed differentiation of human cells with synthetic modified mRNA.
Cell Stem Cell 7, 618–630 (2010).
18. Warren, L., Ni, Y., Wang, J. Guo, X. Feeder-free derivation of human
induced pluripotent stem cells with messenger RNA. Sci. Rep. 2, 657
(2012).
19. Kahler, D.J. et al. Improved methods for reprogramming human dermal
fibroblasts using fluorescence activated cell sorting. PLoS ONE 8, e59867
(2013).
20. Bock, C. et al. Reference maps of human ES and iPS cell variation enable
high-throughput characterization of pluripotent cell lines. Cell 144,
439–452 (2011).
21. Mayshar, Y. et al. Identification and classification of chromosomal
aberrations in human induced pluripotent stem cells. Cell Stem Cell 7,
521–531 (2010).
22. Abyzov, A. et al. Somatic copy number mosaicism in human skin revealed
by induced pluripotent stem cells. Nature 492, 438–442 (2012).
23. Cheng, L. et al. Low incidence of DNA sequence variation in human
induced pluripotent stem cells generated by nonintegrating plasmid
expression. Stem Cell 10, 337–344 (2012).
24. Lian, X. et al. Directed cardiomyocyte differentiation from human
pluripotent stem cells by modulating Wnt/β-catenin signaling under fully
defined conditions. Nat. Protoc. 8, 162–175 (2013).
25. Woodard, C.M. et al. iPSC-derived dopamine neurons reveal differences
between monozygotic twins discordant for Parkinson’s disease. Cell Reports
9, 1173–1182 (2014).
26. Hannan, N.R.F., Segeritz, C.-P., Touboul, T. Vallier, L. Production of
hepatocyte-like cells from human pluripotent stem cells. Nat. Protoc. 8,
430–437 (2013).
27. Taguchi, A. et al. Redefining the in vivo origin of metanephric nephron
progenitors enables generation of complex kidney structures from
pluripotent stem cells. Cell Stem Cell 14, 53–67 (2014).
28. Douvaras, P. et al. Efficient generation of myelinating oligodendrocytes
from primary progressive multiple sclerosis patients by induced pluripotent
stem cells. Stem Cell Reports 3, 250–259 (2014).
29. Beers, J. et al. A cost-effective and efficient reprogramming platform for
large-scale production of integration-free human induced pluripotent stem
cells in chemically defined culture. Sci. Rep. 5, 11319 (2015).
30. Zhou, H. et al. Rapid and efficient generation of transgene-free iPSC from
a small volume of cryopreserved blood. Stem Cell Rev. 11, 652–665 (2015).
31. McKernan, R. Watt, F.M. What is the point of large-scale collections of
human induced pluripotent stem cells? Nat. Biotechnol. 31, 875–877
(2013).
32. Rohani, L., Johnson, A.A., Arnold, A. Stolzing, A. The aging signature:
a hallmark of induced pluripotent stem cells? Aging Cell 13, 2–7 (2014).
33. Kajiwara, M. et al. Donor-dependent variations in hepatic differentiation
from human-induced pluripotent stem cells. Proc. Natl. Acad. Sci. USA
109, 12538–12543 (2012).
34. Watanabe, K. et al. A ROCK inhibitor permits survival of dissociated
human embryonic stem cells. Nat. Biotechnol. 25, 681–686 (2007).
35. Li, C. et al. Genetic heterogeneity of induced pluripotent stem cells:
results from 24 clones derived from a single C57BL/6 mouse. PLoS ONE
10, e0120585 (2015).
36. Martincorena, I. et al. Tumor evolution. High burden and pervasive
positive selection of somatic mutations in normal human skin. Science
(New York, N.Y.) 348, 880–886 (2015).
37. Mekhoubad, S. et al. Erosion of dosage compensation impacts human iPSC
disease modeling. Cell Stem Cell 10, 595–609 (2012).
38. Vallot, C. et al. Erosion of X chromosome inactivation in human
pluripotent cells initiates with XACT coating and depends on a specific
heterochromatin landscape. Cell Stem Cell 16, 533–546 (2015).
- 9. ©2015NatureAmerica,Inc.Allrightsreserved.
doi:10.1038/nmeth.3507 nature methods
ONLINE METHODS
Donor recruitment and biopsy collection. Dermatology patients
undergoingaregularlyscheduledbiopsy,aswellasvolunteersfroma
diverse population, were recruited to donate a biopsy for the genera
tion of induced pluripotent stem cells. Volunteers, free from bleed-
ing disorders or tendency to excessive scarring, were scheduled to
donate a 3-mm punch biopsy at a collaborating dermatology clinic.
Prior to their participation, all participants provided their written
informed consent and study approval was obtained from Western
Institutional Review Board. The samples were taken from an area
of the body at the doctor’s discretion, usually the upper arm or leg.
In addition to the biopsies, health information questionnaires were
used to collect information such as health and medication history,
social history and ethnic background. Upon collection, the sam-
ples and accompanying questionnaires were de-identified using a
unique ID and returned to the NYSCF Human Subjects Research
(HSR) staff. The information provided within the questionnaires
was then entered by the HSR staff into Redcap39, a password pro-
tected database, linking the de-identified data to the anonymous
sample ID for the laboratory researchers.
Automated systems description. We designed three integrated
robotic platforms that fully automate the iPSC generation and
characterization workflow. Cells are housed within Cytomat incu-
bators (Thermo Scientific) and automated methods were used to
call out plates onto robotic decks for processing. The first plat-
form for fibroblast banking consists of a STARlet (Hamilton) with
a plate shuttle directly connected to a Cytomat C24 incubator.
Additional devices such as a Celigo cell imager (Nexcelom), a
VSpin centrifuge (Agilent), and a Matrix tube decapper (Hamilton
Storage Technologies) were integrated to facilitate fibroblast
growth tracking, passaging and freezing processes respectively.
The second platform for iPSC generation is a cluster of three inde-
pendent STAR (Hamilton) liquid-handling systems connected
by a Rack Runner robotic arm (Hamilton Storage Technologies).
This format allows parallel processing on multiple systems. Each
system has been customized for its intended purpose with a
combination of liquid-handling channels with modules for plate
heating, shaking, tilting and cooling. Usage of shared automated
devices such as the Rack Runner, Cytomat incubator, Celigo cell
imagers, VSpin and decapper are controlled by a reservation
system. The third platform for iPSC characterization and bank-
ing is a similar three-platform cluster with a slight device con-
figuration difference optimized for 96-well plate handling. All of
the STAR liquid-handling systems are contained within BSL II
biosafety cabinets (NuAire) to maintain a sterile operating envi-
ronment during manipulation of cell culture plates. Remaining
components are enclosed in a custom HEPA-filtered enclosure to
maintain a sterile operating environment during the transporta-
tion of cell culture plates between systems and devices. Control
software for scheduling and inventory integrate with the method
scripts for fully automated operation of the systems. Each method
outputs detailed log and mapping files of processing steps, and
video monitoring records system activity. Consumable and rea-
gent consumption are also automatically tracked in a database.
Automatedbiopsyoutgrowthandfibroblastcellculture. Somatic
cell lines (dermal fibroblasts) were derived from patient tissue
samples collected at collaborating clinics in Complete M106 media
which contains Medium 106 (Life Technologies, #M-106-500),
50× Low Serum Growth Supplement (Life Technologies,
#S-003-10) and 100× Antibiotic-Antimycotic (Life Technologies,
#154240-062). Samples were de-identified and assigned an inter-
nal identifier for tracking identity and passage number.
Each sample was washed 3 times in biopsy plating media and
cleaned with a disposable scalpel and autoclaved forceps to remove
blood, fat and epithelial tissue. Biopsy plating media contains
Knockout-DMEM (Life Technologies #10829-018), 10% FBS (Life
Technologies, #100821-147), 2 mM GlutaMAX (Life Technologies,
#35050-061), 0.1 mM MEM Non-Essential Amino Acids (Life
Technologies, #11140-050), 1X Antibiotic-Antimycotic, 0.1 mM
2-Mercaptoethanol (Life Technologies, #21985-023) and 1%
Nucleosides (Millipore, #ES-008-D). Depending on initial tissue
sample size, 2–3 clean ~1-mm3 pieces were transferred to each
well of a 6-well tissue culture plate (Corning, #3516) and allowed
to dry down for 15 min. After drying, 3 mL of biopsy plating
media was added drop-wise to each well containing tissue pieces
and placed in a quarantine incubator for 10 days to allow for
initial outgrowth. Plates were then transferred to an automated
incubator for routine cell culture on the automated system.
Fibroblasts were maintained in Complete M106 media for
1 week and monitored by an automated imaging system for out-
growth before being changed into antibiotic free M106 media for
3 days. A 200 µL aliquot of fibroblast culture media from each well
of a 6-well plate was robotically pipetted into a 96-well V-bottom
plate (Evergreen, #222-8031) and prepped for mycoplasma testing
on a separate dedicated liquid-handling system. Mycoplasma test-
ing was robotically performed using the MycoAlert Mycoplasma
Detection kit mycoplasma luminescent assay (Lonza, #LT107-318)
with the accompanying MycoAlert Assay Control Set (Lonza,
#LT07-518) and read on an integrated Synergy HT plate reader
(BioTek).
Samples confirmed to be mycoplasma negative were, robotically,
enzymatically passaged using TrypLE CTS (Life Technologies,
#A12859-01) into a new, 6-well daughter plate, keeping source
wells separate at a 1:1 ratio. Passaged cells were maintained robot-
ically in Complete M106 and monitored using the automated
imaging system for doubling times and ideal freezing confluence.
Upon reaching confluence, each well of the daughter plate was
enzymatically passaged, pooled and resuspended in 1.5 mL of CTS
Synth-a-Freeze (Life Technologies, #A13717-01). Three 500 µL
aliquots of the cell suspension were transferred robotically into
three 2D barcoded Matrix tubes (Thermo Scientific, #3741) for
cryopreservation. Matrix tubes, within their rack, were placed into
a CoolBox 96F System (Biocision, #BCS-147). After 24 h, one of
three cryopreserved Matrix tubes representing one patient sample
was transferred from the CoolBox system to an automated −80 °C
Sample Access Manager (SAM, Hamilton Storage Technologies),
where samples are inventoried and selected for reprogramming
runs. The SAM inventory database allows for flexible recall and
downstream process batching of tubes for reprogramming based
on multiple factors including density, growth rates and disease
group. The remaining two Matrix tubes of the same sample were
transferred from the CoolBox system to liquid nitrogen for long-
term storage.
Automated fibroblast thawing. Fibroblasts frozen in Matrix
tubes, stored within the SAM, were typically removed in batches
- 10. ©2015NatureAmerica,Inc.Allrightsreserved.
doi:10.1038/nmeth.3507nature methods
of 20 and manually counted to determine cell number and via-
bility. Cells were first manually resuspended into Matrix tubes
at known cell numbers for reprogramming and refrozen. At the
point of thaw 48 Matrix tubes, typically consisting of duplicates
of 20 cell lines and 8 BJ fibroblast controls, were removed and
thawed in a 37 °C water bath for 30 s, before being placed on the
robotic deck. Upon starting the method tubes were decapped,
fibroblast growth medium (FGM, consisting of DMEM (#11965),
10% FBS, Glutamax, 2-Mercaptoethanol (all Life Technologies))
was added to each vial, recapped, and centrifuged. The superna-
tant was subsequently removed and the fibroblasts resuspended
in fresh media before being transferred to 4 pre-barcoded 12-well
plates (Corning, #3513). Each 12-well plate was fed every 3 days,
with automated imaging occurring at least three times over a
10-day growth period.
Automated cell seeding. Cells grown in 12-well plates were
washed and dissociated with TrypLE Select CTS. Following
neutralization with FGM, 5% (50 µL) of the cell suspension was
transferred into a 96-well BD imaging plate (BD Biosciences,
#353219) pre-filled with 50 µL of PBS (Life Technologies, #14190-
144) containing 5 µg/mL Hoechst 33342 (Sigma, #B2261) and
1 µg/mL Propidium Iodide (Life Technologies, #P3566). The
imaging plate was centrifuged for 2 min before being subjected
to a cell count using the Celigo Dead/Total application. The cell
counts were auto-exported with the liquid-handling software
automatically calculating the exact volume of cell suspen-
sion required for transfer into daughter wells of a 24-well plate
(Corning, #3526) to reach the user-selected seeding density. The
Dead/Total cell count and confluence readout were recorded in
each method run. Following the passage, cells remaining in the
original 12-well plate were fed and allowed to expand for down-
stream DNA isolation.
Automated Geltrex plate coating. For Geltrex plate coating,
1 mL of Geltrex was diluted into 99 mL of pre-chilled DMEM-F12
(Life Technologies, #10565-018) and kept at 4 °C on a cooling
module within the automated system. Pre-chilled plates in either
96-well or 24-well formats were automatically coated with 100 µL
or 500 µL of the pre-chilled Geltrex solution respectively. Coated
plates were sealed and stored for later use for up to a maximum of 2
weeks at 4 °C. Prior to use, plates were incubated at 37 °C for 1 h.
Automated reprogramming. For initial testing with Sendai virus
version 1.0 (Life Technologies, #A1378001), a method was estab-
lished to allow automated addition of the Sendai virus to the pas-
saged fibroblasts. Following a medium exchange into fresh FGM
the virus, kept chilled on a cooling block within the automated
system, was added dropwise into each well of the 24-well plate.
Cells were briefly shaken, for 10 s, before being returned to the
incubator. Cells were medium exchanged daily and monitored
for the presence of colonies with automated imaging. Automated
delivery of Sendai virus to 50,000 fibroblasts, at a multiplicity of
infection of four, resulted in 2 to 10 TRA-1-60+ colonies per well
under feeder-free conditions. Similar efficiencies were obtained
by manual reprogramming under identical conditions. Following
the emergence of colonies, manual picking was performed using
a stereoscope with single colonies transferred to individual wells
of 24 well plates and returned to automation.
For mRNA transfections, an mRNA reprogramming kit
(Stemgent, #00-0071) was used. a cocktail of miRNAs was added
at day 0 (24 h after passaging) followed by 10 daily transfections
of in vitro–transcribed mRNAs encoding POU5F1, KLF4, SOX2,
CMYC, LIN28, and nuclear GFP (nGFP). The day following pas-
saging, cells were equilibrated in Pluriton NUFF-conditioned
medium (Stemgent, Cat #10-007) containing 1× supplement and
200 ng/ml B18R (both supplied with kits) for two to four hours
before miRNA transfection. Following equilibration, cells were
transfected with miRNA on days 0 and 4, with mRNA trans-
fections occurring on days 1–10. The miRNA/mRNA mix was
robotically added, dropwise, to each well of the 24-well plate, fol-
lowed by a 10 s shaking to disperse the mRNA mix throughout the
well. Each day, before transfection, plates were media exchanged
with pre-conditioned Pluriton medium containing supplement
and B18R. After 10 transfections, cells were fed for an additional
5 days with the pre-conditioned Pluriton media containing the
1× supplement. A transition to Freedom media (Life Technologies,
#A14577SA) was made with 50% medium exchanges over the
subsequent 2 days and cells were further grown for up to 30 days
before being sorted. Freedom media is a proprietary formulation
from Life Technologies and is a media designed for feeder-free
conditions. Custom production of this media is available upon
request. This media can be substituted, through limited testing,
with other media such as mTeSR1 and E8.
Automated iPSC sorting. The automated iPSC sorting method
was based on a FACS method we had previously developed19.
The worklist defined the 24-well source plate to be sorted and the
96-well destination plates that the sorted iPSCs should be seeded
into. Half of the samples within the 24-well plate were processed
at any one time. Cells from 12 wells (half) of the 24-well plate
were dissociated with Accutase (Life Technologies, #A11105-01)
and transferred into half of a 24-deep-well harvest plate (EK
Scientific, #EK-2053-S). After a 2 min centrifugation, the super-
natant was removed, and cell pellets were resuspended with FACS
buffer. 20 µL of human anti-fibroblast magnetic beads (Miltenyi
Biotec, #130-050-601) was added to cells, allowed to incubate
for 15 min, and then washed with FACS buffer to remove the
unbound antibody. Following an additional centrifugation, cells
were resuspended with 500 µL of FACS buffer and applied to a
column block on a magnetic separator system (MultiMACS Cell24
Separator Plus, Miltenyi Biotec, #130-098-637). 500 µL of FACS
buffer was then applied (×3) as washes, resulting in un-repro-
grammed fibroblasts staying bound to the column, with repro-
grammed cells passing through and collected as a 2 mL volume
in a 24-deep well collection plate. The collection plate was centri-
fuged for 2 min, supernatant was removed, and cell pellets were
resuspended in 400 µL of Freedom medium supplemented with
1 µM Thiazovivin (Stemgent, #04-0017). Quadruplicate aliquots
of the mixture containing 100 µL of cells were seeded into 4 wells
of a Geltrex pre-coated, 96-well imaging plate (BD Biosciences,
#353219) and serially diluted over a threefold range. The auto-
mated method looped through again to process the second half
of the 24-well source plate.
Automated cell consolidation. We developed an automated
method for consolidating the iPSC colonies that passed quality
control measures of confluency readout (≥15%), typical human
- 11. ©2015NatureAmerica,Inc.Allrightsreserved.
doi:10.1038/nmeth.3507 nature methods
ESC morphology, and TRA-1-60 surface marker expression
screening. Wells within the 96-well sorted plates were identified,
and a cherry-picking worklist was created to dictate source and
destination transfer patterns. Per run, pairs of 96-well source
plates were processed together until the destination plate was
filled. Selected wells were rinsed with 75 µL 0.05 mM EDTA
(Life Technologies, #15575-020) before being incubated with
50 µL of 0.05 mM EDTA for 6 min. After incubation the EDTA
was removed, 100 µL of Freedom medium supplemented with
1 µM Thiazovivin added and triturated under automation to pro-
mote cell dissociation. The 100 µL was subsequently transferred
into a new Geltrex-coated destination plate. For the first 24 h,
cells were cultured with Freedom medium supplemented with
1 µM Thiazovivin, after which cells were fed daily.
Automatedcellpassaging. For cell passage of entire 96-well plates,
a worklist was created, indicating source and destination plates. All
liquid-handling steps herein occurred in the entire plate at once.
The source plate was transferred onto the deck and cell media was
aspirated. Cells were rinsed once with 50 µL of Accutase before a
further addition of 50 µL per well. Accutase incubation was for
20 min at 37 °C on a heated shaker. Cells were neutralized with
175 µL of Freedom media containing 1 µM Thiazovivin, and
transferred to an intermediate 96-well V-bottom plate (Evergreen,
#222-8031-01V). Cells were centrifuged for 5 min at 300 RCF
before supernatants were aspirated and cells resuspended in
Freedom media with 1 µM Thiazovivin. Destination plates, pre-
viously robotically coated with Geltrex and previously robotically
pre-processed by removal of the Geltrex suspension and addition
of Freedom media with 1 µM Thiazovivin, were retrieved from the
incubator and placed on the deck. Cell suspensions were trans-
ferred from the intermediate plate to the new destination plate.
Destination plates were returned to the automated incubator.
Automated cell freezing. A worklist was created, indicating
which 96-well plates were to be frozen into 2D barcoded Matrix
tubes in Matrix racks. All liquid-handling steps use a 96-head.
Media was aspirated and cells were washed with 50 µL Accutase
before a further addition of 50 µL of Accutase was added per
well and cells were incubated at 37 °C for 20 min. Enzyme neu-
tralization was performed by the addition of Freedom media
containing 1 µM Thiazovivin. Cell suspensions were transferred
into an intermediate 96-well V-bottom plate and centrifuged for
5 min at 300 RCF. The Matrix rack was automatically de-capped
and replaced onto the deck. Supernatants were aspirated and cells
were resuspended in 200 µL Synth-a-Freeze. Cell suspensions
were transferred to the Matrix tubes before being re-capped and
manually placed into a CoolBox and stored at −80 °C before being
transferred 24 h later to liquid nitrogen for long term storage.
Automated cell thawing. A Geltrex pre-coated 96-well plate was
retrieved from the Cytomat incubator. Liquid-handling steps were
performed with a 96-head. Tubes in the Matrix rack were capped
and de-capped when necessary. 700 µL of Freedom media with
1 µM Thiazovivin was added to each vial. The tubes in the Matrix
rack were centrifuged for 5 min at 300 RCF. Supernatant was
removed and cells were resuspended in 125 µL of Freedom media
with Thiazovivin; 100 µL was transferred to the 96-well plate.
The plate was placed in the Cytomat incubator. A 10 µL volume of
cell suspension remaining in each tube was used for Dead/Total
cell count by the automated imager.
Automated EB formation. Cells were dissociated with
Accutase for 5 min at 37 °C and plated in suspension into 96-well
V-bottom plates (Greiner, #651161) in the presence of human
ES culture media without bFGF and with 1 µM Thiazovivin.
Human ES media consists of Knockout-DMEM (#10829-018),
10% Knockout Serum Replacement (#10828-028), 1% Glutamax
(#35050-079), MEM nonessential amino acids (#11140-050),
0.1 mM 2-mercaptoethanol (21985-023; all Life Technologies).
Cells from one individual well were dispensed into 6 daughter
wells in a culture volume of 150 µL/well to create 6 total EBs
per starting well. After 24 h, 100 µL of media was removed and
fresh media without Thiazovivin added. Media exchanges were
performed every 48 h. On day 16, the EBs were imaged using an
automated imager to determine their presence before collection
by the liquid-handler workstation. EBs were lysed through the
addition of lysis buffer using a Bravo Automated Liquid Handling
Platform (Agilent Technologies). Lysis buffer (2×) contained
0.5% N-Lauroylsarcosine Sodium salt (Sigma-Aldrich, #61747),
4 M Guanidine Thiocyanate (Sigma-Aldrich, #50983), 200 mM
2-mercaptoethanol (Sigma-Aldrich, #63689), 0.02 M Sodium
Citrate (Sigma-Aldrich, #C8532), 2% DMSO (Sigma-Aldrich,
#D2650). Cell extracts were quantified with Quant-iT RNA
Assay Kit (Life Technologies, #Q-33140). Subsequently, 100 ng
of RNA was used for gene expression analysis on the Nano String
nCounter system following manufacturer’s protocol. A custom
codeset was used which covers 98 genes representing early
differentiation markers of the three germ layers25.
Manual and automated differentiations. Manual differentia-
tion into cardiomyocytes was performed in 24-well plates using
either the PSC Cardiomyocyte Kit (Life Technologies, #A25042-
SA) or a previously described protocol24. Troponin staining and
flow cytometry analysis was performed with Tropinin-T (Thermo
Scientific, #MS-295-P1). Cells were dissociated using TrypLE and
rinsed with PBS. A total of 50,000 cells in 200 µL of PBS were
spun using a Cytospin 4 (Thermo Scientific) at 1,000 RPM for
5 min onto glass slides. Slides were fixed with PFA for 10 min
and stained as previously described above. Automated neuronal
differentiated was performed following the previously described
protocol in 96-well plates with all liquid handling taking place
under automation. Cells were fixed and stained with antibodies
as previously described. The differentiation of endodermal cells
was performed using the STEMdiff Definitive Endodermal Kit
(StemCell Technologies, #05110) with all liquid handling tak-
ing place under automation. Cells were fixed and stained with
SOX-17 (RD Systems, AF1924). Image analysis was performed
using Celigo Imagers.
Immunofluorescence staining. Cell lines, including hESCs and
iPCS, were rinsed twice with 1× PBS, fixed with 4% paraformalde-
hyde (Santa Cruz, #sc-281692) in PBS for 20 min at room temper-
ature and permeabilized with PBS containing 0.1% Triton X-100
(herein referred to as PBST; Sigma-Aldrich, #T8787) for 30 min.
Non-specific binding sites were blocked by incubation with PBST
containing 10% donkey serum (Jackson Labs, #017-000-1210)
for 2 h at room temperature. Cells were subsequently incubated
- 12. ©2015NatureAmerica,Inc.Allrightsreserved.
doi:10.1038/nmeth.3507nature methods
overnight at 4 °C in PBST containing 10% donkey serum and
specific primary antibodies (Supplementary Table 5). Following
3 washes in PBS, cells were incubated with one of the following
secondary antibodies: Alexa Fluor 488 donkey anti-mouse (Life
Technologies #A-21202; 1:1,000 dilution) and Alexa Fluor 555
donkey anti-rabbit IgG (Life Technologies, #A-21428; 1:1,000
dilution). After being washed twice with 1× PBS, the samples
were incubated for 10 min with Hoechst (1 µg/ml) in PBS, fol-
lowed by a final wash in PBS. Alkaline phosphatase staining was
performed according to the manufacturers instructions (Vector
Labs, #SK-5100). Fluorescence images were captured with the
Celigo automated imager, Nikon Eclipse TE 2000-U or Olympus
BX41 fluorescent microscope.
Flow cytometry analysis. To determine pluripotency of PSCs,
cells were stained for CD-13 (BD Biosciences, #555394; 1:100
dilution), SSEA-4 (BD Bioscience, #560219; 1:100 dilution), TRA
1-60 (BD Bioscience, #560173; 1:100 dilution) and DAPI (Life
Technologies #D1306; 1:15,000 dilution) as previously described25.
Stained cells were analyzed on a 5 laser BD Biosciences ARIA-IIu
SOU Cell Sorter. The resulting data were analyzed using FlowJo
software (Treestar).
DNA isolation. DNA was isolated from both iPSCs and fibrob-
lasts. Following the passage of cells from a 12-well to a 24-well,
the fibroblasts remaining within the 12-well plate were robotically
cultured for 10-12 days before being manually passaged to 6-well
plates. Upon reaching ~90% confluence, as monitored through the
automated imaging system, each 6-well plate was manually treated
with TrypLE Select CTS and the resulting cell pellet collected in
a 96-deep well plate (Corning, #3960). Pellets from iPSCs were
collected following a robotic passage from either 96-well plates
directly or following a passage into 24-well plates before being
robotically harvested into a 96-deep well plate, sealed and stored
at −80 °C. DNA isolation was performed using the High Pure
Template PCR Template Preparation Kit (Roche, #11796828001)
as per the manufacturers instructions with the following modifi-
cations: (1) cells were treated with 4 µL of RNase (Qiagen, #19101)
for 2 min while resuspended in PBS; (2) DNA was eluted in
30 µL of water.
RNA isolation. RNA purification was performed through the
use of the Qiagen RNeasy Micro Kit as per the manufacturers
instructions with one modification whereby RNA was eluted
in water. RNA was quantified using a NanoDrop 8000 before
downstream analysis.
Cell line karyotyping and ID testing. Cell lines were karyo-
typed and an identification record of each line was made using
NanoString technology. Karyotyping was undertaken using the
NanoString nCounter Human Karyotype Panel (NanoString
Technologies, #CNV-KAR1-12) and performed as per the
manufacturers instructions. Using reference samples (includ-
ing Affymetrix Reference DNA), a copy number was calculated
for each chromosome following normalization of the data
using nSolver (NanoString Technologies) and Microsoft Excel.
The same protocol was used for a proprietary codeset that allows
the identification of genomic repeat elements. This codeset is
based upon 28 previously identified Copy Number Polymorphic
regions40. A dissimilarity score between a given pair of samples
was calculated as the sum of squared differences between the sam-
ples’ normalized, log-transformed probe values (Supplementary
Fig. 11b). Confirmation of identity was further achieved through
the use of STR analysis (Omega Bioservices, USA).
Gene expression analysis was performed using either a cus-
tom nCounter code set for pluripotency (Pluri25) or a custom
nCounter code set for early differentiation markers into all three
germ layers (3GL) previously described25. Cell extract containing
100 ng of RNA per sample, previously quantified with Quant-iT
RNA Assay Kit (Life Technologies, Q-33140), was mixed with
hybridization buffer, capture and reporter probes. Following a
16 h incubation at 65 °C, samples were transferred to a NanoString
Prep station, where hybridized fluorescently-labeled RNA was
bound to an imaging cartridge before imaging. Data was normal-
ized using nSolver (NanoString Technologies). Clustering was
performed using R41.
SNP array processing and analysis. Genomic DNA was extracted
from cell pellets using the Blood Cell Culture DNA Midi Kit
(Qiagen) as per the manufacturer’s instructions. The DNA was
quantified using a Qubit Fluorometer (Life Technologies). Whole-
genome, single-nucleotide polymorphism (SNP) genotyping was
performed on genomic DNA using HumanOmniExpressExome-
8 v1.2 DNA Analysis BeadChip (Illumina Inc). SNPs were ana-
lyzed with the use of GenomeStudio software (Illumina) and copy
number analysis was performed cnvPartition 3.1.6.
Pluripotency and differentiation score analysis. To ensure that
non-reprogrammed or partially reprogrammed fibroblast lines
were distinguished from successfully reprogrammed iPSC lines,
gene expression signatures were used to measure the pluripotency
and differentiation score of different cell lines using a similar strat-
egy as previously employed20. At least 100 ng of RNA was collected
from candidate iPSCs and known hESCs and gene expression
measured using a custom codeset (Pluri25) for the NanoString
nCounter system. All cell lines in the analysis contained at least
2 replicates. For a candidate iPSC line, a t-score (moderate t-test)
for the expression level of each gene in the codeset (considering
all replicates) was calculated and compared to the distribution of
expression levels of that gene amongst 15 reference hESC lines,
known to be pluripotent. Both pluripotency and differentiation
score were then defined as the median t-score within the set of
pluripotency marker genes (NANOG, POU5F1, LIN28, ZFP42,
SOX2) and differentiation marker genes (ANPEP, NR2F2, AFP,
SOX17). High or low median t-scores indicate a higher or lower
expression for a gene set compared to the pluripotent reference.
Scorecard differentiation propensity analysis. To assess the
differentiation potential of derived iPSC lines in a quantitative
and scalable manner, the scorecard methodology developed in
was used20, albeit with several small modifications. For each cell
line, least 100 ng of RNA was collected following 16 days of EB
growth and gene expression measured using a custom NanoString
codeset (3GL), containing probes for the three germ-layer marker
genes (EC = ectoderm, ME = mesoderm, EN = endoderm) as
previously described20. All cell lines in the analysis contained
at least 2 replicates. Data was normalized and a differentiation
propensity for the three germ layers was computed as previously
- 13. ©2015NatureAmerica,Inc.Allrightsreserved.
doi:10.1038/nmeth.3507 nature methods
described, except for consistency in culturing conditions a newly
generated reference set of 10 established hESCs that were cultured
in the same manner as all other samples was used.
Variance analysis. To assess the degree of variability in EBs for
iPSC lines generated using different methods, cell lines were
grouped according to different derivation methods and the
standard deviations in gene expression measured for every gene.
A comparison of the distribution of gene expression standard
deviations between two cell line groups for 4 gene classes was
calculated (EC = ectoderm, ME = mesoderm, EN = endoderm,
All = several pluripotent markers, EC, ME and EN). To assess
the significance in the difference in standard deviation distri-
butions for these 4 gene classes between two cell line groups, a
Wilcoxon signed-rank test was used. This statistical method does
not assume an underlying distribution (non-parametric), and a
significant P value rejects the null hypothesis that the median of
two paired distributions is the same. The variance analysis was
carried out using just the first replicate for each cell line in order
to ensure that differences in method variances are not an artifact
of different number of replicates per sample. Variance analysis
was also repeated using all replicates and the differences that were
significant between no replicates remained significant with repli-
cates. All Statistical analysis was performed using custom R and
Matlab scripts as per previously published work20,41.
Cell line availability. Cell lines described in this text are anno-
tated in the repository database at http://nyscf.org/repository and
will be made available after request through our repository under
appropriate Materials Transfer Agreements.
39. Harris, P.A. et al. Research electronic data capture (REDCap)—a metadata-
driven methodology and workflow process for providing translational
research informatics support. J. Biomed. Inform. 42, 377–381 (2009).
40. Tyson, C. et al. Expansion of a 12-kb VNTR containing the REXO1L1 gene
cluster underlies the microscopically visible euchromatic variant of 8q21.2.
Eur. J. Hum. Genet. 22, 458–463 (2014).
41. R Development Core Team. R: A Language and Environment for Statistical
Computing (R Foundation for Statistical Computing, 2012).