SlideShare ist ein Scribd-Unternehmen logo
1 von 476
MBALN-670 Operations Management
Title of the topic 6
Resource Planning and Scheduling
Topic’s learning objectives
1. Identify and critique the strategic frameworks of operations
and quality
management within a global business environment.
2. Comprehensive knowledge of the main concept and methods
related to
designing and managing operations and supply chains.
3. Systematic application of a range of fundamental operational
improvement
concepts.
4. Critically evaluate the role of operations within different
business models /
functions..
Introduction
Learning Material
Start by flicking through the presentations, this will provide you
with a quick overview
of the topics. Pay particular attention to Resource Planning.
You will find these in the folder “presentations”.
There are various ways in defining an Enterprise resource
Planning System. This is
how it has been defined by American Inventory and Production
Control System
(APICS) dictionary:
“Enterprise Resource Planning: An accounting oriented
information system for
identifying and planning the enterprise-wide resources to make
ship and
account for customer orders.”
Again in Internet encyclopedia, it has defined as: “An enterprise
planning system is
an integrated computer based application used to manage
internal and external
resources, including tangible assets, financial resources,
material and human
resources”.
Basically, an ERP combines several traditional management
functions into a logical
integrated system and facilitate flow of information across these
functions. It is
designed to model and automate basic processes across the
organization over a
centralized database and eliminates the need of disparate
systems maintained by
various units of the organization.
Figure below shows how information is integrated in a typical
organization using a
ERP system.
ERP system is thus a mirror image of the major business
processes of an
organization.
Need for Enterprise Resource Planning - Why ERP?
Separate systems were being maintained during 1960/70 for
traditional business
functions like Sales & Marketing, Finance, Human Resources,
Manufacturing, and
Supply Chain Management. These systems were often
incongruent, hosted in
different databases and required batch updates. It was difficult
to manage business
processes across business functions e.g. procurement to pay and
sales to cash
functions. ERP system grew to replace the islands of
information by integrating these
traditional business functions.
The successful implementation of an ERP system will have
many advantages,
as indicated below:
system is
composed of various modules/ sub modules where a module
represents a
particular business component. If data is entered in one module
such as
receiving, it automatically updates other related modules such
as accounts
payable and inventory. This updating occurs at real time i.e. at
the time a
transaction occurs. Since, data needs to be entered only once at
the origin of
transaction, the need of multiple entries of the same data is
eliminated.
Likelihood of duplicate/ erroneous data is, therefore,
minimized. The
centralized structure of the data base also enable better
administration and
security provisions, which minimizes loss of sensitive data.
planning engines
and simulations functions, form integral part of an ERP system
which helps in
proper utilization of resources like materials, human resources
and tools.
Constrained based planning help in drawing appropriate
production
schedules, thereby improving operation of plant and equipment.
As a part of
MIS, an ERP system, contains many inbuilt standard reports and
also a report
writer which produce ad hoc reports, as and when needed.
provision of improved
planning, ERP system provides a tremendous boost to the
efficiency of day to
day and routine transactions such as order fulfillment, on time
shipment,
vendor performance, quality management, invoice
reconciliation, sales
realization, and cash management. Cycle time is reduced for
sales to cash
and procurement to pay sequences.
based on
processes of international best practices, which are adopted by
the
organizations during implementation. Department silos are
purged and
maverick practices are done away with. Because of top down
view available
to management, chances of theft, fraud and obsolescence are
minimized.
where
production units, distribution centers and corporate offices
reside in different
countries, organizations need multi currency, multi language
and multi
accounting modes, in an integrated manner. These provisions
are available in
most of the ERP systems, particularly in products offered by
tier 1 and tier 2
vendors. ERP vendors are also quick to adopt latest
technologies, from
mainframe to client server to internet. Unlike a bespoke system,
Upgrading to
latest technology for a running ERP system is uncomplicated,
involving mostly
adoption of service packs and patches.
Conclusion
Although ERP provides many advantages; its implementation is
a strategic decision,
involving significant resources (both financial and human),
proper evaluation and
business process re-engineering. There must be commitment
from all levels. A failed
implementation may lead to bankruptcy of an organization.
http://www.managementstudyguide.com/enterprise-resource-
planning.htm
http://www.managementstudyguide.com/enterprise-resource-
planning.htm
Video 10
Click on this link (also found on the VLE)
http://www.youtube.com/watch?v=PVRgIXLWDHs
Discussion Question 4
1. Describe enterprise resource planning and its role in an
organization.
2. Describe the basic modules of an ERP system.
3. Describe the evolution of ERP systems.
Resource Planning Within OM: How it all Fits Together
Enterprise resource planning provides a common database for
use by an
organization, its suppliers, and its customers. Second-generation
ERP systems are
designed to support supply chain management and e-commerce.
These systems
automate routine transactions and provide real-time information
to all members of
the enterprise. ERP systems typically have a production and
materials module (MRP
– materials resource planning) to determine what is needed, how
much is needed,
and when it is needed.
MRP reports are used by the production and inventory planners
to
(1) generate purchasing requisitions and
(2) develop schedules of different activities to be done on the
manufacturing floor.
Even though rough-cut capacity planning (RCCP) using MPS
data was done to
check for feasibility, it is still important to do capacity
requirements planning (CRP)
for any critical work centers (bottlenecks or potential
bottlenecks). CRP operates at a
greater level of detail than does RCCP, using information
generated by the MRP
http://www.youtube.com/watch?v=PVRgIXLWDHs
system. Production planners do this to make sure the detailed
schedule of
production is feasible.
Resource planning is designed to ensure that the right materials,
in the right
quantities, are available at the right time. And to ensure that the
right job is being
done on the right equipment.
Resource Planning Across the Organization
Since MRP determines the quantity and timing of materials
needed, it affects several
functional areas in the company. Let's first look at how each
functional area is
affected by MRP and then consider the effects of ERP.
Accounting calculates future material commitments based on
MRP output.
Accounting then develops cash flow budgets and the inventory
investment to support
the current MPS. With a common database, accounting should
be able to determine
the exact status of outstanding orders, including cost, quantity,
and delivery date.
Since there is a common database, discrepancies between
supplier and
manufacturer should be reduced.
Marketing is primarily concerned with the MPS, which
identifies when finished goods
will be completed. MRP reveals potential material shortages
that directly affect
marketing since the shortages may delay product completion.
Marketing can also
use MRP for allocating scarce materials to maximize customer
service. One major
advantage of ERP is that marketing can track actual sales at the
final product level
(using POS) to determine what actions, if any, need to be taken
to maximize
customer service.
Information systems maintains MRP, which is a large database
that includes the
BOM, the inventory records, and the MPS. Minimizing errors in
the database is
essential to producing useful reports. ERP will help IS by using
a single integrated
database for both internal and external members of the supply
chain.
Purchasing uses the planned orders generated by MRP to
evaluate the feasibility of
long-term or blanket contracts and to determine delivery need.
The lead times that
are input into MRP often come directly from purchasing. ERP
will facilitate supplier-
managed inventory approaches and reduce transaction costs for
purchasing.
Manufacturing uses the output generated by MRP to develop
daily manufacturing
schedules. MRP ensures that the right materials in the right
quantity are available to
support the MPS. Manufacturing also uses MRP to allocate
scarce materials. ERP
will provide manufacturing with improved insight into actual
customer demand. It
should increase the probability that manufacturing is working
on products actually
needed to satisfy customer demand.
In most manufacturing operations, production or inventory
control planners are
responsible for working with MRP. Planners are typically
responsible for certain
inventory items, including end items, subassemblies, and
components. Planners
check the MRP output for action notices related to the items for
which they are
responsible. Planners schedule, reschedule, and expedite
materials to support the
MPS. A planning position is often an entry-level job in the
materials field.
As companies continue to move toward ERP, all functional
areas will work from a
central database. The database gives all areas in the company
access to the same
information simultaneously and improves organizational
effectiveness.
Activity
ERP Providers – found on the VLE as last item
Assist in creating a glossary of ERP providers with a brief
description of
the product(s) they offer. What unique selling point do they
have?
Scheduling
A company's overall strategy provides the framework for
making decisions in many
operational areas. Companies differentiate themselves based on
product volume
and product variety. This differentiation affects how the
company organizes its
operations. A company providing a high-volume, standardized,
consistent-quality,
lower-margin product or service such as a commercial bakery or
a fast-food
restaurant focuses on product and layout. This type of operation
needs dedicated
equipment, less-skilled employees, and a continuous or
repetitive process flow.
Companies providing low-volume, customized, higher-margin
products or services,
such as a custom furniture maker or an upscale restaurant, focus
on process. They
need general-purpose equipment, more highly skilled
employees, and flexible
process flows. Each kind of operation needs a different
scheduling technique. Let's
look at high-volume operations first.
Discussion Question 5
1. Compare and contrast high-volume and low-volume
scheduling operations.
2. Describe a high-volume service operation and how
scheduling should be
done.
3. Describe a low-volume service operation and how scheduling
should be
done.
The Supply Chain Link
Enterprise resource planning provides the structure for common
databases across the organization, its suppliers, and its
customers. Suppliers
can access the master production schedule (MPS) to see
projected build
dates for products that use materials supplied by them. The
current trend is to
integrate e-commerce and ERP systems. Tangible benefits of an
ERP system
include reduced inventory levels, reduced staffing, improved
order launching,
reduced IT and purchasing costs, improved cash flow, and
increased profits.
Intangible benefits include improved visibility of system
demand, improved
customer responsiveness, and improved flexibility. Enterprise
resource
planning systems provide the structure needed for effective
supply chain
management.
Further Reading
1. What are the inputs of operations scheduling
http://www.mbaofficial.com/mba-courses/operations-
management/what-are-
the-inputs-of-the-operations-scheduling/
2. Reid R., Operations Management, 4
th
Edition, 2011, Wiley Publishers
Topic’s summary
Enterprise resource planning (ERP) is software designed for
organizing and
managing business processes by sharing information across
functional areas using
a common database and a single computer system. ERP systems
typically have
modules for finance and accounting, sales and marketing,
production and materials
management, and human resources.
First-generation ERP systems provide a single interface for
managing routine
activities performed in manufacturing. Second-generation ERP
systems or SCM
software is designed to improve decision making in the supply
chain. The current
trend is integrating e-commerce and ERP systems.
http://www.mbaofficial.com/mba-courses/operations-
management/what-are-the-inputs-of-the-operations-scheduling/
http://www.mbaofficial.com/mba-courses/operations-
management/what-are-the-inputs-of-the-operations-scheduling/
http://www.mbaofficial.com/mba-courses/operations-
management/what-are-the-inputs-of-the-operations-scheduling/
Tangible benefits from ERP systems include reductions in
inventory and staffing,
increased productivity, improved order management, quicker
closing of financial
cycles, reduced IT and purchasing costs, improved cash flow
management, and
increased revenue and profits. Intangible benefits include
improved visibility of
corporate data, improved customer responsiveness, and
improved flexibility. The
cost of ERP systems ranges from hundreds of thousands of
dollars to several million
dollars.
Material requirements planning (MRP) systems are designed to
calculate material
requirements for items with dependent demand. MRP systems
use backward
scheduling to determine when each activity starts so that the
finished product or
service is completed on time.
Independent demand is the demand for finished products,
whereas dependent
demand is demand that is derived from finished products. MRP
systems use
dependent demand.
The objectives of MRP are to determine the quantity and timing
of material
requirements and to keep schedule priorities updated and valid.
MRP determines
what to order, how much to order, when to place the order, and
when to schedule
the order's arrival. It maintains priorities by recognizing
changes in the operations
environment and making the necessary adjustments.
MRP needs three inputs: the authorized MPS, the BOM file, and
the inventory
records file. The MPS is the planned build schedule, the BOM
file shows the
materials needed to build an item, and the inventory records file
shows the inventory
on hand.
Once the MPS has been input, MRP checks the inventory
records to determine if
enough end-item inventory is available. If sufficient end item
inventory is not on
hand, MRP checks the end item's BOM file to determine what
materials are needed
and in what quantities. The MRP system then generates planned
replenishment
orders.
Action notices show when to release planned orders, reschedule
orders, or adjust
due dates. They allow the planner to use the MRP output
information effectively.
Different lot size rules are used with MRP systems to generate
different order
quantities and order frequencies. The lot-for-lot (L4L) rule
always minimizes
inventory investment but maximizes ordering costs. A cost
comparison shows the
effect of using different lot sizing rules.
Planned orders generated by MRP, plus any open shop orders,
are inputs to
capacity requirements planning (CRP). CRP checks to see if
available capacity is
sufficient to complete the orders scheduled in a particular work
center during a
specific time period.
Different kinds of environments need different scheduling
techniques. Scheduling in
the high-volume environment is typically done through line
design and balancing.
Scheduling in a low-volume environment typically involves the
use of priority rules. In
this environment, Gantt charts are often used to view the
workload and jobs in
process.
Shop loading techniques include infinite and finite loading.
Infinite loading schedules
include jobs without capacity constraints. Finite loading loads
jobs up to a
predetermined capacity level. Loading can be done using
forward or backward
scheduling. Forward scheduling starts the job as soon as
possible, whereas
backward scheduling works back from the due date.
Priority rules are used to make scheduling decisions. SPT
always minimizes mean
job flow time, mean job lateness, and average number of jobs in
the system. FCFS is
considered one of the fairest priority rules. Rules related to due
dates tend to
minimize the maximum tardiness of the jobs. Priority rules need
to support
organizational objectives.
Performance measurements reflect the priorities of the
organization. Mean job flow
time, mean job lateness, mean job tardiness, makespan, and the
average number of
jobs in the system measure the effectiveness of schedules.
Johnson's rule is an effective technique for minimizing
makespan when two
successive workstations are needed to complete the process.
When scheduling bottleneck systems, the basic principles of
OPT apply. The theory
of constraints expands OPT into a managerial philosophy of
continuous
improvement.
Service organizations use different scheduling techniques such
as appointments,
reservations, and posted schedules for effective use of service
capacity.
A method developed by Tibrewala, Phillippe, and Brown
constructs workforce
schedules when a company uses full-time employees, operates
seven days each
week, and gives its employees two consecutive days off.
Discussion Questions:
1. Describe some common differences between Western and
Eastern approaches to negotiating.
2. What were some of the underlying dynamics that may have
contributed to the breakdown in negotiations?
3. In retrospect, what communication strategy could Nelson
have used to strengthen the relationship with San Yu?
MBALN-670 Operations Management
Title of the topic 5
Project Management Tools and Techniques
Topic’s learning objectives
1. Identify and critique the strategic frameworks of operations
and quality
management within a global business environment.
2. Comprehensive knowledge of the main concept and methods
related to
designing and managing operations and supply chains.
3. Systematic application of a range of fundamental operational
improvement
concepts.
4. Critically evaluate the role of operations within different
business models /
functions.
Introduction
Were any of you lucky enough to attend the Olympic Games
London 2012?
How was your experience? Fun, safe, affordable? Have you
considered what the
project plan might have looked like?
The whole project cost around £6bn and took 5 years.
One large-scale project to manage is the Olympic Games—a
project that
necessitates an exceptional amount of advance research and
planning. The logistics
and infrastructures of the city that hosts the Olympic Games and
the Organizing
Committee for the Games both have to oversee hundreds of
smaller projects that
culminate to ensure a successful run of the Olympics. From
tasks such as shipping
and receiving the tremendous amount of freight (for example,
broadcast equipment)
to facilitating the stay of the athletes, project managers must
pay close attention to
details. Of course, with such a large-scale event comes a myriad
of problems, such
as enough timely transportation, leadership changes, and
security concerns. Only
with extensive preparation can such a large-scale event be
successful
This table gives you an idea of the time scale.
More information is available:
http://www.london2012.com/spectators/venues/building-london-
2012/
Project management techniques are useful when a project
consists of several
activities, some simultaneous and others sequential. A project is
a unique, one-time
set of activities that is intended to achieve an objective in a
given time period. The
project is of some length (weeks, months, or even years) and
uses resources
(human, capital, materials, and equipment).
In the business world, projects can be designing new products,
installing new
systems, constructing new facilities, designing an advertising
campaign, designing
information systems, and developing company Web sites. In
politics, a project can
be designing a political campaign. Projects consist of several
tasks and take place in
a given time period. Every project has a life cycle.
This week you will study some of the tools and techniques
available to manage
projects of any size.
Learning Material
Before you embark on this week’s topic, please spend 30
minutes to study the
following 2 areas:
Gantt Charts
A Gantt chart is a type of bar chart, developed by Henry Gantt,
that illustrates a
project schedule. Gantt charts illustrate the start and finish
dates of the terminal
elements and summary elements of a project. Terminal elements
and summary
elements comprise the work breakdown structure of the project.
Some Gantt charts
also show the dependency (i.e., precedence network)
relationships between
http://www.london2012.com/spectators/venues/building-london-
2012/
activities. Gantt charts can be used to show current schedule
status using percent-
complete shadings and a vertical "TODAY" line as shown here.
Source:
http://en.wikipedia.org/wiki/Gantt_charthttp://www.netmba.com
/operations/project/gantt/
A simple explanation can be found on the following link. Also
Gantt charts are
covered in the eBook under chapter
Gantt charts can be constructed with Microsoft Excel, but for
larger and more
complex planning Microsoft Project is used.
Video 7
How to create a Gantt Chart In Microsoft Project
http://www.youtube.com/watch?v=inCkcgRCFGM
Video 8
How to create a Gantt Chart in Excel 2010
http://www.youtube.com/watch?v=sA67g6zaKOE
http://en.wikipedia.org/wiki/Gantt_chart
http://www.youtube.com/watch?v=inCkcgRCFGM
http://www.youtube.com/watch?v=sA67g6zaKOE
Time Schedules
The following information is taken from your eBook Chapter 11
Setting Standard Times
Among the commonly used processes for setting standard times
are the time study,
elemental time data, predetermined time data, and work
sampling. The time study
dates back to Frederick Winslow Taylor in the late nineteenth
century.
How to Do a Time Study
The time study sets a standard time based on timed observations
of one employee
taken over a number of cycles. A cycle includes all the elements
of the job. This
standard time is applied to all workers doing the job. Table 11-2
shows the steps in a
time study.
Table 11-2 Procedure for a Time Study
Now let's look at these steps in detail.
Step 1. As an individual, you set standards for yourself based on
the tasks that
are typical of your workday. The same is true for your company:
you base
standard times on the routine, labour-intensive jobs rather than
one-of-a-kind
jobs. Use this criterion for choosing your time-study job in Step
1.
Step 1. Choose the job for the time study.
Step 2 Tell the worker whose job you will be studying
Step 3. Break the job into easily recognizable units
Step 4. Calculate the number of cycles you must observe.
Step 5. Time each element, record the times, and rate the
worker's
performance.
Step 6. Compute normal time. NT = (MOT) (PRF) (F)
Step 7. Compute the standard tune. ST = (NT) (AF)
Step 2. It is also important to inform the employee in advance
that you will be
making a time study of the job. Be sensitive to how the
employee will feel as you
time performance.
Step 3. To break a job down into easily recognizable elements,
think about
making a hand-tossed pizza:
1. Find the right-sized ball of dough (this depends on the pizza
size).
2. Flatten out the dough.
3. Spin and toss the dough until it is the size you want.
4. Put the pizza on the working area.
5. Add sauce.
6. Add cheese.
7. Add additional toppings.
8. Put the pizza in the oven and bake.
Each of these elements has a clear starting and ending point,
and you cannot
break it down any further.
Step 4. When making a time study, you need to know how many
cycles, or how
many times, you must observe the worker to ensure the results
you want. The
number of cycles is a function of the variability of observed
times, the desired
level of accuracy or precision, and the desired level of
confidence for the
estimated standard times. We often express the desired accuracy
level as a
percentage of the mean observed times. For example, we might
want an
accuracy level so that the standard time is within 10 percent of
the true mean of
the time it takes to do the job.
The formula for determining the number of observations needed
is
Continue reading from Chapter 11 to obtain the full calculations
and method.
Project Life Cycle
Projects vary in terms of objectives, but each project has a
common life cycle or
sequence of activities. The life cycle begins with an initial
concept, followed by a
feasibility study, the planning of the project, the execution of
the plan, and finally the
termination of the project. Let's look at each phase of a project
life cycle.
Conception
The concept might be the company's decision to launch a new
product, implement a
new information system, or become involved in e-commerce. In
politics, the concept
might be a candidate's decision to run for office.
Feasibility Analysis or Study
Evaluate expected costs, benefits, and risks of the project. For
the company
launching a new product, a feasibility study means examining
the potential market,
the market share, and profits for the new product compared to
the costs. In politics, a
feasibility study is a candidate's assessment of the resources
needed to run a
successful political campaign and the benefits of elected office.
Planning
Analyze the work to be done and develop time estimates for
completing each of the
activities. For example, the company must design the new
product; source and order
the materials, equipment, and tools; choose the process to use;
design the layout;
write the job instructions; do a pilot run; evaluate the process
and the product design;
and transition the product to manufacturing. In politics,
planning might include
deciding how to raise funds, schedule personal appearances and
debates, handle
public relations, and adopt policy positions.
Execution
Carry out the activities that make up the project. In business,
the execution of the
project entails completing the product design, obtaining the
materials and equipment
needed, setting up the process, writing job instructions, and
making the product. For
a political candidate, execution includes fund-raising, making
public appearances,
and showcasing the political message.
Termination
End the project. After this date, resources can be used for
different activities. In
business, termination means product design engineers work on
new products,
purchasing agents can return to routine activities or a new
project, and
manufacturing engineers work on new projects. For a political
candidate, termination
means serving in an elected office or looking for a new job. See
the below table for a
summary of these project life-cycle phases.
Concept Identify the need for the project.
Feasibility analysis or
study
Evaluate costs, benefits and risks.
Planning Decide who does what, how long it should take, and
what you need to do it.
Network Planning Techniques
Program evaluation and review technique (PERT) and critical
path method (CPM)
date back to the 1950s. PERT was originally developed to plan
and monitor the
Polaris missile, an extremely large project using over 3000
contractors and involving
thousands of activities. PERT is credited with reducing the
project duration by two
years. Because of its success, most government contracts still
require the use of
PERT or a similar technique. CPM was initially developed to
plan and coordinate
maintenance projects in chemical plants.
The benefits of network planning techniques include the
following:
• Graphical display of the project, including the relationships
and sequence of
activities.
• Estimate of the expected project length.
• Method for determining which activities are critical to the
timely completion of
the project and are therefore included in the critical path.
• Method for determining the amount of slack associated with
individual project
activities.
Estimating The Probability Of Completion Dates
An advantage of using probabilistic time estimates is the ability
to predict the
probability of project completion dates. We learned how to
calculate the expected
time for each activity with the three time estimates provided.
Now we need to
calculate the variance for each activity. The variance of the beta
probability
distribution for each activity is
When you know the expected completion time of each path and
its variance, you can
determine the probability of specific completion dates. For
example, you may want to
know the probability of completing the project in 48 weeks. We
can use the following
formula to determine the probability of finishing each of the
paths at a specified date:
Execution
Termination
Do the project.
End the Project.
or
For a particular path through the project, the z value shows the
path's number of
standard deviations that the specified time is past the expected
path completion
time. A negative z value shows that the specified time is earlier
than the expected
path completion time. After calculating the z value, you can
look it up in Appendix B
to determine the probability of finishing the path by the
specified time. Note that the
probability of finishing the path by the specified time equals the
area under the
normal curve to the left of z, as shown in Figure 16-12.
Reducing Project Completion Time
You may need to reduce the time you spend finishing a
particular project because of
deadlines, promised completion dates, penalty clauses for late
completion, or the
need to put resources on a new project. When you plan a
project, you make time
estimates based on normal procedures and resources. However,
you may be able to
speed up a project by making additional resources available. For
example, your
company could have materials shipped via premium rather than
normal
transportation to get the materials faster and the activity
finished sooner. You could
authorize overtime to speed up an activity. Another possibility,
as is done in highway
construction, is to bring in lights so workers can work through
the night and minimize
traffic disruptions. Whatever the method, you can often reduce
the time needed to
finish an activity.
Crashing Projects
At the same time that you shorten a project's duration, you also
need to minimize the
additional expense. We call shortening a project crashing the
project. To crash the
project and minimize expense, you need additional information
about your project
activities.
Project management techniques provide a structure for the
project manager to track
the progress of different activities required to complete the
project. Particular
concern is given to critical path (the longest connected path
through the project
network) activities. Any delay to a critical path activity affects
the project completion
time. These techniques indicate the expected completion time
and cost of a project.
The project manager reviews this information to ensure that
adequate resources
exist and that the expected completion time is reasonable. If the
expected
completion date has a high probability of exceeding a
contractual due date and
incurring penalty costs, the project manager evaluates different
methods for crashing
the project (reducing project completion time). This evaluation
is used to
economically justify the application of more resources or to
acknowledge a high
probability of facing penalty costs. The project manager also
looks at the resource
load profile in an attempt to level resource requirements for the
project.
After resolving the issue of resources, the project manager
tracks the progress of the
project. Once the earliest and latest start and finish times are
determined, the
The Critical Chain Approach
The critical chain approach is to get projects done faster and
more consistently at or before the
project due date. The focus is on the final due date rather than
on individual activities or project
milestones. The idea of the critical chain is that project
activities are uncertain. Because of this
uncertainty, we add safety time to project time estimates. In
some cases, the safety time added
exceeds 200 percent of the work time estimate.
The critical chain, focuses on keeping the bottleneck busy, we
can put time buffers before
bottlenecks in the critical path. The feeding buffer protects the
critical path from delays in
noncritical paths. When the delay exceeds the feeding buffer,
the project completion date is still
protected by the project buffer. (For more information, see
Critical Chain by Eliyahu M. Goldratt.)
http://www.goldratt.co.uk/resources/critical_chain/index.html
Video 9
http://www.youtube.com/watch?v=BRMDCRPGYBE
Project Management within OM: How it all Fits Together
http://www.goldratt.co.uk/resources/critical_chain/index.html
http://www.youtube.com/watch?v=BRMDCRPGYBE
production and material planners order materials and schedule
required operations.
The project manager interacts with the people responsible for
different project
activities and informs them of any proposed project schedule
changes.
Project Management OM Across The Organization
Since projects tend to be long term and consume a company's
resources, functional
areas through the company work with expected completion
dates, resource
requirements, and the consequences of activity delays. Let's
look at how the
functional areas use project management information.
Accounting uses project management information to provide a
time line for major
expenditures associated with the project. Accounting measures
actual cost
performance against planned costs to calculate profits.
Accounting also calculates
the cost benefit of crashing a particular project.
Marketing uses project management information to monitor the
progress of a project
and to provide honest and realistic updates to the customer. The
project schedule
allows marketing to evaluate whether or not to crash a project.
Information systems develop and maintain the software that
supports project
management. Choosing, installing, and training users in the
appropriate software is
vital to successful project management.
Purchasing uses project management information to deal with
project delays by de-
expediting items and rescheduling these items for later delivery.
This allows the
company to keep a lower inventory investment. Purchasing can
also suggest when
to avoid late deliveries to keep the project on schedule and how
to reduce delivery
time to help put a project back on schedule.
Operations uses project management information to monitor the
progress of
activities on and off the critical path and to manage resource
requirements in terms
of the quantity and time needed for operations. Within an
organization, the project
manager or an assistant may develop the project schedule,
typically using software
for projects with many activities. Project managers can be
product managers,
manufacturing engineers, operations analysts, or office
managers. Project
management is a function not only of manufacturing companies
but of service
organizations too. Suppose you are planning the worldwide tour
of a major art
exhibit. Project scheduling techniques will help you effectively
manage the many
activities in this and other similar projects for your
organization.
The Supply Chain Link
Project management provides a structure to track the progress of
a project. Any
delays in an activity on the critical path delay the completion
date for the entire
project. Projects, such as introducing new products, can be
undertaken by a
supply chain. Communication among members of the chain to
ensure a timely
completion of the project is critical. Given that members of the
supply chain
share information, as well as a common database, all members
should have
real-time access to the project's progress. Any delays should be
communicated
throughout the chain. The project management approach
indicates the timing
and the quantity of resources needed. For manufacturing, this
input is needed
by the master production scheduler and is used to develop a
valid MPS.
Subsequently, this is input into the MRP system to develop the
planned orders
necessary to support the project. Project tracking allows supply
chain members
to make changes as needed without surprising other members of
the chain, thus
increasing the chances of completing the project on schedule.
For service projects, the input is used by the project manager to
develop the
project structure. The project manager ensures that members are
aware of
progress in the service project and the impact of any delays.
Think Theory 5
Activity Activity Time (weeks) Immediate predecessor(s)
A 3 none
B 4 A
C 2 B
D 5 B
E 4 C
F 3 D
G 2 E, F
1. Construct a network diagram using AON notation
2. Using the network diagram constructed
(a) Calculate the completion time for the project.
(b) Determine which activities are included on the
critical path.
Summary
A project is a unique, one-time event of some duration (weeks,
months, or even
years) that consumes resources (human, capital, materials, and
equipment capacity)
and is designed to achieve an objective in a given time period.
In business, projects
can be designing new products, installing new systems,
constructing new facilities,
mounting advertising campaigns, designing information
systems, and developing
company Web pages. In politics, a project can be designing a
political campaign.
Each project goes through a five-phase life cycle: concept,
feasibility study, planning,
execution, and termination. In the concept phase, we identify
the need for the
project. With the feasibility study, we evaluate expected costs,
benefits, and risks.
Planning consists of calculating the work and the time to do it;
execution is doing the
work; and termination is finishing the project.
Two network planning techniques are PERT and CPM. PERT
uses probabilistic time
estimates. CPM uses deterministic time estimates.
PERT and CPM determine the critical path of the project and
the estimated
completion time. On smaller projects, we determine completion
time by evaluating
each connected path through the network. On larger projects,
software programs are
available to identify the critical path.
PERT uses probabilistic time estimates to determine the
probability that a project will
be done by a specified time. We calculate a z value and then
determine the
probability that the critical path and other near-critical paths
will be completed by a
given date.
To reduce the length of a project, we need to know the critical
path and the cost of
reducing individual activity times. Crashing activities that are
not on the critical path
typically does not reduce project completion time.
The critical chain approach removes excess safety time from
individual activities and
creates a project buffer at the end of the critical path. Feeder
buffers are used on
noncritical paths merged with the critical path.
Practical Questions
The “problems” within chapter 16 are good practice. The
answers are given for most
of them; I have the rest, let me know if you need any in
particular. Spend 20 minutes
to go through all these problems.
Discussion Question
There will be no discussion question this week. Spend your time
working on the
assignment and the practical problems.
Article to read
This web site had some interesting blogs. Check out this blog
“How to Avoid Project
Burnout”, less than 5 minutes reading.
http://www.projectsmart.co.uk/how-to-avoid-project-
burnout.html
E Reading References
1. http://www.netmba.com/operations/project/gantt/ - Gantt
Charts
2. Reid R., Operations Management, 4
th
Edition, 2011, Wiley Publishers
Think Theory Ideas -
Solution
s
1.
2.
a. Project completion time = 17 weeks
b. Critical activities: A, B, D, F, G
http://www.projectsmart.co.uk/how-to-avoid-project-
burnout.html
http://www.netmba.com/operations/project/gantt/
MBALN-670 Operations Management
Title of the topic 4
Inventory Management – inclusive of Lean Systems (JIT) and
Forecast and Demand
Planning.
Topic’s learning objectives
1. Identify and critique the strategic frameworks of operations
and quality
management within a global business environment.
2. Comprehensive knowledge of the main concept and methods
related to
designing and managing operations and supply chains.
3. Systematic application of a range of fundamental operational
improvement
concepts.
4. Critically evaluate the role of operations within different
business models /
functions.
Introduction
This week we will study how organisations use inventory
management concepts as
part of their operational strategy. The material is broken down
into 3 parts.
Part 1 - Lean Systems / Just in Time is the simplest form means
getting the right
quantity of goods at the right place and at the right time. The
goods arrive just-in-
time, which is where the term JIT comes from. JIT considers
reducing waste.
We will look at how JIT is connected to the Total Quality
Management strategies of
the business.
Part 2 - We will identify principles of forecasting and demand
planning and
observing the steps involved in the forecasting process and the
different types of
forecasting methods.
Part 3 – Effective Inventory Management is a crucial aspect of a
successful
business practice. We will explore key business practises and
principles to carefully
balance and manage inventory (goods, raw materials and
finished products)
Learning Material
Part 1 - Lean Systems / JIT Systems
The philosophy of JIT originated in Japan. After World War II,
the Japanese set
themselves the goal of strengthening their industrial base, which
included full
employment and a healthy trade balance. Just-in-time (JIT)
developed out of the
nation's need to survive after the devastation caused by the war.
Although many
authors say that the origins of JIT can be traced back to the
early 1900s, no one can
argue that the philosophy gained worldwide prominence in the
1970s. It was
developed at the Toyota Motor Company, and the person most
often credited with its
development is Taiichi Ohno, a vice president of the company.
JIT helped propel
Toyota into a leadership position in the areas of quality and
delivery. Since then, JIT
has been widely adopted in all types of industries and has been
credited with
impressive benefits, including significant reductions in
operating costs, improved
quality, and increased customer responsiveness. Companies
such as Honda, GE,
Ford, Boeing, Lockheed Martin, Hewlett-Packard, and IBM are
among those that
have made JIT part of their operations. Even the retailer Zara
relies on JIT.
The central belief of the JIT philosophy is elimination of waste,
but there are other
beliefs that help define JIT philosophy. These include a broad
view of operations,
simplicity, continuous improvement, visibility, and flexibility.
Next we look more
closely at each of these beliefs.
Eliminate Waste
The underlying premise of JIT is that all waste must be
eliminated. Many think that
the roots of the philosophy can be traced to the Japanese
environment, which lacks
space and natural resources. As a result, the Japanese have been
forced to learn to
use all their resources very efficiently, and waste of any kind is
not tolerated. In JIT
waste is anything that does not add value. Types of waste can
include material, such
as excess inventory to protect against uncertain deliveries by
suppliers or poor
quality. Waste can be equipment that is used as a backup
because regular
equipment is not maintained properly. Other types of waste
include time, energy,
space, or human activity that does not contribute to the value of
the product or
service being produced.
The concept of waste addresses every aspect of the organization
and has a far-
reaching impact. For example, waste can be found in the
production process itself,
and JIT requires perfect synchronization in order to eliminate
waiting and excess
stock. Waste is also found in improper layout that necessitates
the transportation of
goods from one part of the facility to another. JIT requires a
streamlined layout
design so that resources are in close proximity to one another
and material handling
is kept to a minimum. Also, JIT requires compact layouts and
increased visibility so
that everyone can see what everyone else is doing. Waste can
also take the form of
poor quality, because scrap and rework cost money and add no
value. Total quality
http://edugen.wileyplus.com/edugen/courses/crs5658/reid5049/r
eid5049c07/reid5049/reid5049c07/reid5049c07xlinks.xform?id=
reid5049c07-tdef-0005
management (TQM) programs thus are an integral part of JIT.
Waste is also found in
unnecessary motion, and JIT requires studying processes to
eliminate unnecessary
steps.
A Broad View of Operations
Part of the philosophy of JIT is that everyone in the
organization should have a broad
view of the organization and work toward the same goal, which
is serving the
customer. In traditional organizations, it is very easy for
employees to focus
exclusively on their own jobs and have a narrow view of the
organization that
includes only their assigned tasks. Companies whose employees
have a narrow
view become production-oriented, forgetting that individual
tasks and procedures are
important only if they meet the overall goals of the company.
One example is an
employee who will not help a customer with a problem, saying,
“It's not my job.” This
might occur at a grocery store when a customer asks for the
location of an item from
an employee who is “only responsible for stocking shelves.” A
broad view of
operations involves understanding that all employees are
ultimately responsible for
serving the customer.
Simplicity
JIT is built on simplicity—the simpler the better. JIT
encourages employees to think
about problems and come up with simple solutions. Although
this may seem easy
and crude, it is actually quite difficult. It is often tempting to
solve an organizational
problem using a complex and perhaps expensive method. It is
far more difficult to
think of a simple solution that goes directly to the root of the
problem. The value of
simple solutions is demonstrated by a company whose delivery
truck was lodged in a
passageway because it was too high to pass through. Many
costly and complex
solutions were being considered, such as getting a smaller truck
or expanding the
height of the doorway. After a bit of thought, an employee came
up with a simple
solution: reduce the air in the tires to bring down the height of
the truck. The solution
worked.
Continuous Improvement
A major aspect of the JIT philosophy is an emphasis on quality.
Continuous
improvement, called kaizen by the Japanese, in every aspect of
the operation is a
cornerstone of this philosophy. Continuous improvement applies
to everything from
reducing costs to improving quality to eliminating waste.
Food for Thought
To understand the full impact of continuous improvement, try
answering this
question: When has JIT been implemented fully? The answer:
Never. The reason is
that an organization is never perfect and can always be
improved in some way.
A number of companies are utilizing a powerful JIT approach
called the “kaizen
blitz.” This is an improvement tool that utilizes cross-functional
teams to plan and
deliver improvements to specific processes during two- or
three-day marathon
http://edugen.wileyplus.com/edugen/courses/crs5658/reid5049/r
eid5049c07/reid5049/reid5049c07/reid5049c07xlinks.xform?id=
reid5049c07-tdef-0006
http://edugen.wileyplus.com/edugen/courses/crs5658/reid5049/r
eid5049c07/reid5049/reid5049c07/reid5049c07xlinks.xform?id=
reid5049c07-tdef-0006
http://edugen.wileyplus.com/edugen/courses/crs5658/reid5049/r
eid5049c07/reid5049/reid5049c07/reid5049c07xlinks.xform?id=
reid5049c07-tdef-0007
http://edugen.wileyplus.com/edugen/courses/crs5658/reid5049/r
eid5049c07/reid5049/reid5049c07/reid5049c07xlinks.xform?id=
reid5049c07-tdef-0008
http://edugen.wileyplus.com/edugen/courses/crs5658/reid5049/r
eid5049c07/reid5049/reid5049c07/reid5049c07xlinks.xform?id=
reid5049c07-tdef-0008
sessions. This process allows a small group of people to
concentrate on a bite-size
chunk of the problem for a short period of time. Companies find
that a kaizen blitz
can quickly deliver dramatic and low-cost improvements to
processes.
Visibility
Part of the JIT philosophy is to make all waste visible. Waste
can be eliminated only
when it is seen and identified. Also, if we see waste we can
come up with simple
solutions to eliminate it. When waste is hidden we forget about
it, which creates
problems.
Think about the closets in your home. Because the closet doors
are closed, we often
forget the clutter and junk we have inside. Now imagine that the
closet doors were
open and the inside was visible to us and everyone else.
Certainly it would remind us
that we need to eliminate the clutter.
JIT facilities are open and clean, with plenty of floor space.
There is no clutter, and
everyone can see what everyone else is doing. No one can hide
extra inventory in a
corner of his or her office or take a short nap in the afternoon.
Also, part of the JIT
philosophy is that a cluttered environment creates confusion and
disrespect toward
the workplace. By contrast, a clean and orderly environment
creates calm and clear
thoughts. Just because space is available, it should not
automatically be filled.
Visibility allows us to readily see waste. We can then eliminate
it.
Flexibility
JIT was based on the need for survival, and survival means
being flexible in order to
adapt to changes in the environment. A company can be flexible
in many ways. First,
flexibility can mean being able to make changes in the volume
of a product
produced. JIT accomplishes this by keeping the costs of
facilities, equipment, and
operations at such a low level that breaking even typically is
not a problem.
A second way in which a company can be flexible is by being
able to produce a wide
variety of products. Although this is difficult to achieve, JIT
systems are designed
with the ability to produce different product models with
different features through a
manufacturing process that can easily switch from one product
type to another by
flexible workers who can perform many different tasks. Part of
the JIT philosophy is
to design operations that are highly efficient but flexible in
order to accommodate
changing customer demands.
http://edugen.wileyplus.com/edugen/courses/crs5658/reid5049/r
eid5049c07/reid5049/reid5049c07/reid5049c07xlinks.xform?id=
reid5049c07-tdef-0009
http://edugen.wileyplus.com/edugen/courses/crs5658/reid5049/r
eid5049c07/reid5049/reid5049c07/reid5049c07xlinks.xform?id=
reid5049c07-tdef-0010
Figure 7-1 elements of JIT (WileyPlus)
JIT within the Organisation and Across other Functions
Accounting is strongly affected by JIT. Traditional accounting
systems generally
allocate overhead on the basis of direct labour hours. The
problem with this method
is that it does not accurately describe the actual use of overhead
by different jobs.
For example, jobs that are labour intensive in nature may be
assigned a
disproportionately high share of overhead. These numbers may
lead management to
make inappropriate decisions. JIT relies on activity-based
costing to allocate
overhead. In activity-based costing, specific costs are identified
and then assigned to
various types of activities, such as inspection, movement of
goods, and machine
processing. Overhead costs are then assigned to jobs depending
on how many
activities a particular job takes up.
Marketing plays a large role in JIT, as the interface with
customers becomes more
important. JIT focuses on customer-driven quality, not quality
as defined by the
producer. Marketing managers must understand customer needs
and ensure that
this information is passed on to operations managers for proper
design, production,
and delivery of the product or service.
Finance is responsible for approving and evaluating financial
investments. Switching
to a JIT system proves financially beneficial in the long run but
generally requires an
investment in resources. Included are hiring consultants,
training workers,
purchasing or modifying equipment, more record keeping, and
rearrangement of
facilities. Finance must evaluate these investments and measure
their performance,
which requires an understanding of JIT.
Engineering plays a major role in JIT. As we have seen in this
chapter, reduction of
setup time is critical to the success of JIT. It is up to
engineering to design machines
so as to reduce setup time and to design poka-yoke, or foolproof
devices that
prevent defects from occurring. Engineering is largely
responsible for designing the
mechanisms that enable JIT to function as desired. Without
engineering, true JIT
could not exist.
Information systems (IS) create the network of information
necessary for JIT to
function. JIT is based on the assumption that information about
quality, inventory
levels, order status, and product returns is available to everyone
in the organization.
This type of information needs to be readily available and up-
to-date. Otherwise, a
JIT system would come to a halt. Communication with suppliers
is another
prerequisite of JIT that requires a high-level information
system. JIT cannot function
without the ongoing involvement of IS. In turn, IS needs to
understand JIT
functioning and information requirements.
The Supply Chain Link
The concept of JIT naturally extends itself to the entire supply
chain. The philosophy of JIT teaches us that waste anywhere in
the
system hinders efficiency, doesn't provide value to the
customer, and
ultimately increases cost. Every organization is just one element
of an
entire supply chain system. As such, waste anywhere in the
supply
chain is ultimately passed down to other members of the chain
and the
final customer. Also recall that JIT views a company's suppliers
as the
external factory, focuses on building long-term relationships
with
suppliers, and promotes sharing data along the supply chain. In
fact, a
company's pull system cannot work properly unless its suppliers
are also
using it. Otherwise, the JIT system of the company would not be
able to
function properly, as there would be no guarantee of stable
deliveries.
Therefore, the principles of JIT need to be adopted by all
members of a
supply chain in order to have a full impact. This is often
referred to as a
lean supply chain.
Dell provides a good example of the impact JIT can have when
it is
implemented along the supply chain. The company has a build-
to-order
model that produces computers only when there is actual
customer
demand. Dell has implemented a JIT system throughout its
supply chain
and shares demand information with its suppliers. As a result,
Dell is
able to introduce new technologies in its computers much
quicker than
competitors because they are seamlessly available in the supply
chain.
Dell also works closely with its suppliers to reduce inventories,
align
processes, and eliminate waste across the supply chain. The
result has
been high responsiveness at a competitive price.
Discussion question 3 - JIT
Explain how you think JIT techniques can be used by the Food
and Beverage
Operations to meet guest needs for a variety of fresh foods in
just the right quantity
at just the right time.
Case Study
Mcdonalds uses JIT to reduce waste and keep costs low. Please
read the blog on
the page below. Otherwise, this can be found on the VLE.
Please contribute your views to this article as part of Discussion
4 – McDonalds
http://www.inventorymanagementreview.org/2005/11/mcdonalds
_a_gui.html
Part 2 - Principles of Forecasting
There are many types of forecasting models. They differ in their
degree of complexity,
the amount of data they use, and the way they generate the
forecast. However, some
features are common to all forecasting models. They include the
following:
1. Forecasts are rarely perfect. Forecasting the future involves
uncertainty.
Therefore, it is almost impossible to make a perfect prediction.
Forecasters know
that they have to live with a certain amount of error, which is
the difference
between what is forecast and what actually happens. The goal of
forecasting is to
generate good forecasts on the average over time and to keep
forecast errors as
low as possible.
2. Forecasts are more accurate for groups or families of items
rather than for
individual items. When items are grouped together, their
individual high and low
values can cancel each other out. The data for a group of items
can be stable
even when individual items in the group are very unstable.
Consequently, one can
obtain a higher degree of accuracy when forecasting for a group
of items rather
than for individual items. For example, you cannot expect the
same degree of
accuracy if you are forecasting sales of long-sleeved hunter
green polo shirts that
you can expect when forecasting sales of all polo shirts.
3. Forecasts are more accurate for shorter than longer time
horizons. The shorter
the time horizon of the forecast, the lower the degree of
uncertainty. Data do not
change very much in the short run. As the time horizon
increases, however, there
is a much greater likelihood that changes in established patterns
and relationships
will occur. Because of that, forecasters cannot expect the same
degree of forecast
accuracy for a long-range forecast as for a short-range forecast.
For example, it is
much harder to predict sales of a product two years from now
than to predict sales
two weeks from now.
Steps in Forecasting Process
Regardless of what forecasting method is used, there are some
basic steps that should
be followed when making a forecast:
http://www.inventorymanagementreview.org/2005/11/mcdonalds
_a_gui.html
1. Decide what to forecast.
Remember that forecasts are made in order to plan for the
future. To do so, we
have to decide what forecasts are actually needed. This is not as
simple as it
sounds. For example, do we need to forecast sales or demand?
These are two
different things, and sales do not necessarily equal the total
amount of demand for
the product. Both pieces of information are usually valuable.
An important part of this decision is the level of detail required
for the forecast
(e.g., by product or product group), the units of the forecast
(e.g., product units,
boxes, or dollars), and the time horizon (e.g., monthly or
quarterly).
2. Evaluate and analyze appropriate data.
This step involves identifying what data are needed and what
data are available.
This will have a big impact on the selection of a forecasting
model. For example, if
you are predicting sales for a new product, you may not have
historical sales
information, which would limit your use of forecasting models
that require
quantitative data.
3. Select and test the forecasting model.
Once the data have been evaluated, the next step is to select an
appropriate
forecasting model. As we will see, there are many models to
choose from. Usually
we consider factors like cost and ease of use in selecting a
model. Another very
important factor is accuracy. A common procedure is to narrow
the choices to two
or three different models and then test them on historical data to
see which one is
most accurate.
4. Generate the forecast.
Once we have selected a model, we use it to generate the
forecast. But we are
not finished, as you will see in the next step.
5. Monitor forecast accuracy.
Forecasting is an ongoing process. After we have made a
forecast, we should
record what actually happened. We can then use that
information to monitor our
forecast accuracy. This process should be carried out
continuously because
environments and conditions often change. What was a good
forecasting model in
the past might not provide good results for the future. We have
to constantly be
prepared to revise our forecasting model as our data change.
Forecasting methods
Now turn to your ebook, review the time series and casual
methods of
forecasting. The diagrams are useful to demonstrate how this is
done.
Part 3 - Inventory Management
Finally we explore Inventory Management.
Inventory comes in many shapes and sizes. Most manufacturing
firms have the
following types of inventory. Raw materials are the purchased
items or extracted
materials that are transformed into components or products. For
example, gold is a
raw material that is transformed into jewellery. Components are
parts or
subassemblies used in building the final product. For example, a
transformer is a
component in an electronic product. Work-in-process (WIP)
refers to all items in
process throughout the plant. Since products are not
manufactured instantaneously,
there is always some WIP inventory flowing through the plant.
After the product is
completed, it becomes finished goods—the bicycles, stereos,
CDs, and automobiles
that the company sells to its customers. Distribution inventory
consists of finished
goods and spare parts at various points in the distribution
system—for example,
stored in warehouses or in transit between warehouses and
consumers.
Maintenance, repair, and operational (MRO) inventory are
supplies that are used in
manufacturing but do not become part of the finished product.
Examples of MRO are
hand tools, lubricants, and cleaning supplies.
How Companies use Inventory Management
1. Anticipation or seasonal inventory
2. Fluctuation Inventory or Safety stock: buffer demand
fluctuations
3. Lot-size or cycle stock: take advantage of quantity discounts
or purchasing
efficiencies
4. Transportation or Pipeline inventory
5. Speculative or hedge inventory protects against some future
event, e.g. labor
strike
6. Maintenance, repair, and operating (MRO) inventories
Objectives of Inventory Management
Provide desired customer service level
o Customer service is the ability to satisfy customer
requirements
o Percentage of orders shipped on schedule
o Percentage of line items shipped on schedule
o Percentage of $ volume shipped on schedule
o Idle time due to material and component shortages
Provide for cost-efficient operations:
o Buffer stock for smooth production flow
o Maintain a level work force
o Allowing longer production runs & quantity discounts
Minimum inventory investments:
o Inventory turnover
o Weeks, days, or hours of supply
Customer service level examples
Percentage of Orders Shipped on Schedule
o Good measure if orders have similar value. Does not capture
value.
o If one company represents 50% of your business but only 5%
of your
orders, 95% on schedule could represent only 50% of value
Percentage of Line Items Shipped on Schedule
o Recognizes that not all orders are equal, but does not capture
$ value of
orders. More expensive to measure. Ok for finished goods.
o A 90% service level might mean shipping 225 items out of the
total 250
line items totaled from 20 orders scheduled
Percentage Of Dollar Volume Shipped on Schedule
o Recognizes the differences in orders in terms of both line
items and $
value
Follow the “Solved Demo Problem” within the Wileyplus
ebook. This will
demonstrate how the formulas are used for determining order
quantities.
Video 6
Eagle Ridge Spa Inventory Management
http://www.youtube.com/watch?v=rCrR3kckyvA
Also within Wiley Plus book
Article to Read
Further Reading
o Just in Time Inventory Management
http://accounting4management.com/just_in_time.htm
Think Theory 5
There will be no think theory exercises this week as I would
like you to focus on working
through the problems and formula I have guided you to within
your ebook.
http://www.youtube.com/watch?v=rCrR3kckyvA
http://accounting4management.com/just_in_time.htm
o Companies that use JIT management
o Harley Davidson
o Toyota Motor Company
o General Motors
o Ford Motor Company –
Review their websites to understand how they use JIT today.
o Read more at
http://accounting4management.com/just_in_time.htm#OdLquAm
S2AB6GCP
m.99
o What is Inventory Management -
http://merchantos.com/articles/inventory/what-is-inventory-
management/
Topic’s summary
JIT is a philosophy that was developed by the Toyota Motor
Company in the mid-
1970s. It has since become the standard of operation for many
industries. It focuses
on simplicity, eliminating waste, taking a broad view of
operations, visibility, and
flexibility. Three key elements of this philosophy are JIT
manufacturing, total quality
management, and respect for people.
JIT views waste as anything that does not add value, such as
unnecessary space,
energy, time, or motion.
Traditional manufacturing systems use “push” production,
whereas JIT uses “pull”
production. Push systems anticipate future demand and produce
in advance in order
to have products in place when demand occurs. This system
usually results in
excess inventory. Pull systems work backwards. The last
workstation in the
production line (or the customer) requests the precise amounts
of materials required.
JIT manufacturing is a coordinated production system that
enables the right
quantities of parts to arrive when they are needed precisely
where they are needed.
Key elements of JIT manufacturing are the pull system and
kanban production, small
lot sizes and quick setups, uniform plant loading, flexible
resources, and streamlined
layout.
JIT considers people to be the organization's most important
resource. All
employees are highly valued members of the organization.
Workers are empowered
to make decisions and are rewarded for their efforts. Team
efforts make possible
cross-functional and multilayer coordination.
http://accounting4management.com/just_in_time.htm#OdLquAm
S2AB6GCPm.99
http://accounting4management.com/just_in_time.htm#OdLquAm
S2AB6GCPm.99
http://accounting4management.com/just_in_time.htm#OdLquAm
S2AB6GCPm.99
http://merchantos.com/articles/inventory/what-is-inventory-
management/
JIT is equally applicable in service organizations, particularly
with the push toward
time-based competition and the need to cut costs.
JIT success is dependent on interfunctional coordination and
effort. Marketing must
work closely with customers to define customer-driven quality.
IS must design a
powerful information system. Engineering must develop
equipment with low setup
time and design jobs with foolproof devices. Finance must
monitor financial
improvements with realistic expectations. Accounting must
develop appropriate
costing mechanisms.
Forecasting
Three basic principles of forecasting are: forecasts are rarely
perfect; forecasts are
more accurate for groups or families of items rather than for
individual items; and
forecasts are more accurate for shorter than longer time
horizons.
The forecasting process involves five steps: decide what to
forecast; evaluate and
analyze appropriate data; select and test a forecasting model;
generate the forecast;
and monitor forecast accuracy.
Forecasting methods can be classified into two groups:
qualitative and quantitative.
Qualitative forecasting methods generate a forecast based on the
subjective opinion
of the forecaster. Some examples of qualitative methods include
executive opinion,
market research, and the Delphi method. Quantitative
forecasting methods are
based on mathematical modelling. They can be divided into two
categories: time
series models and causal models.
Time series models are based on the assumption that all the
information needed for
forecasting is contained in the time series of data. Causal
models assume that the
variable being forecast is related to other variables in the
environment.
There are four basic patterns of data: level or horizontal, trend,
seasonality, and
cycles. In addition, data usually contain random variation. Some
forecasting models
that can be used to forecast the level of a time series are naïve,
simple mean, simple
moving average, weighted moving average, and exponential
smoothing. Separate
models are used to forecast trend, such as trend-adjusted
exponential smoothing.
Forecasting seasonality requires a procedure in which we
compute a seasonal
index, the percentage by which each season is above or below
the mean.
A simple causal model is linear regression, in which a straight-
line relationship is
modelled between the variable we are forecasting and another
variable in the
environment. The correlation coefficient is used to measure the
strength of the linear
relationship between these two variables.
Three useful measures of forecast accuracy are mean absolute
deviation (MAD),
mean square error (MSE), and a tracking signal.
There are four factors to consider when selecting a forecasting
model: the amount
and type of data available, the degree of accuracy required, the
length of forecast
horizon, and patterns present in the data.
Inventory Management
Raw materials, purchased components, work-in-process (WIP),
finished goods,
distribution inventory and maintenance, repair and operating
supplies are all types of
inventory. Inventories have several uses: anticipation inventory
is built before it is
needed; fluctuation stock provides a cushion against uncertain
demand; cycle stock
is a result of the company's ordering quantity; transportation
inventory includes items
in transit; speculative inventory is a build-up to protect against
some future event;
and MRO inventory supports daily operations.
The objectives of inventory management are to provide the
desired level of customer
service, to allow cost-efficient operations, and to minimize
inventory investment.
Customer service can be measured in several ways, including as
a percentage of
orders shipped on schedule, a percentage of line items shipped
on schedule, a
percentage of dollar volume shipped on schedule, or idle time
due to material and
component shortages. Cost-efficient operations are achieved by
using inventory as
buffer stocks, allowing a stable year-round workforce, and
spreading the setup cost
over a larger number of units.
Inventory investment is measured in inventory turnover and/or
level of supply.
Inventory performance is calculated as inventory turnover or
weeks, days, or hours
of supply.
Relevant inventory costs include item costs, holding costs,
ordering costs, and
shortage costs. Holding costs include capital costs, storage
costs, and risk costs.
Ordering costs are fixed costs for placing an order or
performing a setup. Shortage
costs include costs related to additional paperwork, additional
shipping expense, and
the intangible cost of lost customer goodwill.
The ABC classification system allows a company to assign the
appropriate level of
control and frequency of review of an item based on its annual
dollar volume.
Cycle counting is a method for maintaining accurate inventory
records. Determining
what and when to count are the major decisions.
Retailers, wholesalers, and food service organizations use
tangible inventory even
though they are service organizations. Proper inventory control
and management for
these organizations often is the difference between a profit and
loss. Since the items
are often desirable, organizations must strive to reduce the
amount of theft by
customers and employees. Magnetic strips, security devices, and
surveillance
systems are all means of reducing inventory loss.
Lot-for-lot, fixed-order quantity, min-max systems, order n
periods, periodic review
systems, EOQ models, quantity discount models, and single-
period models can be
used to determine order quantities.
Ordering decisions can be improved by analyzing total costs of
an inventory policy.
Total costs include ordering cost, holding cost, and material
cost.
Practical considerations can cause a company to not use the
optimal order quantity,
that is, minimum order requirements.
Smaller lot sizes give company flexibility and shorter response
times. The key to
reducing order quantities is to reduce ordering or setup costs.
Calculating the appropriate safety stock policy enables
companies to satisfy their
customer service objectives at minimum cost. The desired
customer service level
determines the appropriate z value.
Inventory decisions about perishable products (like newspapers)
can be made using
the single-period inventory model. The expected payoff is
calculated to assist the
quantity decision.
PLEASE SCROLL DOWN FOR ARTICLE
This article was downloaded by: [Efstathiou, Victoria]
On: 9 March 2011
Access details: Sample Issue Voucher: Total Quality
Management & Business ExcellenceAccess Details:
[subscription number 934628027]
Publisher Routledge
Informa Ltd Registered in England and Wales Registered
Number: 1072954 Registered office: Mortimer House, 37-
41 Mortimer Street, London W1T 3JH, UK
Total Quality Management & Business Excellence
Publication details, including instructions for authors and
subscription information:
http://www.informaworld.com/smpp/title~content=t713447980
Application of the total quality management approach in a
Spanish
retailer: the case of Mercadona
Blanco Callejo Miguela; Gutierrez Broncano Santiagoa
a Departamento de Economía de la Empresa, Universidad Rey
Juan Carlos, Madrid, Spain
Online publication date: 14 December 2010
To cite this Article Miguel, Blanco Callejo and Santiago,
Gutierrez Broncano(2010) 'Application of the total quality
management approach in a Spanish retailer: the case of
Mercadona', Total Quality Management & Business Excellence,
21: 12, 1365 — 1381
To link to this Article: DOI: 10.1080/14783363.2010.530782
URL: http://dx.doi.org/10.1080/14783363.2010.530782
Full terms and conditions of use:
http://www.informaworld.com/terms-and-conditions-of-
access.pdf
This article may be used for research, teaching and private
study purposes. Any substantial or
systematic reproduction, re-distribution, re-selling, loan or sub-
licensing, systematic supply or
distribution in any form to anyone is expressly forbidden.
The publisher does not give any warranty express or implied or
make any representation that the contents
will be complete or accurate or up to date. The accuracy of any
instructions, formulae and drug doses
should be independently verified with primary sources. The
publisher shall not be liable for any loss,
actions, claims, proceedings, demand or costs or damages
whatsoever or howsoever caused arising directly
or indirectly in connection with or arising out of the use of this
material.
http://www.informaworld.com/smpp/title~content=t713447980
http://dx.doi.org/10.1080/14783363.2010.530782
http://www.informaworld.com/terms-and-conditions-of-
access.pdf
Application of the total quality management approach in a
Spanish
retailer: the case of Mercadona
Blanco Callejo Miguel∗ and Gutierrez Broncano Santiago
Departamento de Economı́a de la Empresa, Universidad Rey
Juan Carlos, Madrid, Spain
This current article analyses the successful application of the
total quality management
(TQM) model by a firm in the Spanish commercial distribution
sector. The TQM model
implies a strategic, proactive and global approach that could
prove appropriate in the
face of a turbulent and changing environment, such as the one
firms are currently
experiencing. This article uses case study methodology to
analyse the process by
which Mercadona has implemented its TQM model, which
involves different actions
oriented to satisfying the needs of customers, employees,
suppliers, society and
capital. Applying this model allowed Mercadona to overcome a
critical situation that
threatened its very survival in the early 1990s, and since then
the firm has bounced
back to a position of leadership in its sector. Its excellent
results and growth have
caught the attention of both academics and industry rivals, in
Spain and internationally.
Keywords: total quality management model; stakeholders;
satisfaction of
expectations; success; organisational excellence
Introduction
The case of Mercadona presented here is a good example of how
a firm has managed to
implement the total quality management (TQM) model in the
commercial distribution
sector. The introduction of this model was a strategic decision
taken by the firm’s president
in the early 1990s and, as a consequence, the company has been
able to differentiate itself
from its rivals and hence gain considerable competitive
advantage. This strategy has posi-
tioned Mercadona as the leading Spanish supermarket chain, as
well as the second fastest-
growing food retailer in the world (Deloitte, 2007).
This article describes the successful implementation of the TQM
model in Mercadona
and its outcome, which has been a new, remarkable and highly
effective way of conceiving
its business. The following section offers a brief theoretical
discussion of the comprehen-
sive TQM model and its orientation toward satisfying the wants
and needs of the firm’s
stakeholders. Later sections examine the empirical analysis,
which uses the case study
methodology. Mercadona’s project under the TQM paradigm, its
implications for the
firm’s five components (customers, employees, suppliers,
society and capital), and how
the firm tries to satisfy their needs and expectations are
described. The article ends with
the main conclusions and implications for managers.
ISSN 1478-3363 print/ISSN 1478-3371 online
# 2010 Taylor & Francis
DOI: 10.1080/14783363.2010.530782
http://www.informaworld.com
∗ Corresponding author. Email: [email protected]
Total Quality Management
Vol. 21, No. 12, December 2010, 1365 – 1381
D
o
w
n
l
o
a
d
e
d
B
y
:
[
E
f
s
t
a
t
h
i
o
u
,
V
i
c
t
o
r
i
a
]
A
t
:
0
9
:
1
4
9
M
a
r
c
h
2
0
1
1
The total quality management model
The quality management concept has evolved in recent years, at
the same time as the
environment has evolved, and business needs to adapt to the
changing environment
(Ciampa, 1992; De Jouslin De Noray, 1992; Gehani, 1993;
Ivancevich, Lorenzi,
Skinner, & Crosby, 1985; James, 1991; Schonberger, 1992).
This evolution in quality
management has led authors to conceive different approaches
that share the central
position of the quality concept, but that have progressively
become increasingly strategic,
broad and proactive (Camisón, González, & Cruz, 2006). In
fact, the concept of quality
management was treated only partially (Deming, 1982;
Feigenbaum, 1986; Hunter,
1999; Juran, 1994; O’Dell, 1996; Schein, 1997; Taguchi, 1987)
until the arrival of more
global approaches that led to the total quality management
(TQM) model in the mid-
1980s and 1990s (Deming, 1986; Sashkin & Kaiser, 1993;
Waldman, 1994). This
approach offers quality management a multidimensional content
that pursues the total
excellence of the organisation along the firm’s entire value-
creation chain (Black &
Porter, 1995; Dean & Bowen, 1994; Dean & Evans, 1994;
Deming, 1995; Douglas &
Judge, 2001; Ghobadian & Gallear, 2001; Van Der Wiele,
Williams, & Dale, 2000).
Thus, the current TQM model has an interdisciplinary and
integrative perspective that
considers technical, physical, human and leadership aspects
(Ciampa, 1992) and it is part
of the strategic management of the company (Luchs, 1986).
Introducing the model is the
direct responsibility of top management, which assumes a
leadership role that is vital for
its successful implementation and for improving the firm’s
results (Madu & Kuei, 1993).
Although TQM is a complex and ambiguous phenomena with
several distinct formu-
lations and labels (Amsden, Ferratt, & Amsden, 1996; Wicks,
2001) the literature have
looked for some commonalities that distinguish quality
improvement methods from
more traditional management practices (Dean & Bowen, 1994;
Spencer, 1994; Wicks,
2001). Evans (1992), in a definition accepted in some relevant
articles in the literature
(Handfield, Ghosh, & Fawcett, 1998; Larson & Sinha, 1995),
defines the TQM model as
a people-focused management system that aims at continual
increase of customer satisfac-
tion at continually lower real cost. Total Quality is a total
system approach (not a separate
area or programme) and an integral part of high-level strategy;
it works horizontally across
functions and departments, involves all employees, top to
bottom, and extends backwards
and forwards to include the supply chain and the customer
chain. Total Quality stresses
learning and adaptation to continual change as keys to
organisational success.
Starting from this definition, there are a set of core values of
the TQM model (Hellsten,
1997): orientation toward the external customer, orientation
toward stakeholders, internal
cooperation and teamwork, management’s leadership and
commitment, process- and
system-based management, orientation toward people or the
internal customer, learning,
innovation and continuous improvement, building alliances, and
external cooperation
and ethics (Black & Porter, 1996; Camisón et al., 2006;
Deming, 1986; Nayebpour &
Koehn, 2003; Pace, 1999; Raiborn & Payne, 1996; Steeples,
1994; Svensson & Wood,
2005; Wicks, 2001). Each of these principles is dealt with by
developing different
programmes in which all the firm’s employees participate. The
model has three aims: to
create value for all stakeholders; to gain competitive advantages
and achieve superior
income to competitors; and to produce a culture, organisation
and management style
that fosters commitment, participation and internal cooperation
(Camisón et al., 2006).
One of the fundamental aspects of the model is the relationship
with the organisation’s
stakeholders, with the objective being to achieve maximum
satisfaction of their expec-
tations (Lagrosen, 2001). This approach leads to the
implementation of the most advanced
1366 B.C. Miguel and G.B. Santiago
D
o
w
n
l
o
a
d
e
d
B
y
:
[
E
f
s
t
a
t
h
i
o
u
,
V
i
c
t
o
r
i
a
]
A
t
:
0
9
:
1
4
9
M
a
r
c
h
2
0
1
1
practices in human resources management, logistics, production,
relationship with suppli-
ers and customers, and organisational design. The aim is to
permanently stimulate the
commitment, participation and cooperation of all the firm’s
stakeholders. In this
respect, total quality is based on two considerations. First,
recognition that the firm has
social responsibilities to all its stakeholders – owners,
consumers, employees, suppliers
and society (Svensson & Wood, 2005; Vinten, 1998). And
second, that top management
needs the leadership skills required to motivate all stakeholders
to share its holistic vision
of the social contract and act accordingly (Laszlo, 1998).
In order to verify the application of the TQM model and observe
the initiatives put in
place within the framework of this model, this study uses the
exploratory case study as its
research methodology. The literature suggests that the choice of
research methodology is
contingent on the problems and questions being analysed and
the state of development
of the area of knowledge (Eisenhardt, 1989; Pettigrew, 1990;
Yin, 1994). Case study meth-
odology is suitable for this study because it fully satisfies Yin’s
(1994) premises. Yin rec-
ommends the methodology first, when the researcher aims to
test a theory that specifies a
particular set of results in a specific situation, and has
identified a firm in this situation. The
case could be a critical test of the theory and of its applicability
to the organisation. Second,
if the researcher aims to study some specific characteristics of a
rare, extraordinary or
extreme situation in which the organisation finds itself, they can
use this methodology to
compare or contrast. Finally, the researcher can use case study
methodology to analyse a
situation or organisation that has been studied infrequently and
that is unique, and can
then hope to learn something new and important. In this sense,
Mercadona seems to be
an outstanding example of TQM implementation, with some
specific characteristics that
have made this company virtually unique in the way it has
developed the model. This extra-
ordinary situation is justified on the basis of the circumstances
that made its adoption and
subsequent development possible, bringing about a profound
transformation in the
company and putting it in a privileged position in the retailing
sector in Spain.
The case of Mercadona
Mercadona is a family firm dedicated to the commercial
distribution of food and hygiene
products. The firm runs large supermarkets (.1000 m
2
) following a model of local city-
centre stores. The company name, Mercadona SA, appeared in
1977, but the company
actually originated in Cárnicas Roig, a family firm owned by
Francisco Roig Ballester
and specialising in carving and selling meat. The firm
subsequently evolved into a
chain of eight grocer’s shops, Mercadona (1999 – 2007).
In 1981, one of Francisco’s sons, Juan Roig, now running the
firm, built a small com-
mercial chain of various stores, which soon began to grow in
size, first in the Valencia
region and then in other areas in Spain. The firm’s expansion
coincided with a period
of growth in the commercial distribution sector in Spain, which
had various causes, in par-
ticular, the increasing concentration of the population within
cities and the entry of women
into the labour market. This growth attracted the attention of the
large European distri-
bution chains, which began to enter Spain. The strategy of these
large companies was
to open major retail outlets (hypermarkets) and offer low prices
in particular products,
accompanied by strong promotions, special offers and discounts
that were supported by
aggressive advertising campaigns in the media (Navarro, 2005).
The firms achieved low
prices by putting pressure on their suppliers to cut their prices
as far as possible. Custo-
mers, attracted by the low prices on some products, also bought
other products not on
special offer that yielded high profit margins.
Total Quality Management 1367
D
o
w
n
l
o
a
d
e
d
B
y
:
[
E
f
s
t
a
t
h
i
o
u
,
V
i
c
t
o
r
i
a
]
A
t
:
0
9
:
1
4
9
M
a
r
c
h
2
0
1
1
As a consequence of this strategy, in the 1990s, the food
distribution sector became
highly concentrated, and foreign multinationals controlled a
large part of the market. Com-
petition from these firms intensified rivalry in the industry,
which was now mature, with
strong competition and low margins. Mercadona responded to
this highly changeable and
turbulent environment by adopting a similar policy to that of the
large hypermarket chains.
The retailer put downward pressure on its suppliers’ prices and
ran intensive advertising
campaigns to promote its special offers every day. But the
results were not as good as
expected, since this was the same strategy as the big
hypermarket chains. Mercadona
was selling more, but every year its profits declined.
1
This was a very tricky time for Mercadona, which had to face
some extremely difficult
situations. Nevertheless, the president ignored tempting offers
to buy the company and
stuck firmly to his commitment to remain in the business. Thus,
in 1993, Juan Roig
decided to implement a strategy that broke radically with the
dynamic of the sector: he
introduced the TQM model. This initiative translated into a new
commercial strategy sum-
marised in a simple slogan ‘Siempre Precios Bajos’ (SPB, which
translates as ‘Always
Low Prices’). While its competitors continued with their
massive daily advertising cam-
paigns in the media, Mercadona immediately stopped all its
advertising spending. Merca-
dona cancelled all its special offers and made a commitment to
its customers always to sell
at the same price, and to its suppliers to remain loyal to them
and maintain stable prices for
years (Caparrós & Biot, 2006). This was quite a turnaround, as
suppliers had previously
seen Mercadona as one of the toughest negotiators. The firm’s
main objective was to
protect itself in the midst of all this turbulence and implement
an unusual and original
model, novel in the commercial distribution sector: price,
supplier and employee stability
to achieve permanent customers.
The results immediately after adopting the new model were not
very promising:
although the firm managed to practically double its sales from
four years before, its
profits were less than half. But the president stuck by his
decision and firmly maintained
the strategy based on the new management model. In 1995, its
performance improved, and
Mercadona soon entered a spectacular and unstoppable process
of growth, which was
mainly organic. Mercadona supermarkets spread out throughout
the whole country like
an olive oil spill. The company is now one of the most
profitable and widely distributed
supermarket chains in the Spanish market. Mercadona currently
employs more than
60,000 workers, runs more than 1100 supermarkets dotted
practically all over the
country, and earned a net profit of E336m in the last accounting
year (Mercadona,
1999 – 2007). Moreover, in recent years, Mercadona has
maintained a rate of new super-
market openings of nearly 100 per year (Figure 1). The growth
rate in its sales of
.25% per year in the second half of this period makes
Mercadona the 14th fastest-
growing retailer in the world, and the second fastest-growing
food distributor in the
world, after the American commercial distribution giant Wal-
Mart (Deloitte, 2007).
Mercadona’s management firmly believes that adopting and
maintaining the TQM
model has been critical in allowing the firm to achieve this rate
of growth and these spec-
tacular economic results. Through this approach, management
has impressed on the firm a
clear orientation to satisfy the needs and expectations of all its
stakeholders. On the basis
of this approach, Mercadona has defined five components in the
firm: customers, employ-
ees, suppliers, society and capital. All are equally important,
but in that sequential order,
Mercadona (1999 – 2007).
Mercadona’s TQM model starts from a universal premise: ‘to be
satisfied, first you have
to satisfy everyone else’ (Mercadona, 1999 – 2007). Thus, in
the first place, Mercadona
orients its entire business model towards the complete
satisfaction of its customers,
1368 B.C. Miguel and G.B. Santiago
D
o
w
n
l
o
a
d
e
d
B
y
:
[
E
f
s
t
a
t
h
i
o
u
,
V
i
c
t
o
r
i
a
]
A
t
:
0
9
:
1
4
9
M
a
r
c
h
2
0
1
1
which the firm considers so important that internally it calls
them its ‘bosses’. In the same
sense, the management is convinced that the workers – who are
the people who have to
satisfy the customers in the stores – must, in turn, be satisfied.
This is why the firm has estab-
lished its own way of managing its employees, implementing
policies that seek to encourage
their self-realisation through job security and stability, training,
internal promotion and
improvements in their quality of life. It is the suppliers’
products that have to maximally
satisfy the firm’s customers, so Mercadona has established a
relationship with its suppliers
based on trust, cooperation, mutual collaboration and stability.
Society is the medium
through which the firm carries out its activities, so Mercadona
feels involved with and
ethically committed to its protection and development. Finally,
by satisfying the needs of
its customers, employees, suppliers and society, Mercadona
contributes to satisfying the
expectations of the fifth component of its model, capital (Figure
2).
Despite its apparent simplicity, applying the TQM model is
neither simple nor easy. In
fact, one of the main difficulties is to introduce and develop
programmes and tools that allow
the firm to satisfy each and every one of its diverse
components, and at the same time, ensure
that the components perceive that the firm is satisfying their
needs so the firm transmits the
image of a responsible and committed company. In any case,
with this powerful model,
Mercadona has gained competitive advantages over its rivals,
has been able to globally
orient its strategy and organisational culture and has had
adopted a coherent decision-
making tool. So, any initiative proposed in the company must
first be evaluated for its
compliance with the model. The firm adopts and implements
proposals only when their
consequences are satisfactory to all five components, otherwise
it rejects them.
Orientation toward customer satisfaction
One of the fundamental cornerstones of the TQM model is its
orientation toward satisfying
customer needs. This is why Mercadona puts the customer in a
privileged position and
carries out a large number of activities and initiatives to be able
to care for its customers,
strengthen their loyalty and help them generate the maximum
possible value from doing
their shopping in Mercadona stores (Figure 3).
Figure 1. Evolution in the number of Mercadona supermarkets
1996 – 2006.
Source: Mercadona Annual Reports.
Total Quality Management 1369
D
o
w
n
l
o
a
d
e
d
B
y
:
[
E
f
s
t
a
t
h
i
o
u
,
V
i
c
t
o
r
i
a
]
A
t
:
0
9
:
1
4
9
M
a
r
c
h
2
0
1
1
For Mercadona, the customers are at the centre of its activity,
because its very survival
depends on their decision to shop in Mercadona supermarkets or
elsewhere. Thus, the firm
calls anyone who shops in its stores ‘boss’. Under this premise,
the whole organisation is
focused on providing an excellent service to its customers. This
conception places the
customer at the top of the firm’s inverted organisational
pyramid, and the function of
the leader and the rest of the organisation is to serve the
customer.
Given the customer’s privileged position, Mercadona’s
philosophy is to continually
increase the ‘value for the customer’ by maintaining its ‘Always
Low Prices’ policy
and eliminating special offers, promotions and temporary
discounts. But the philosophy
not only focuses on prices. All the firm’s actions are oriented
toward satisfying all the cus-
tomer’s specifications, whether known or potential future
expectations. In order to find
these out, Mercadona maintains a constant and direct dialogue
with its ‘bosses’, carrying
out activities to collect information, opinions and needs from its
customers: meetings with
neighbours in neighbourhoods where new stores are being
opened, monographic courses
on product lines, open days, blind tests, a free customer service
hotline and suggestion
boxes in supermarkets.
2
These operations require considerable economic investment
Figure 2. Mercadona’s TQM model.
Source: authors, based on Mercadona Annual Reports.
Figure 3. Orientation toward customer satisfaction in
Mercadona.
Source: authors.
1370 B.C. Miguel and G.B. Santiago
D
o
w
n
l
o
a
d
e
d
B
y
:
[
E
f
s
t
a
t
h
i
o
u
,
V
i
c
t
o
r
i
a
]
A
t
:
0
9
:
1
4
9
M
a
r
c
h
2
0
1
1
from Mercadona, but the firm considers this form of contact
more appropriate than big
advertising campaigns in the media, which are extremely
expensive and collect little infor-
mation from customers. Mercadona learns directly about its
customers’ tastes, the products
habitual customers need and future trends in different lines of
consumption. The firm then
tries to anticipate their future needs through innovation, R&D
and product-improvement
programmes.
3
On the basis of the information collected and distributed,
Mercadona carries out
actions to increase value for customers. The aim is to give
customers the chance to
carry out all their shopping under the principles of ‘maximum
quality, maximum range,
maximum service, minimum cost and minimum time – always’.
With regard to quality,
the retailer stresses the nutritional quality of its more than 9000
products.
4
But quality
also involves convenience, speed, comprehensiveness of service
and product variety.
Product variety – the maximum range – does not mean offering
a large number of
brands, but rather all the products that satisfy all the customer’s
needs in food, hygiene,
cleaning and pet food. Moreover, Mercadona aims to become a
‘prescriber’: choosing
and recommending products for their quality and minimum
price. Mercadona guarantees
the life and name principles for those products, guaranteeing the
origin and date of packa-
ging of the products, as well as the same name on products of
MBALN-670 Operations Management  Title of the topic 6 .docx

Weitere ähnliche Inhalte

Ähnlich wie MBALN-670 Operations Management Title of the topic 6 .docx

A STUDY ON THE EFFECTIVENESS OF ERP SYSTEM
A STUDY ON THE EFFECTIVENESS OF ERP SYSTEM A STUDY ON THE EFFECTIVENESS OF ERP SYSTEM
A STUDY ON THE EFFECTIVENESS OF ERP SYSTEM DAVIS THOMAS
 
ERP Industrial Planning
ERP  Industrial PlanningERP  Industrial Planning
ERP Industrial PlanningKiril Iliev
 
Discover 6 Must-Have Features of Automotive ERP Solution
Discover 6 Must-Have Features of Automotive ERP SolutionDiscover 6 Must-Have Features of Automotive ERP Solution
Discover 6 Must-Have Features of Automotive ERP SolutionSudeshnaJain
 
Case Study U.S. Strollers
Case Study U.S. StrollersCase Study U.S. Strollers
Case Study U.S. StrollersTiffany Graham
 
MRP, MRP2 and ERP system in supply chain
MRP, MRP2 and ERP system in supply chainMRP, MRP2 and ERP system in supply chain
MRP, MRP2 and ERP system in supply chainSaad Munami
 
Enterprise Resource Planning- BEST PPT
Enterprise Resource Planning- BEST PPTEnterprise Resource Planning- BEST PPT
Enterprise Resource Planning- BEST PPTSiddharth Modi
 
Enterprise resource planning
Enterprise resource planningEnterprise resource planning
Enterprise resource planningAakashTiwari43
 
erp.pptx
erp.pptxerp.pptx
erp.pptxKGagan2
 
Enterprise Resource Planning
Enterprise Resource PlanningEnterprise Resource Planning
Enterprise Resource PlanningAmmar Qazi
 
Evolution of ERP System
Evolution of ERP SystemEvolution of ERP System
Evolution of ERP Systemjayjani123
 
Supply Chain Management and MRP & ERP
Supply Chain Management and MRP & ERPSupply Chain Management and MRP & ERP
Supply Chain Management and MRP & ERPMasum Hussain
 

Ähnlich wie MBALN-670 Operations Management Title of the topic 6 .docx (20)

ERP
ERPERP
ERP
 
The Complete Guide to ERP
The Complete Guide to ERPThe Complete Guide to ERP
The Complete Guide to ERP
 
ERP Software
ERP SoftwareERP Software
ERP Software
 
A STUDY ON THE EFFECTIVENESS OF ERP SYSTEM
A STUDY ON THE EFFECTIVENESS OF ERP SYSTEM A STUDY ON THE EFFECTIVENESS OF ERP SYSTEM
A STUDY ON THE EFFECTIVENESS OF ERP SYSTEM
 
ERP Industrial Planning
ERP  Industrial PlanningERP  Industrial Planning
ERP Industrial Planning
 
Discover 6 Must-Have Features of Automotive ERP Solution
Discover 6 Must-Have Features of Automotive ERP SolutionDiscover 6 Must-Have Features of Automotive ERP Solution
Discover 6 Must-Have Features of Automotive ERP Solution
 
Erp
ErpErp
Erp
 
Erp
ErpErp
Erp
 
Case Study U.S. Strollers
Case Study U.S. StrollersCase Study U.S. Strollers
Case Study U.S. Strollers
 
Erp solution
Erp solutionErp solution
Erp solution
 
MRP, MRP2 and ERP system in supply chain
MRP, MRP2 and ERP system in supply chainMRP, MRP2 and ERP system in supply chain
MRP, MRP2 and ERP system in supply chain
 
Enterprise Resource Planning- BEST PPT
Enterprise Resource Planning- BEST PPTEnterprise Resource Planning- BEST PPT
Enterprise Resource Planning- BEST PPT
 
Enterprise resource planning
Enterprise resource planningEnterprise resource planning
Enterprise resource planning
 
ERP.pptx
ERP.pptxERP.pptx
ERP.pptx
 
erp.pptx
erp.pptxerp.pptx
erp.pptx
 
Enterprise Resource Planning
Enterprise Resource PlanningEnterprise Resource Planning
Enterprise Resource Planning
 
Materials management
Materials managementMaterials management
Materials management
 
Evolution of ERP System
Evolution of ERP SystemEvolution of ERP System
Evolution of ERP System
 
Supply Chain Management and MRP & ERP
Supply Chain Management and MRP & ERPSupply Chain Management and MRP & ERP
Supply Chain Management and MRP & ERP
 
ERP Software Tips
ERP Software TipsERP Software Tips
ERP Software Tips
 

Mehr von ARIV4

Please go through the document completely before providing the answe.docx
Please go through the document completely before providing the answe.docxPlease go through the document completely before providing the answe.docx
Please go through the document completely before providing the answe.docxARIV4
 
Please follow the instruction carefully. APA stile. Mínimum three re.docx
Please follow the instruction carefully. APA stile. Mínimum three re.docxPlease follow the instruction carefully. APA stile. Mínimum three re.docx
Please follow the instruction carefully. APA stile. Mínimum three re.docxARIV4
 
Please follow the instructions attached in MS Word. Font Arial,  .docx
Please follow the instructions attached in MS Word. Font Arial,  .docxPlease follow the instructions attached in MS Word. Font Arial,  .docx
Please follow the instructions attached in MS Word. Font Arial,  .docxARIV4
 
Please help me write a report focusing on photocatalysis of TiO2 .docx
Please help me write a report focusing on photocatalysis of TiO2 .docxPlease help me write a report focusing on photocatalysis of TiO2 .docx
Please help me write a report focusing on photocatalysis of TiO2 .docxARIV4
 
Please follow the directions in the assignment content Environme.docx
Please follow the directions in the assignment content Environme.docxPlease follow the directions in the assignment content Environme.docx
Please follow the directions in the assignment content Environme.docxARIV4
 
Please follow the directions below to complete the project1.).docx
Please follow the directions below to complete the project1.).docxPlease follow the directions below to complete the project1.).docx
Please follow the directions below to complete the project1.).docxARIV4
 
Please follow all directions please. the attachment titled assignme.docx
Please follow all directions please. the attachment titled assignme.docxPlease follow all directions please. the attachment titled assignme.docx
Please follow all directions please. the attachment titled assignme.docxARIV4
 
Please draft a personal message that you would like to appear on you.docx
Please draft a personal message that you would like to appear on you.docxPlease draft a personal message that you would like to appear on you.docx
Please draft a personal message that you would like to appear on you.docxARIV4
 
Please explain how you have met various BSN Essentials for each co.docx
Please explain how you have met various BSN Essentials for each co.docxPlease explain how you have met various BSN Essentials for each co.docx
Please explain how you have met various BSN Essentials for each co.docxARIV4
 
Please Follow directions or I will dispute please answer origina.docx
Please Follow directions or I will dispute please answer origina.docxPlease Follow directions or I will dispute please answer origina.docx
Please Follow directions or I will dispute please answer origina.docxARIV4
 
Please find the attached.Task 1 -  In 150 words comment on att.docx
Please find the attached.Task 1  -  In 150 words comment on att.docxPlease find the attached.Task 1  -  In 150 words comment on att.docx
Please find the attached.Task 1 -  In 150 words comment on att.docxARIV4
 
Please draw primarily from this weeks readings (and use additio.docx
Please draw primarily from this weeks readings (and use additio.docxPlease draw primarily from this weeks readings (and use additio.docx
Please draw primarily from this weeks readings (and use additio.docxARIV4
 
Please explain the reoccurring theme (sub-textual idea) of blin.docx
Please explain the reoccurring theme (sub-textual idea) of blin.docxPlease explain the reoccurring theme (sub-textual idea) of blin.docx
Please explain the reoccurring theme (sub-textual idea) of blin.docxARIV4
 
Please fill the attached Self-Assessment Surveys (TWO) and calcula.docx
Please fill the attached Self-Assessment Surveys (TWO) and calcula.docxPlease fill the attached Self-Assessment Surveys (TWO) and calcula.docx
Please fill the attached Self-Assessment Surveys (TWO) and calcula.docxARIV4
 
Please explain the rules of the calling program (Caller Rules).docx
Please explain the rules of the calling program (Caller Rules).docxPlease explain the rules of the calling program (Caller Rules).docx
Please explain the rules of the calling program (Caller Rules).docxARIV4
 
Please follow directions to receive all possible points!!The int.docx
Please follow directions to receive all possible points!!The int.docxPlease follow directions to receive all possible points!!The int.docx
Please follow directions to receive all possible points!!The int.docxARIV4
 
Please follow instructions A blanch interpersonal record attached..docx
Please follow instructions A blanch interpersonal record attached..docxPlease follow instructions A blanch interpersonal record attached..docx
Please follow instructions A blanch interpersonal record attached..docxARIV4
 
Please explain how you have met various BSN Essentials for each cour.docx
Please explain how you have met various BSN Essentials for each cour.docxPlease explain how you have met various BSN Essentials for each cour.docx
Please explain how you have met various BSN Essentials for each cour.docxARIV4
 
Please explain how you have met various Bachelor of Science in Nur.docx
Please explain how you have met various Bachelor of Science in Nur.docxPlease explain how you have met various Bachelor of Science in Nur.docx
Please explain how you have met various Bachelor of Science in Nur.docxARIV4
 
Please DiscussWhat are host-based, client-based, client-serv.docx
Please DiscussWhat are host-based, client-based, client-serv.docxPlease DiscussWhat are host-based, client-based, client-serv.docx
Please DiscussWhat are host-based, client-based, client-serv.docxARIV4
 

Mehr von ARIV4 (20)

Please go through the document completely before providing the answe.docx
Please go through the document completely before providing the answe.docxPlease go through the document completely before providing the answe.docx
Please go through the document completely before providing the answe.docx
 
Please follow the instruction carefully. APA stile. Mínimum three re.docx
Please follow the instruction carefully. APA stile. Mínimum three re.docxPlease follow the instruction carefully. APA stile. Mínimum three re.docx
Please follow the instruction carefully. APA stile. Mínimum three re.docx
 
Please follow the instructions attached in MS Word. Font Arial,  .docx
Please follow the instructions attached in MS Word. Font Arial,  .docxPlease follow the instructions attached in MS Word. Font Arial,  .docx
Please follow the instructions attached in MS Word. Font Arial,  .docx
 
Please help me write a report focusing on photocatalysis of TiO2 .docx
Please help me write a report focusing on photocatalysis of TiO2 .docxPlease help me write a report focusing on photocatalysis of TiO2 .docx
Please help me write a report focusing on photocatalysis of TiO2 .docx
 
Please follow the directions in the assignment content Environme.docx
Please follow the directions in the assignment content Environme.docxPlease follow the directions in the assignment content Environme.docx
Please follow the directions in the assignment content Environme.docx
 
Please follow the directions below to complete the project1.).docx
Please follow the directions below to complete the project1.).docxPlease follow the directions below to complete the project1.).docx
Please follow the directions below to complete the project1.).docx
 
Please follow all directions please. the attachment titled assignme.docx
Please follow all directions please. the attachment titled assignme.docxPlease follow all directions please. the attachment titled assignme.docx
Please follow all directions please. the attachment titled assignme.docx
 
Please draft a personal message that you would like to appear on you.docx
Please draft a personal message that you would like to appear on you.docxPlease draft a personal message that you would like to appear on you.docx
Please draft a personal message that you would like to appear on you.docx
 
Please explain how you have met various BSN Essentials for each co.docx
Please explain how you have met various BSN Essentials for each co.docxPlease explain how you have met various BSN Essentials for each co.docx
Please explain how you have met various BSN Essentials for each co.docx
 
Please Follow directions or I will dispute please answer origina.docx
Please Follow directions or I will dispute please answer origina.docxPlease Follow directions or I will dispute please answer origina.docx
Please Follow directions or I will dispute please answer origina.docx
 
Please find the attached.Task 1 -  In 150 words comment on att.docx
Please find the attached.Task 1  -  In 150 words comment on att.docxPlease find the attached.Task 1  -  In 150 words comment on att.docx
Please find the attached.Task 1 -  In 150 words comment on att.docx
 
Please draw primarily from this weeks readings (and use additio.docx
Please draw primarily from this weeks readings (and use additio.docxPlease draw primarily from this weeks readings (and use additio.docx
Please draw primarily from this weeks readings (and use additio.docx
 
Please explain the reoccurring theme (sub-textual idea) of blin.docx
Please explain the reoccurring theme (sub-textual idea) of blin.docxPlease explain the reoccurring theme (sub-textual idea) of blin.docx
Please explain the reoccurring theme (sub-textual idea) of blin.docx
 
Please fill the attached Self-Assessment Surveys (TWO) and calcula.docx
Please fill the attached Self-Assessment Surveys (TWO) and calcula.docxPlease fill the attached Self-Assessment Surveys (TWO) and calcula.docx
Please fill the attached Self-Assessment Surveys (TWO) and calcula.docx
 
Please explain the rules of the calling program (Caller Rules).docx
Please explain the rules of the calling program (Caller Rules).docxPlease explain the rules of the calling program (Caller Rules).docx
Please explain the rules of the calling program (Caller Rules).docx
 
Please follow directions to receive all possible points!!The int.docx
Please follow directions to receive all possible points!!The int.docxPlease follow directions to receive all possible points!!The int.docx
Please follow directions to receive all possible points!!The int.docx
 
Please follow instructions A blanch interpersonal record attached..docx
Please follow instructions A blanch interpersonal record attached..docxPlease follow instructions A blanch interpersonal record attached..docx
Please follow instructions A blanch interpersonal record attached..docx
 
Please explain how you have met various BSN Essentials for each cour.docx
Please explain how you have met various BSN Essentials for each cour.docxPlease explain how you have met various BSN Essentials for each cour.docx
Please explain how you have met various BSN Essentials for each cour.docx
 
Please explain how you have met various Bachelor of Science in Nur.docx
Please explain how you have met various Bachelor of Science in Nur.docxPlease explain how you have met various Bachelor of Science in Nur.docx
Please explain how you have met various Bachelor of Science in Nur.docx
 
Please DiscussWhat are host-based, client-based, client-serv.docx
Please DiscussWhat are host-based, client-based, client-serv.docxPlease DiscussWhat are host-based, client-based, client-serv.docx
Please DiscussWhat are host-based, client-based, client-serv.docx
 

Kürzlich hochgeladen

BAG TECHNIQUE Bag technique-a tool making use of public health bag through wh...
BAG TECHNIQUE Bag technique-a tool making use of public health bag through wh...BAG TECHNIQUE Bag technique-a tool making use of public health bag through wh...
BAG TECHNIQUE Bag technique-a tool making use of public health bag through wh...Sapna Thakur
 
SOCIAL AND HISTORICAL CONTEXT - LFTVD.pptx
SOCIAL AND HISTORICAL CONTEXT - LFTVD.pptxSOCIAL AND HISTORICAL CONTEXT - LFTVD.pptx
SOCIAL AND HISTORICAL CONTEXT - LFTVD.pptxiammrhaywood
 
social pharmacy d-pharm 1st year by Pragati K. Mahajan
social pharmacy d-pharm 1st year by Pragati K. Mahajansocial pharmacy d-pharm 1st year by Pragati K. Mahajan
social pharmacy d-pharm 1st year by Pragati K. Mahajanpragatimahajan3
 
9548086042 for call girls in Indira Nagar with room service
9548086042  for call girls in Indira Nagar  with room service9548086042  for call girls in Indira Nagar  with room service
9548086042 for call girls in Indira Nagar with room servicediscovermytutordmt
 
Sanyam Choudhary Chemistry practical.pdf
Sanyam Choudhary Chemistry practical.pdfSanyam Choudhary Chemistry practical.pdf
Sanyam Choudhary Chemistry practical.pdfsanyamsingh5019
 
Kisan Call Centre - To harness potential of ICT in Agriculture by answer farm...
Kisan Call Centre - To harness potential of ICT in Agriculture by answer farm...Kisan Call Centre - To harness potential of ICT in Agriculture by answer farm...
Kisan Call Centre - To harness potential of ICT in Agriculture by answer farm...Krashi Coaching
 
Russian Call Girls in Andheri Airport Mumbai WhatsApp 9167673311 💞 Full Nigh...
Russian Call Girls in Andheri Airport Mumbai WhatsApp  9167673311 💞 Full Nigh...Russian Call Girls in Andheri Airport Mumbai WhatsApp  9167673311 💞 Full Nigh...
Russian Call Girls in Andheri Airport Mumbai WhatsApp 9167673311 💞 Full Nigh...Pooja Nehwal
 
Presentation by Andreas Schleicher Tackling the School Absenteeism Crisis 30 ...
Presentation by Andreas Schleicher Tackling the School Absenteeism Crisis 30 ...Presentation by Andreas Schleicher Tackling the School Absenteeism Crisis 30 ...
Presentation by Andreas Schleicher Tackling the School Absenteeism Crisis 30 ...EduSkills OECD
 
Mastering the Unannounced Regulatory Inspection
Mastering the Unannounced Regulatory InspectionMastering the Unannounced Regulatory Inspection
Mastering the Unannounced Regulatory InspectionSafetyChain Software
 
Advanced Views - Calendar View in Odoo 17
Advanced Views - Calendar View in Odoo 17Advanced Views - Calendar View in Odoo 17
Advanced Views - Calendar View in Odoo 17Celine George
 
A Critique of the Proposed National Education Policy Reform
A Critique of the Proposed National Education Policy ReformA Critique of the Proposed National Education Policy Reform
A Critique of the Proposed National Education Policy ReformChameera Dedduwage
 
BASLIQ CURRENT LOOKBOOK LOOKBOOK(1) (1).pdf
BASLIQ CURRENT LOOKBOOK  LOOKBOOK(1) (1).pdfBASLIQ CURRENT LOOKBOOK  LOOKBOOK(1) (1).pdf
BASLIQ CURRENT LOOKBOOK LOOKBOOK(1) (1).pdfSoniaTolstoy
 
Arihant handbook biology for class 11 .pdf
Arihant handbook biology for class 11 .pdfArihant handbook biology for class 11 .pdf
Arihant handbook biology for class 11 .pdfchloefrazer622
 
Disha NEET Physics Guide for classes 11 and 12.pdf
Disha NEET Physics Guide for classes 11 and 12.pdfDisha NEET Physics Guide for classes 11 and 12.pdf
Disha NEET Physics Guide for classes 11 and 12.pdfchloefrazer622
 
Accessible design: Minimum effort, maximum impact
Accessible design: Minimum effort, maximum impactAccessible design: Minimum effort, maximum impact
Accessible design: Minimum effort, maximum impactdawncurless
 
Measures of Central Tendency: Mean, Median and Mode
Measures of Central Tendency: Mean, Median and ModeMeasures of Central Tendency: Mean, Median and Mode
Measures of Central Tendency: Mean, Median and ModeThiyagu K
 
The byproduct of sericulture in different industries.pptx
The byproduct of sericulture in different industries.pptxThe byproduct of sericulture in different industries.pptx
The byproduct of sericulture in different industries.pptxShobhayan Kirtania
 

Kürzlich hochgeladen (20)

Advance Mobile Application Development class 07
Advance Mobile Application Development class 07Advance Mobile Application Development class 07
Advance Mobile Application Development class 07
 
BAG TECHNIQUE Bag technique-a tool making use of public health bag through wh...
BAG TECHNIQUE Bag technique-a tool making use of public health bag through wh...BAG TECHNIQUE Bag technique-a tool making use of public health bag through wh...
BAG TECHNIQUE Bag technique-a tool making use of public health bag through wh...
 
SOCIAL AND HISTORICAL CONTEXT - LFTVD.pptx
SOCIAL AND HISTORICAL CONTEXT - LFTVD.pptxSOCIAL AND HISTORICAL CONTEXT - LFTVD.pptx
SOCIAL AND HISTORICAL CONTEXT - LFTVD.pptx
 
INDIA QUIZ 2024 RLAC DELHI UNIVERSITY.pptx
INDIA QUIZ 2024 RLAC DELHI UNIVERSITY.pptxINDIA QUIZ 2024 RLAC DELHI UNIVERSITY.pptx
INDIA QUIZ 2024 RLAC DELHI UNIVERSITY.pptx
 
social pharmacy d-pharm 1st year by Pragati K. Mahajan
social pharmacy d-pharm 1st year by Pragati K. Mahajansocial pharmacy d-pharm 1st year by Pragati K. Mahajan
social pharmacy d-pharm 1st year by Pragati K. Mahajan
 
9548086042 for call girls in Indira Nagar with room service
9548086042  for call girls in Indira Nagar  with room service9548086042  for call girls in Indira Nagar  with room service
9548086042 for call girls in Indira Nagar with room service
 
Sanyam Choudhary Chemistry practical.pdf
Sanyam Choudhary Chemistry practical.pdfSanyam Choudhary Chemistry practical.pdf
Sanyam Choudhary Chemistry practical.pdf
 
Kisan Call Centre - To harness potential of ICT in Agriculture by answer farm...
Kisan Call Centre - To harness potential of ICT in Agriculture by answer farm...Kisan Call Centre - To harness potential of ICT in Agriculture by answer farm...
Kisan Call Centre - To harness potential of ICT in Agriculture by answer farm...
 
Russian Call Girls in Andheri Airport Mumbai WhatsApp 9167673311 💞 Full Nigh...
Russian Call Girls in Andheri Airport Mumbai WhatsApp  9167673311 💞 Full Nigh...Russian Call Girls in Andheri Airport Mumbai WhatsApp  9167673311 💞 Full Nigh...
Russian Call Girls in Andheri Airport Mumbai WhatsApp 9167673311 💞 Full Nigh...
 
Presentation by Andreas Schleicher Tackling the School Absenteeism Crisis 30 ...
Presentation by Andreas Schleicher Tackling the School Absenteeism Crisis 30 ...Presentation by Andreas Schleicher Tackling the School Absenteeism Crisis 30 ...
Presentation by Andreas Schleicher Tackling the School Absenteeism Crisis 30 ...
 
Mastering the Unannounced Regulatory Inspection
Mastering the Unannounced Regulatory InspectionMastering the Unannounced Regulatory Inspection
Mastering the Unannounced Regulatory Inspection
 
Advanced Views - Calendar View in Odoo 17
Advanced Views - Calendar View in Odoo 17Advanced Views - Calendar View in Odoo 17
Advanced Views - Calendar View in Odoo 17
 
A Critique of the Proposed National Education Policy Reform
A Critique of the Proposed National Education Policy ReformA Critique of the Proposed National Education Policy Reform
A Critique of the Proposed National Education Policy Reform
 
BASLIQ CURRENT LOOKBOOK LOOKBOOK(1) (1).pdf
BASLIQ CURRENT LOOKBOOK  LOOKBOOK(1) (1).pdfBASLIQ CURRENT LOOKBOOK  LOOKBOOK(1) (1).pdf
BASLIQ CURRENT LOOKBOOK LOOKBOOK(1) (1).pdf
 
Mattingly "AI & Prompt Design: Structured Data, Assistants, & RAG"
Mattingly "AI & Prompt Design: Structured Data, Assistants, & RAG"Mattingly "AI & Prompt Design: Structured Data, Assistants, & RAG"
Mattingly "AI & Prompt Design: Structured Data, Assistants, & RAG"
 
Arihant handbook biology for class 11 .pdf
Arihant handbook biology for class 11 .pdfArihant handbook biology for class 11 .pdf
Arihant handbook biology for class 11 .pdf
 
Disha NEET Physics Guide for classes 11 and 12.pdf
Disha NEET Physics Guide for classes 11 and 12.pdfDisha NEET Physics Guide for classes 11 and 12.pdf
Disha NEET Physics Guide for classes 11 and 12.pdf
 
Accessible design: Minimum effort, maximum impact
Accessible design: Minimum effort, maximum impactAccessible design: Minimum effort, maximum impact
Accessible design: Minimum effort, maximum impact
 
Measures of Central Tendency: Mean, Median and Mode
Measures of Central Tendency: Mean, Median and ModeMeasures of Central Tendency: Mean, Median and Mode
Measures of Central Tendency: Mean, Median and Mode
 
The byproduct of sericulture in different industries.pptx
The byproduct of sericulture in different industries.pptxThe byproduct of sericulture in different industries.pptx
The byproduct of sericulture in different industries.pptx
 

MBALN-670 Operations Management Title of the topic 6 .docx

  • 1. MBALN-670 Operations Management Title of the topic 6 Resource Planning and Scheduling Topic’s learning objectives 1. Identify and critique the strategic frameworks of operations and quality management within a global business environment. 2. Comprehensive knowledge of the main concept and methods related to designing and managing operations and supply chains. 3. Systematic application of a range of fundamental operational improvement concepts. 4. Critically evaluate the role of operations within different business models / functions.. Introduction Learning Material
  • 2. Start by flicking through the presentations, this will provide you with a quick overview of the topics. Pay particular attention to Resource Planning. You will find these in the folder “presentations”. There are various ways in defining an Enterprise resource Planning System. This is how it has been defined by American Inventory and Production Control System (APICS) dictionary: “Enterprise Resource Planning: An accounting oriented information system for identifying and planning the enterprise-wide resources to make ship and account for customer orders.” Again in Internet encyclopedia, it has defined as: “An enterprise planning system is an integrated computer based application used to manage internal and external resources, including tangible assets, financial resources, material and human resources”. Basically, an ERP combines several traditional management functions into a logical integrated system and facilitate flow of information across these
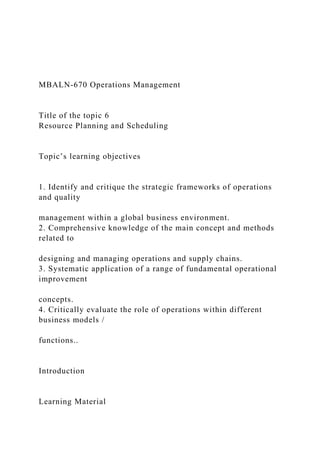
  • 3. functions. It is designed to model and automate basic processes across the organization over a centralized database and eliminates the need of disparate systems maintained by various units of the organization. Figure below shows how information is integrated in a typical organization using a ERP system. ERP system is thus a mirror image of the major business processes of an organization. Need for Enterprise Resource Planning - Why ERP? Separate systems were being maintained during 1960/70 for traditional business functions like Sales & Marketing, Finance, Human Resources, Manufacturing, and Supply Chain Management. These systems were often incongruent, hosted in different databases and required batch updates. It was difficult to manage business processes across business functions e.g. procurement to pay and sales to cash functions. ERP system grew to replace the islands of
  • 4. information by integrating these traditional business functions. The successful implementation of an ERP system will have many advantages, as indicated below: system is composed of various modules/ sub modules where a module represents a particular business component. If data is entered in one module such as receiving, it automatically updates other related modules such as accounts payable and inventory. This updating occurs at real time i.e. at the time a transaction occurs. Since, data needs to be entered only once at the origin of transaction, the need of multiple entries of the same data is eliminated. Likelihood of duplicate/ erroneous data is, therefore, minimized. The centralized structure of the data base also enable better administration and security provisions, which minimizes loss of sensitive data.
  • 5. planning engines and simulations functions, form integral part of an ERP system which helps in proper utilization of resources like materials, human resources and tools. Constrained based planning help in drawing appropriate production schedules, thereby improving operation of plant and equipment. As a part of MIS, an ERP system, contains many inbuilt standard reports and also a report writer which produce ad hoc reports, as and when needed. provision of improved planning, ERP system provides a tremendous boost to the efficiency of day to day and routine transactions such as order fulfillment, on time shipment, vendor performance, quality management, invoice reconciliation, sales realization, and cash management. Cycle time is reduced for sales to cash and procurement to pay sequences. based on processes of international best practices, which are adopted by the organizations during implementation. Department silos are purged and maverick practices are done away with. Because of top down view available to management, chances of theft, fraud and obsolescence are minimized.
  • 6. where production units, distribution centers and corporate offices reside in different countries, organizations need multi currency, multi language and multi accounting modes, in an integrated manner. These provisions are available in most of the ERP systems, particularly in products offered by tier 1 and tier 2 vendors. ERP vendors are also quick to adopt latest technologies, from mainframe to client server to internet. Unlike a bespoke system, Upgrading to latest technology for a running ERP system is uncomplicated, involving mostly adoption of service packs and patches. Conclusion Although ERP provides many advantages; its implementation is a strategic decision, involving significant resources (both financial and human), proper evaluation and business process re-engineering. There must be commitment from all levels. A failed implementation may lead to bankruptcy of an organization. http://www.managementstudyguide.com/enterprise-resource- planning.htm http://www.managementstudyguide.com/enterprise-resource- planning.htm
  • 7. Video 10 Click on this link (also found on the VLE) http://www.youtube.com/watch?v=PVRgIXLWDHs Discussion Question 4 1. Describe enterprise resource planning and its role in an organization. 2. Describe the basic modules of an ERP system. 3. Describe the evolution of ERP systems. Resource Planning Within OM: How it all Fits Together Enterprise resource planning provides a common database for use by an organization, its suppliers, and its customers. Second-generation ERP systems are designed to support supply chain management and e-commerce. These systems automate routine transactions and provide real-time information to all members of the enterprise. ERP systems typically have a production and
  • 8. materials module (MRP – materials resource planning) to determine what is needed, how much is needed, and when it is needed. MRP reports are used by the production and inventory planners to (1) generate purchasing requisitions and (2) develop schedules of different activities to be done on the manufacturing floor. Even though rough-cut capacity planning (RCCP) using MPS data was done to check for feasibility, it is still important to do capacity requirements planning (CRP) for any critical work centers (bottlenecks or potential bottlenecks). CRP operates at a greater level of detail than does RCCP, using information generated by the MRP http://www.youtube.com/watch?v=PVRgIXLWDHs system. Production planners do this to make sure the detailed
  • 9. schedule of production is feasible. Resource planning is designed to ensure that the right materials, in the right quantities, are available at the right time. And to ensure that the right job is being done on the right equipment. Resource Planning Across the Organization Since MRP determines the quantity and timing of materials needed, it affects several functional areas in the company. Let's first look at how each functional area is affected by MRP and then consider the effects of ERP. Accounting calculates future material commitments based on MRP output. Accounting then develops cash flow budgets and the inventory investment to support the current MPS. With a common database, accounting should be able to determine the exact status of outstanding orders, including cost, quantity, and delivery date. Since there is a common database, discrepancies between supplier and manufacturer should be reduced.
  • 10. Marketing is primarily concerned with the MPS, which identifies when finished goods will be completed. MRP reveals potential material shortages that directly affect marketing since the shortages may delay product completion. Marketing can also use MRP for allocating scarce materials to maximize customer service. One major advantage of ERP is that marketing can track actual sales at the final product level (using POS) to determine what actions, if any, need to be taken to maximize customer service. Information systems maintains MRP, which is a large database that includes the BOM, the inventory records, and the MPS. Minimizing errors in the database is essential to producing useful reports. ERP will help IS by using a single integrated database for both internal and external members of the supply chain. Purchasing uses the planned orders generated by MRP to evaluate the feasibility of long-term or blanket contracts and to determine delivery need. The lead times that are input into MRP often come directly from purchasing. ERP will facilitate supplier- managed inventory approaches and reduce transaction costs for purchasing.
  • 11. Manufacturing uses the output generated by MRP to develop daily manufacturing schedules. MRP ensures that the right materials in the right quantity are available to support the MPS. Manufacturing also uses MRP to allocate scarce materials. ERP will provide manufacturing with improved insight into actual customer demand. It should increase the probability that manufacturing is working on products actually needed to satisfy customer demand. In most manufacturing operations, production or inventory control planners are responsible for working with MRP. Planners are typically responsible for certain inventory items, including end items, subassemblies, and components. Planners check the MRP output for action notices related to the items for which they are responsible. Planners schedule, reschedule, and expedite materials to support the MPS. A planning position is often an entry-level job in the materials field. As companies continue to move toward ERP, all functional areas will work from a central database. The database gives all areas in the company access to the same information simultaneously and improves organizational effectiveness.
  • 12. Activity ERP Providers – found on the VLE as last item Assist in creating a glossary of ERP providers with a brief description of the product(s) they offer. What unique selling point do they have? Scheduling A company's overall strategy provides the framework for making decisions in many operational areas. Companies differentiate themselves based on product volume and product variety. This differentiation affects how the company organizes its operations. A company providing a high-volume, standardized, consistent-quality, lower-margin product or service such as a commercial bakery or a fast-food restaurant focuses on product and layout. This type of operation needs dedicated equipment, less-skilled employees, and a continuous or repetitive process flow.
  • 13. Companies providing low-volume, customized, higher-margin products or services, such as a custom furniture maker or an upscale restaurant, focus on process. They need general-purpose equipment, more highly skilled employees, and flexible process flows. Each kind of operation needs a different scheduling technique. Let's look at high-volume operations first. Discussion Question 5 1. Compare and contrast high-volume and low-volume scheduling operations. 2. Describe a high-volume service operation and how scheduling should be done. 3. Describe a low-volume service operation and how scheduling should be done. The Supply Chain Link Enterprise resource planning provides the structure for common databases across the organization, its suppliers, and its customers. Suppliers
  • 14. can access the master production schedule (MPS) to see projected build dates for products that use materials supplied by them. The current trend is to integrate e-commerce and ERP systems. Tangible benefits of an ERP system include reduced inventory levels, reduced staffing, improved order launching, reduced IT and purchasing costs, improved cash flow, and increased profits. Intangible benefits include improved visibility of system demand, improved customer responsiveness, and improved flexibility. Enterprise resource planning systems provide the structure needed for effective supply chain management. Further Reading 1. What are the inputs of operations scheduling http://www.mbaofficial.com/mba-courses/operations- management/what-are- the-inputs-of-the-operations-scheduling/ 2. Reid R., Operations Management, 4 th Edition, 2011, Wiley Publishers
  • 15. Topic’s summary Enterprise resource planning (ERP) is software designed for organizing and managing business processes by sharing information across functional areas using a common database and a single computer system. ERP systems typically have modules for finance and accounting, sales and marketing, production and materials management, and human resources. First-generation ERP systems provide a single interface for managing routine activities performed in manufacturing. Second-generation ERP systems or SCM software is designed to improve decision making in the supply chain. The current trend is integrating e-commerce and ERP systems. http://www.mbaofficial.com/mba-courses/operations- management/what-are-the-inputs-of-the-operations-scheduling/ http://www.mbaofficial.com/mba-courses/operations- management/what-are-the-inputs-of-the-operations-scheduling/ http://www.mbaofficial.com/mba-courses/operations- management/what-are-the-inputs-of-the-operations-scheduling/
  • 16. Tangible benefits from ERP systems include reductions in inventory and staffing, increased productivity, improved order management, quicker closing of financial cycles, reduced IT and purchasing costs, improved cash flow management, and increased revenue and profits. Intangible benefits include improved visibility of corporate data, improved customer responsiveness, and improved flexibility. The cost of ERP systems ranges from hundreds of thousands of dollars to several million dollars. Material requirements planning (MRP) systems are designed to calculate material requirements for items with dependent demand. MRP systems use backward scheduling to determine when each activity starts so that the finished product or service is completed on time. Independent demand is the demand for finished products, whereas dependent
  • 17. demand is demand that is derived from finished products. MRP systems use dependent demand. The objectives of MRP are to determine the quantity and timing of material requirements and to keep schedule priorities updated and valid. MRP determines what to order, how much to order, when to place the order, and when to schedule the order's arrival. It maintains priorities by recognizing changes in the operations environment and making the necessary adjustments. MRP needs three inputs: the authorized MPS, the BOM file, and the inventory records file. The MPS is the planned build schedule, the BOM file shows the materials needed to build an item, and the inventory records file shows the inventory on hand. Once the MPS has been input, MRP checks the inventory records to determine if
  • 18. enough end-item inventory is available. If sufficient end item inventory is not on hand, MRP checks the end item's BOM file to determine what materials are needed and in what quantities. The MRP system then generates planned replenishment orders. Action notices show when to release planned orders, reschedule orders, or adjust due dates. They allow the planner to use the MRP output information effectively. Different lot size rules are used with MRP systems to generate different order quantities and order frequencies. The lot-for-lot (L4L) rule always minimizes inventory investment but maximizes ordering costs. A cost comparison shows the effect of using different lot sizing rules. Planned orders generated by MRP, plus any open shop orders, are inputs to capacity requirements planning (CRP). CRP checks to see if
  • 19. available capacity is sufficient to complete the orders scheduled in a particular work center during a specific time period. Different kinds of environments need different scheduling techniques. Scheduling in the high-volume environment is typically done through line design and balancing. Scheduling in a low-volume environment typically involves the use of priority rules. In this environment, Gantt charts are often used to view the workload and jobs in process. Shop loading techniques include infinite and finite loading. Infinite loading schedules include jobs without capacity constraints. Finite loading loads jobs up to a predetermined capacity level. Loading can be done using forward or backward scheduling. Forward scheduling starts the job as soon as possible, whereas
  • 20. backward scheduling works back from the due date. Priority rules are used to make scheduling decisions. SPT always minimizes mean job flow time, mean job lateness, and average number of jobs in the system. FCFS is considered one of the fairest priority rules. Rules related to due dates tend to minimize the maximum tardiness of the jobs. Priority rules need to support organizational objectives. Performance measurements reflect the priorities of the organization. Mean job flow time, mean job lateness, mean job tardiness, makespan, and the average number of jobs in the system measure the effectiveness of schedules. Johnson's rule is an effective technique for minimizing makespan when two successive workstations are needed to complete the process. When scheduling bottleneck systems, the basic principles of OPT apply. The theory
  • 21. of constraints expands OPT into a managerial philosophy of continuous improvement. Service organizations use different scheduling techniques such as appointments, reservations, and posted schedules for effective use of service capacity. A method developed by Tibrewala, Phillippe, and Brown constructs workforce schedules when a company uses full-time employees, operates seven days each week, and gives its employees two consecutive days off. Discussion Questions: 1. Describe some common differences between Western and Eastern approaches to negotiating. 2. What were some of the underlying dynamics that may have contributed to the breakdown in negotiations? 3. In retrospect, what communication strategy could Nelson have used to strengthen the relationship with San Yu?
  • 22. MBALN-670 Operations Management Title of the topic 5 Project Management Tools and Techniques Topic’s learning objectives 1. Identify and critique the strategic frameworks of operations and quality management within a global business environment. 2. Comprehensive knowledge of the main concept and methods related to designing and managing operations and supply chains. 3. Systematic application of a range of fundamental operational improvement concepts. 4. Critically evaluate the role of operations within different business models / functions. Introduction Were any of you lucky enough to attend the Olympic Games London 2012? How was your experience? Fun, safe, affordable? Have you
  • 23. considered what the project plan might have looked like? The whole project cost around £6bn and took 5 years. One large-scale project to manage is the Olympic Games—a project that necessitates an exceptional amount of advance research and planning. The logistics and infrastructures of the city that hosts the Olympic Games and the Organizing Committee for the Games both have to oversee hundreds of smaller projects that culminate to ensure a successful run of the Olympics. From tasks such as shipping and receiving the tremendous amount of freight (for example, broadcast equipment) to facilitating the stay of the athletes, project managers must pay close attention to details. Of course, with such a large-scale event comes a myriad of problems, such as enough timely transportation, leadership changes, and security concerns. Only with extensive preparation can such a large-scale event be successful
  • 24. This table gives you an idea of the time scale. More information is available: http://www.london2012.com/spectators/venues/building-london- 2012/ Project management techniques are useful when a project consists of several activities, some simultaneous and others sequential. A project is a unique, one-time set of activities that is intended to achieve an objective in a given time period. The project is of some length (weeks, months, or even years) and uses resources (human, capital, materials, and equipment). In the business world, projects can be designing new products, installing new systems, constructing new facilities, designing an advertising campaign, designing information systems, and developing company Web sites. In politics, a project can be designing a political campaign. Projects consist of several
  • 25. tasks and take place in a given time period. Every project has a life cycle. This week you will study some of the tools and techniques available to manage projects of any size. Learning Material Before you embark on this week’s topic, please spend 30 minutes to study the following 2 areas: Gantt Charts A Gantt chart is a type of bar chart, developed by Henry Gantt, that illustrates a project schedule. Gantt charts illustrate the start and finish dates of the terminal elements and summary elements of a project. Terminal elements and summary elements comprise the work breakdown structure of the project. Some Gantt charts
  • 26. also show the dependency (i.e., precedence network) relationships between http://www.london2012.com/spectators/venues/building-london- 2012/ activities. Gantt charts can be used to show current schedule status using percent- complete shadings and a vertical "TODAY" line as shown here. Source: http://en.wikipedia.org/wiki/Gantt_charthttp://www.netmba.com /operations/project/gantt/ A simple explanation can be found on the following link. Also Gantt charts are covered in the eBook under chapter Gantt charts can be constructed with Microsoft Excel, but for larger and more complex planning Microsoft Project is used. Video 7 How to create a Gantt Chart In Microsoft Project http://www.youtube.com/watch?v=inCkcgRCFGM
  • 27. Video 8 How to create a Gantt Chart in Excel 2010 http://www.youtube.com/watch?v=sA67g6zaKOE http://en.wikipedia.org/wiki/Gantt_chart http://en.wikipedia.org/wiki/Gantt_chart http://www.youtube.com/watch?v=inCkcgRCFGM http://www.youtube.com/watch?v=sA67g6zaKOE Time Schedules The following information is taken from your eBook Chapter 11 Setting Standard Times Among the commonly used processes for setting standard times are the time study, elemental time data, predetermined time data, and work sampling. The time study dates back to Frederick Winslow Taylor in the late nineteenth century. How to Do a Time Study The time study sets a standard time based on timed observations
  • 28. of one employee taken over a number of cycles. A cycle includes all the elements of the job. This standard time is applied to all workers doing the job. Table 11-2 shows the steps in a time study. Table 11-2 Procedure for a Time Study Now let's look at these steps in detail. Step 1. As an individual, you set standards for yourself based on the tasks that are typical of your workday. The same is true for your company: you base standard times on the routine, labour-intensive jobs rather than one-of-a-kind jobs. Use this criterion for choosing your time-study job in Step 1. Step 1. Choose the job for the time study.
  • 29. Step 2 Tell the worker whose job you will be studying Step 3. Break the job into easily recognizable units Step 4. Calculate the number of cycles you must observe. Step 5. Time each element, record the times, and rate the worker's performance. Step 6. Compute normal time. NT = (MOT) (PRF) (F) Step 7. Compute the standard tune. ST = (NT) (AF) Step 2. It is also important to inform the employee in advance that you will be making a time study of the job. Be sensitive to how the employee will feel as you time performance. Step 3. To break a job down into easily recognizable elements, think about making a hand-tossed pizza: 1. Find the right-sized ball of dough (this depends on the pizza
  • 30. size). 2. Flatten out the dough. 3. Spin and toss the dough until it is the size you want. 4. Put the pizza on the working area. 5. Add sauce. 6. Add cheese. 7. Add additional toppings. 8. Put the pizza in the oven and bake. Each of these elements has a clear starting and ending point, and you cannot break it down any further. Step 4. When making a time study, you need to know how many cycles, or how many times, you must observe the worker to ensure the results you want. The number of cycles is a function of the variability of observed
  • 31. times, the desired level of accuracy or precision, and the desired level of confidence for the estimated standard times. We often express the desired accuracy level as a percentage of the mean observed times. For example, we might want an accuracy level so that the standard time is within 10 percent of the true mean of the time it takes to do the job. The formula for determining the number of observations needed is Continue reading from Chapter 11 to obtain the full calculations and method. Project Life Cycle Projects vary in terms of objectives, but each project has a common life cycle or sequence of activities. The life cycle begins with an initial concept, followed by a
  • 32. feasibility study, the planning of the project, the execution of the plan, and finally the termination of the project. Let's look at each phase of a project life cycle. Conception The concept might be the company's decision to launch a new product, implement a new information system, or become involved in e-commerce. In politics, the concept might be a candidate's decision to run for office. Feasibility Analysis or Study Evaluate expected costs, benefits, and risks of the project. For the company launching a new product, a feasibility study means examining the potential market, the market share, and profits for the new product compared to the costs. In politics, a feasibility study is a candidate's assessment of the resources needed to run a successful political campaign and the benefits of elected office.
  • 33. Planning Analyze the work to be done and develop time estimates for completing each of the activities. For example, the company must design the new product; source and order the materials, equipment, and tools; choose the process to use; design the layout; write the job instructions; do a pilot run; evaluate the process and the product design; and transition the product to manufacturing. In politics, planning might include deciding how to raise funds, schedule personal appearances and debates, handle public relations, and adopt policy positions. Execution Carry out the activities that make up the project. In business, the execution of the project entails completing the product design, obtaining the materials and equipment needed, setting up the process, writing job instructions, and making the product. For a political candidate, execution includes fund-raising, making public appearances,
  • 34. and showcasing the political message. Termination End the project. After this date, resources can be used for different activities. In business, termination means product design engineers work on new products, purchasing agents can return to routine activities or a new project, and manufacturing engineers work on new projects. For a political candidate, termination means serving in an elected office or looking for a new job. See the below table for a summary of these project life-cycle phases. Concept Identify the need for the project. Feasibility analysis or study Evaluate costs, benefits and risks. Planning Decide who does what, how long it should take, and what you need to do it.
  • 35. Network Planning Techniques Program evaluation and review technique (PERT) and critical path method (CPM) date back to the 1950s. PERT was originally developed to plan and monitor the Polaris missile, an extremely large project using over 3000 contractors and involving thousands of activities. PERT is credited with reducing the project duration by two years. Because of its success, most government contracts still require the use of PERT or a similar technique. CPM was initially developed to plan and coordinate maintenance projects in chemical plants. The benefits of network planning techniques include the following:
  • 36. • Graphical display of the project, including the relationships and sequence of activities. • Estimate of the expected project length. • Method for determining which activities are critical to the timely completion of the project and are therefore included in the critical path. • Method for determining the amount of slack associated with individual project activities. Estimating The Probability Of Completion Dates An advantage of using probabilistic time estimates is the ability to predict the probability of project completion dates. We learned how to calculate the expected time for each activity with the three time estimates provided. Now we need to calculate the variance for each activity. The variance of the beta probability distribution for each activity is
  • 37. When you know the expected completion time of each path and its variance, you can determine the probability of specific completion dates. For example, you may want to know the probability of completing the project in 48 weeks. We can use the following formula to determine the probability of finishing each of the paths at a specified date: Execution Termination Do the project. End the Project. or
  • 38. For a particular path through the project, the z value shows the path's number of standard deviations that the specified time is past the expected path completion time. A negative z value shows that the specified time is earlier than the expected path completion time. After calculating the z value, you can look it up in Appendix B to determine the probability of finishing the path by the specified time. Note that the probability of finishing the path by the specified time equals the area under the normal curve to the left of z, as shown in Figure 16-12. Reducing Project Completion Time You may need to reduce the time you spend finishing a particular project because of deadlines, promised completion dates, penalty clauses for late completion, or the need to put resources on a new project. When you plan a project, you make time estimates based on normal procedures and resources. However, you may be able to
  • 39. speed up a project by making additional resources available. For example, your company could have materials shipped via premium rather than normal transportation to get the materials faster and the activity finished sooner. You could authorize overtime to speed up an activity. Another possibility, as is done in highway construction, is to bring in lights so workers can work through the night and minimize traffic disruptions. Whatever the method, you can often reduce the time needed to finish an activity. Crashing Projects At the same time that you shorten a project's duration, you also need to minimize the additional expense. We call shortening a project crashing the project. To crash the project and minimize expense, you need additional information about your project activities.
  • 40. Project management techniques provide a structure for the project manager to track the progress of different activities required to complete the project. Particular concern is given to critical path (the longest connected path through the project network) activities. Any delay to a critical path activity affects the project completion time. These techniques indicate the expected completion time and cost of a project. The project manager reviews this information to ensure that adequate resources exist and that the expected completion time is reasonable. If the expected completion date has a high probability of exceeding a contractual due date and incurring penalty costs, the project manager evaluates different methods for crashing the project (reducing project completion time). This evaluation is used to economically justify the application of more resources or to acknowledge a high probability of facing penalty costs. The project manager also
  • 41. looks at the resource load profile in an attempt to level resource requirements for the project. After resolving the issue of resources, the project manager tracks the progress of the project. Once the earliest and latest start and finish times are determined, the The Critical Chain Approach The critical chain approach is to get projects done faster and more consistently at or before the project due date. The focus is on the final due date rather than on individual activities or project milestones. The idea of the critical chain is that project activities are uncertain. Because of this uncertainty, we add safety time to project time estimates. In some cases, the safety time added exceeds 200 percent of the work time estimate. The critical chain, focuses on keeping the bottleneck busy, we can put time buffers before bottlenecks in the critical path. The feeding buffer protects the critical path from delays in noncritical paths. When the delay exceeds the feeding buffer,
  • 42. the project completion date is still protected by the project buffer. (For more information, see Critical Chain by Eliyahu M. Goldratt.) http://www.goldratt.co.uk/resources/critical_chain/index.html Video 9 http://www.youtube.com/watch?v=BRMDCRPGYBE Project Management within OM: How it all Fits Together http://www.goldratt.co.uk/resources/critical_chain/index.html http://www.youtube.com/watch?v=BRMDCRPGYBE production and material planners order materials and schedule required operations. The project manager interacts with the people responsible for different project activities and informs them of any proposed project schedule changes. Project Management OM Across The Organization Since projects tend to be long term and consume a company's resources, functional areas through the company work with expected completion dates, resource requirements, and the consequences of activity delays. Let's look at how the
  • 43. functional areas use project management information. Accounting uses project management information to provide a time line for major expenditures associated with the project. Accounting measures actual cost performance against planned costs to calculate profits. Accounting also calculates the cost benefit of crashing a particular project. Marketing uses project management information to monitor the progress of a project and to provide honest and realistic updates to the customer. The project schedule allows marketing to evaluate whether or not to crash a project. Information systems develop and maintain the software that supports project management. Choosing, installing, and training users in the appropriate software is vital to successful project management. Purchasing uses project management information to deal with project delays by de- expediting items and rescheduling these items for later delivery. This allows the company to keep a lower inventory investment. Purchasing can also suggest when to avoid late deliveries to keep the project on schedule and how to reduce delivery time to help put a project back on schedule.
  • 44. Operations uses project management information to monitor the progress of activities on and off the critical path and to manage resource requirements in terms of the quantity and time needed for operations. Within an organization, the project manager or an assistant may develop the project schedule, typically using software for projects with many activities. Project managers can be product managers, manufacturing engineers, operations analysts, or office managers. Project management is a function not only of manufacturing companies but of service organizations too. Suppose you are planning the worldwide tour of a major art exhibit. Project scheduling techniques will help you effectively manage the many activities in this and other similar projects for your organization. The Supply Chain Link Project management provides a structure to track the progress of a project. Any delays in an activity on the critical path delay the completion date for the entire project. Projects, such as introducing new products, can be undertaken by a supply chain. Communication among members of the chain to ensure a timely completion of the project is critical. Given that members of the supply chain share information, as well as a common database, all members
  • 45. should have real-time access to the project's progress. Any delays should be communicated throughout the chain. The project management approach indicates the timing and the quantity of resources needed. For manufacturing, this input is needed by the master production scheduler and is used to develop a valid MPS. Subsequently, this is input into the MRP system to develop the planned orders necessary to support the project. Project tracking allows supply chain members to make changes as needed without surprising other members of the chain, thus increasing the chances of completing the project on schedule. For service projects, the input is used by the project manager to develop the project structure. The project manager ensures that members are aware of progress in the service project and the impact of any delays. Think Theory 5
  • 46. Activity Activity Time (weeks) Immediate predecessor(s) A 3 none B 4 A C 2 B D 5 B E 4 C F 3 D G 2 E, F 1. Construct a network diagram using AON notation 2. Using the network diagram constructed (a) Calculate the completion time for the project. (b) Determine which activities are included on the critical path.
  • 47. Summary A project is a unique, one-time event of some duration (weeks, months, or even years) that consumes resources (human, capital, materials, and equipment capacity) and is designed to achieve an objective in a given time period. In business, projects can be designing new products, installing new systems, constructing new facilities, mounting advertising campaigns, designing information systems, and developing company Web pages. In politics, a project can be designing a political campaign. Each project goes through a five-phase life cycle: concept, feasibility study, planning, execution, and termination. In the concept phase, we identify the need for the project. With the feasibility study, we evaluate expected costs, benefits, and risks.
  • 48. Planning consists of calculating the work and the time to do it; execution is doing the work; and termination is finishing the project. Two network planning techniques are PERT and CPM. PERT uses probabilistic time estimates. CPM uses deterministic time estimates. PERT and CPM determine the critical path of the project and the estimated completion time. On smaller projects, we determine completion time by evaluating each connected path through the network. On larger projects, software programs are available to identify the critical path. PERT uses probabilistic time estimates to determine the probability that a project will be done by a specified time. We calculate a z value and then determine the probability that the critical path and other near-critical paths will be completed by a given date.
  • 49. To reduce the length of a project, we need to know the critical path and the cost of reducing individual activity times. Crashing activities that are not on the critical path typically does not reduce project completion time. The critical chain approach removes excess safety time from individual activities and creates a project buffer at the end of the critical path. Feeder buffers are used on noncritical paths merged with the critical path. Practical Questions The “problems” within chapter 16 are good practice. The answers are given for most of them; I have the rest, let me know if you need any in particular. Spend 20 minutes to go through all these problems. Discussion Question There will be no discussion question this week. Spend your time working on the assignment and the practical problems.
  • 50. Article to read This web site had some interesting blogs. Check out this blog “How to Avoid Project Burnout”, less than 5 minutes reading. http://www.projectsmart.co.uk/how-to-avoid-project- burnout.html E Reading References 1. http://www.netmba.com/operations/project/gantt/ - Gantt Charts 2. Reid R., Operations Management, 4 th Edition, 2011, Wiley Publishers Think Theory Ideas - Solution s 1.
  • 51. 2. a. Project completion time = 17 weeks b. Critical activities: A, B, D, F, G http://www.projectsmart.co.uk/how-to-avoid-project- burnout.html http://www.netmba.com/operations/project/gantt/ MBALN-670 Operations Management Title of the topic 4 Inventory Management – inclusive of Lean Systems (JIT) and Forecast and Demand Planning.
  • 52. Topic’s learning objectives 1. Identify and critique the strategic frameworks of operations and quality management within a global business environment. 2. Comprehensive knowledge of the main concept and methods related to designing and managing operations and supply chains. 3. Systematic application of a range of fundamental operational improvement concepts. 4. Critically evaluate the role of operations within different business models / functions. Introduction This week we will study how organisations use inventory
  • 53. management concepts as part of their operational strategy. The material is broken down into 3 parts. Part 1 - Lean Systems / Just in Time is the simplest form means getting the right quantity of goods at the right place and at the right time. The goods arrive just-in- time, which is where the term JIT comes from. JIT considers reducing waste. We will look at how JIT is connected to the Total Quality Management strategies of the business. Part 2 - We will identify principles of forecasting and demand planning and observing the steps involved in the forecasting process and the
  • 54. different types of forecasting methods. Part 3 – Effective Inventory Management is a crucial aspect of a successful business practice. We will explore key business practises and principles to carefully balance and manage inventory (goods, raw materials and finished products) Learning Material Part 1 - Lean Systems / JIT Systems The philosophy of JIT originated in Japan. After World War II, the Japanese set themselves the goal of strengthening their industrial base, which included full
  • 55. employment and a healthy trade balance. Just-in-time (JIT) developed out of the nation's need to survive after the devastation caused by the war. Although many authors say that the origins of JIT can be traced back to the early 1900s, no one can argue that the philosophy gained worldwide prominence in the 1970s. It was developed at the Toyota Motor Company, and the person most often credited with its development is Taiichi Ohno, a vice president of the company. JIT helped propel Toyota into a leadership position in the areas of quality and delivery. Since then, JIT has been widely adopted in all types of industries and has been credited with
  • 56. impressive benefits, including significant reductions in operating costs, improved quality, and increased customer responsiveness. Companies such as Honda, GE, Ford, Boeing, Lockheed Martin, Hewlett-Packard, and IBM are among those that have made JIT part of their operations. Even the retailer Zara relies on JIT. The central belief of the JIT philosophy is elimination of waste, but there are other beliefs that help define JIT philosophy. These include a broad view of operations, simplicity, continuous improvement, visibility, and flexibility. Next we look more closely at each of these beliefs.
  • 57. Eliminate Waste The underlying premise of JIT is that all waste must be eliminated. Many think that the roots of the philosophy can be traced to the Japanese environment, which lacks space and natural resources. As a result, the Japanese have been forced to learn to use all their resources very efficiently, and waste of any kind is not tolerated. In JIT waste is anything that does not add value. Types of waste can include material, such as excess inventory to protect against uncertain deliveries by suppliers or poor quality. Waste can be equipment that is used as a backup because regular equipment is not maintained properly. Other types of waste include time, energy,
  • 58. space, or human activity that does not contribute to the value of the product or service being produced. The concept of waste addresses every aspect of the organization and has a far- reaching impact. For example, waste can be found in the production process itself, and JIT requires perfect synchronization in order to eliminate waiting and excess stock. Waste is also found in improper layout that necessitates the transportation of goods from one part of the facility to another. JIT requires a streamlined layout design so that resources are in close proximity to one another and material handling
  • 59. is kept to a minimum. Also, JIT requires compact layouts and increased visibility so that everyone can see what everyone else is doing. Waste can also take the form of poor quality, because scrap and rework cost money and add no value. Total quality http://edugen.wileyplus.com/edugen/courses/crs5658/reid5049/r eid5049c07/reid5049/reid5049c07/reid5049c07xlinks.xform?id= reid5049c07-tdef-0005 management (TQM) programs thus are an integral part of JIT. Waste is also found in unnecessary motion, and JIT requires studying processes to eliminate unnecessary steps. A Broad View of Operations
  • 60. Part of the philosophy of JIT is that everyone in the organization should have a broad view of the organization and work toward the same goal, which is serving the customer. In traditional organizations, it is very easy for employees to focus exclusively on their own jobs and have a narrow view of the organization that includes only their assigned tasks. Companies whose employees have a narrow view become production-oriented, forgetting that individual tasks and procedures are important only if they meet the overall goals of the company. One example is an employee who will not help a customer with a problem, saying, “It's not my job.” This might occur at a grocery store when a customer asks for the
  • 61. location of an item from an employee who is “only responsible for stocking shelves.” A broad view of operations involves understanding that all employees are ultimately responsible for serving the customer. Simplicity JIT is built on simplicity—the simpler the better. JIT encourages employees to think about problems and come up with simple solutions. Although this may seem easy and crude, it is actually quite difficult. It is often tempting to solve an organizational problem using a complex and perhaps expensive method. It is far more difficult to
  • 62. think of a simple solution that goes directly to the root of the problem. The value of simple solutions is demonstrated by a company whose delivery truck was lodged in a passageway because it was too high to pass through. Many costly and complex solutions were being considered, such as getting a smaller truck or expanding the height of the doorway. After a bit of thought, an employee came up with a simple solution: reduce the air in the tires to bring down the height of the truck. The solution worked. Continuous Improvement A major aspect of the JIT philosophy is an emphasis on quality. Continuous
  • 63. improvement, called kaizen by the Japanese, in every aspect of the operation is a cornerstone of this philosophy. Continuous improvement applies to everything from reducing costs to improving quality to eliminating waste. Food for Thought To understand the full impact of continuous improvement, try answering this question: When has JIT been implemented fully? The answer: Never. The reason is that an organization is never perfect and can always be improved in some way. A number of companies are utilizing a powerful JIT approach called the “kaizen
  • 64. blitz.” This is an improvement tool that utilizes cross-functional teams to plan and deliver improvements to specific processes during two- or three-day marathon http://edugen.wileyplus.com/edugen/courses/crs5658/reid5049/r eid5049c07/reid5049/reid5049c07/reid5049c07xlinks.xform?id= reid5049c07-tdef-0006 http://edugen.wileyplus.com/edugen/courses/crs5658/reid5049/r eid5049c07/reid5049/reid5049c07/reid5049c07xlinks.xform?id= reid5049c07-tdef-0006 http://edugen.wileyplus.com/edugen/courses/crs5658/reid5049/r eid5049c07/reid5049/reid5049c07/reid5049c07xlinks.xform?id= reid5049c07-tdef-0007 http://edugen.wileyplus.com/edugen/courses/crs5658/reid5049/r eid5049c07/reid5049/reid5049c07/reid5049c07xlinks.xform?id= reid5049c07-tdef-0008 http://edugen.wileyplus.com/edugen/courses/crs5658/reid5049/r eid5049c07/reid5049/reid5049c07/reid5049c07xlinks.xform?id= reid5049c07-tdef-0008 sessions. This process allows a small group of people to concentrate on a bite-size
  • 65. chunk of the problem for a short period of time. Companies find that a kaizen blitz can quickly deliver dramatic and low-cost improvements to processes. Visibility Part of the JIT philosophy is to make all waste visible. Waste can be eliminated only when it is seen and identified. Also, if we see waste we can come up with simple solutions to eliminate it. When waste is hidden we forget about it, which creates problems. Think about the closets in your home. Because the closet doors are closed, we often
  • 66. forget the clutter and junk we have inside. Now imagine that the closet doors were open and the inside was visible to us and everyone else. Certainly it would remind us that we need to eliminate the clutter. JIT facilities are open and clean, with plenty of floor space. There is no clutter, and everyone can see what everyone else is doing. No one can hide extra inventory in a corner of his or her office or take a short nap in the afternoon. Also, part of the JIT philosophy is that a cluttered environment creates confusion and disrespect toward the workplace. By contrast, a clean and orderly environment creates calm and clear thoughts. Just because space is available, it should not
  • 67. automatically be filled. Visibility allows us to readily see waste. We can then eliminate it. Flexibility JIT was based on the need for survival, and survival means being flexible in order to adapt to changes in the environment. A company can be flexible in many ways. First, flexibility can mean being able to make changes in the volume of a product produced. JIT accomplishes this by keeping the costs of facilities, equipment, and operations at such a low level that breaking even typically is not a problem. A second way in which a company can be flexible is by being
  • 68. able to produce a wide variety of products. Although this is difficult to achieve, JIT systems are designed with the ability to produce different product models with different features through a manufacturing process that can easily switch from one product type to another by flexible workers who can perform many different tasks. Part of the JIT philosophy is to design operations that are highly efficient but flexible in order to accommodate changing customer demands. http://edugen.wileyplus.com/edugen/courses/crs5658/reid5049/r eid5049c07/reid5049/reid5049c07/reid5049c07xlinks.xform?id= reid5049c07-tdef-0009 http://edugen.wileyplus.com/edugen/courses/crs5658/reid5049/r eid5049c07/reid5049/reid5049c07/reid5049c07xlinks.xform?id= reid5049c07-tdef-0010
  • 69. Figure 7-1 elements of JIT (WileyPlus) JIT within the Organisation and Across other Functions Accounting is strongly affected by JIT. Traditional accounting systems generally allocate overhead on the basis of direct labour hours. The problem with this method is that it does not accurately describe the actual use of overhead by different jobs. For example, jobs that are labour intensive in nature may be assigned a disproportionately high share of overhead. These numbers may lead management to
  • 70. make inappropriate decisions. JIT relies on activity-based costing to allocate overhead. In activity-based costing, specific costs are identified and then assigned to various types of activities, such as inspection, movement of goods, and machine processing. Overhead costs are then assigned to jobs depending on how many activities a particular job takes up. Marketing plays a large role in JIT, as the interface with customers becomes more important. JIT focuses on customer-driven quality, not quality as defined by the producer. Marketing managers must understand customer needs and ensure that
  • 71. this information is passed on to operations managers for proper design, production, and delivery of the product or service. Finance is responsible for approving and evaluating financial investments. Switching to a JIT system proves financially beneficial in the long run but generally requires an investment in resources. Included are hiring consultants, training workers, purchasing or modifying equipment, more record keeping, and rearrangement of facilities. Finance must evaluate these investments and measure their performance, which requires an understanding of JIT. Engineering plays a major role in JIT. As we have seen in this
  • 72. chapter, reduction of setup time is critical to the success of JIT. It is up to engineering to design machines so as to reduce setup time and to design poka-yoke, or foolproof devices that prevent defects from occurring. Engineering is largely responsible for designing the mechanisms that enable JIT to function as desired. Without engineering, true JIT could not exist. Information systems (IS) create the network of information necessary for JIT to function. JIT is based on the assumption that information about
  • 73. quality, inventory levels, order status, and product returns is available to everyone in the organization. This type of information needs to be readily available and up- to-date. Otherwise, a JIT system would come to a halt. Communication with suppliers is another prerequisite of JIT that requires a high-level information system. JIT cannot function without the ongoing involvement of IS. In turn, IS needs to understand JIT functioning and information requirements. The Supply Chain Link
  • 74. The concept of JIT naturally extends itself to the entire supply chain. The philosophy of JIT teaches us that waste anywhere in the system hinders efficiency, doesn't provide value to the customer, and ultimately increases cost. Every organization is just one element of an entire supply chain system. As such, waste anywhere in the supply chain is ultimately passed down to other members of the chain and the final customer. Also recall that JIT views a company's suppliers as the external factory, focuses on building long-term relationships with suppliers, and promotes sharing data along the supply chain. In fact, a company's pull system cannot work properly unless its suppliers are also using it. Otherwise, the JIT system of the company would not be able to function properly, as there would be no guarantee of stable deliveries. Therefore, the principles of JIT need to be adopted by all
  • 75. members of a supply chain in order to have a full impact. This is often referred to as a lean supply chain. Dell provides a good example of the impact JIT can have when it is implemented along the supply chain. The company has a build- to-order model that produces computers only when there is actual customer demand. Dell has implemented a JIT system throughout its supply chain and shares demand information with its suppliers. As a result, Dell is able to introduce new technologies in its computers much quicker than competitors because they are seamlessly available in the supply chain. Dell also works closely with its suppliers to reduce inventories, align processes, and eliminate waste across the supply chain. The result has been high responsiveness at a competitive price.
  • 76. Discussion question 3 - JIT Explain how you think JIT techniques can be used by the Food and Beverage Operations to meet guest needs for a variety of fresh foods in just the right quantity at just the right time. Case Study Mcdonalds uses JIT to reduce waste and keep costs low. Please read the blog on the page below. Otherwise, this can be found on the VLE. Please contribute your views to this article as part of Discussion 4 – McDonalds
  • 77. http://www.inventorymanagementreview.org/2005/11/mcdonalds _a_gui.html Part 2 - Principles of Forecasting There are many types of forecasting models. They differ in their degree of complexity, the amount of data they use, and the way they generate the forecast. However, some features are common to all forecasting models. They include the following: 1. Forecasts are rarely perfect. Forecasting the future involves uncertainty. Therefore, it is almost impossible to make a perfect prediction. Forecasters know that they have to live with a certain amount of error, which is the difference between what is forecast and what actually happens. The goal of forecasting is to generate good forecasts on the average over time and to keep
  • 78. forecast errors as low as possible. 2. Forecasts are more accurate for groups or families of items rather than for individual items. When items are grouped together, their individual high and low values can cancel each other out. The data for a group of items can be stable even when individual items in the group are very unstable. Consequently, one can obtain a higher degree of accuracy when forecasting for a group of items rather than for individual items. For example, you cannot expect the same degree of accuracy if you are forecasting sales of long-sleeved hunter green polo shirts that you can expect when forecasting sales of all polo shirts. 3. Forecasts are more accurate for shorter than longer time horizons. The shorter the time horizon of the forecast, the lower the degree of uncertainty. Data do not change very much in the short run. As the time horizon increases, however, there
  • 79. is a much greater likelihood that changes in established patterns and relationships will occur. Because of that, forecasters cannot expect the same degree of forecast accuracy for a long-range forecast as for a short-range forecast. For example, it is much harder to predict sales of a product two years from now than to predict sales two weeks from now. Steps in Forecasting Process Regardless of what forecasting method is used, there are some basic steps that should be followed when making a forecast: http://www.inventorymanagementreview.org/2005/11/mcdonalds _a_gui.html 1. Decide what to forecast. Remember that forecasts are made in order to plan for the future. To do so, we
  • 80. have to decide what forecasts are actually needed. This is not as simple as it sounds. For example, do we need to forecast sales or demand? These are two different things, and sales do not necessarily equal the total amount of demand for the product. Both pieces of information are usually valuable. An important part of this decision is the level of detail required for the forecast (e.g., by product or product group), the units of the forecast (e.g., product units, boxes, or dollars), and the time horizon (e.g., monthly or quarterly). 2. Evaluate and analyze appropriate data. This step involves identifying what data are needed and what data are available. This will have a big impact on the selection of a forecasting model. For example, if you are predicting sales for a new product, you may not have historical sales information, which would limit your use of forecasting models that require quantitative data.
  • 81. 3. Select and test the forecasting model. Once the data have been evaluated, the next step is to select an appropriate forecasting model. As we will see, there are many models to choose from. Usually we consider factors like cost and ease of use in selecting a model. Another very important factor is accuracy. A common procedure is to narrow the choices to two or three different models and then test them on historical data to see which one is most accurate. 4. Generate the forecast. Once we have selected a model, we use it to generate the forecast. But we are not finished, as you will see in the next step. 5. Monitor forecast accuracy. Forecasting is an ongoing process. After we have made a forecast, we should record what actually happened. We can then use that information to monitor our forecast accuracy. This process should be carried out continuously because
  • 82. environments and conditions often change. What was a good forecasting model in the past might not provide good results for the future. We have to constantly be prepared to revise our forecasting model as our data change. Forecasting methods Now turn to your ebook, review the time series and casual methods of forecasting. The diagrams are useful to demonstrate how this is done. Part 3 - Inventory Management Finally we explore Inventory Management. Inventory comes in many shapes and sizes. Most manufacturing firms have the
  • 83. following types of inventory. Raw materials are the purchased items or extracted materials that are transformed into components or products. For example, gold is a raw material that is transformed into jewellery. Components are parts or subassemblies used in building the final product. For example, a transformer is a component in an electronic product. Work-in-process (WIP) refers to all items in process throughout the plant. Since products are not manufactured instantaneously, there is always some WIP inventory flowing through the plant. After the product is completed, it becomes finished goods—the bicycles, stereos, CDs, and automobiles
  • 84. that the company sells to its customers. Distribution inventory consists of finished goods and spare parts at various points in the distribution system—for example, stored in warehouses or in transit between warehouses and consumers. Maintenance, repair, and operational (MRO) inventory are supplies that are used in manufacturing but do not become part of the finished product. Examples of MRO are hand tools, lubricants, and cleaning supplies. How Companies use Inventory Management
  • 85. 1. Anticipation or seasonal inventory 2. Fluctuation Inventory or Safety stock: buffer demand fluctuations 3. Lot-size or cycle stock: take advantage of quantity discounts or purchasing efficiencies 4. Transportation or Pipeline inventory 5. Speculative or hedge inventory protects against some future event, e.g. labor strike 6. Maintenance, repair, and operating (MRO) inventories Objectives of Inventory Management Provide desired customer service level o Customer service is the ability to satisfy customer
  • 86. requirements o Percentage of orders shipped on schedule o Percentage of line items shipped on schedule o Percentage of $ volume shipped on schedule o Idle time due to material and component shortages Provide for cost-efficient operations: o Buffer stock for smooth production flow o Maintain a level work force o Allowing longer production runs & quantity discounts Minimum inventory investments: o Inventory turnover o Weeks, days, or hours of supply
  • 87. Customer service level examples Percentage of Orders Shipped on Schedule o Good measure if orders have similar value. Does not capture value. o If one company represents 50% of your business but only 5% of your orders, 95% on schedule could represent only 50% of value Percentage of Line Items Shipped on Schedule o Recognizes that not all orders are equal, but does not capture $ value of orders. More expensive to measure. Ok for finished goods. o A 90% service level might mean shipping 225 items out of the total 250 line items totaled from 20 orders scheduled
  • 88. Percentage Of Dollar Volume Shipped on Schedule o Recognizes the differences in orders in terms of both line items and $ value Follow the “Solved Demo Problem” within the Wileyplus ebook. This will demonstrate how the formulas are used for determining order quantities. Video 6 Eagle Ridge Spa Inventory Management http://www.youtube.com/watch?v=rCrR3kckyvA Also within Wiley Plus book
  • 89. Article to Read Further Reading o Just in Time Inventory Management http://accounting4management.com/just_in_time.htm Think Theory 5 There will be no think theory exercises this week as I would like you to focus on working through the problems and formula I have guided you to within your ebook. http://www.youtube.com/watch?v=rCrR3kckyvA http://accounting4management.com/just_in_time.htm
  • 90. o Companies that use JIT management o Harley Davidson o Toyota Motor Company o General Motors o Ford Motor Company – Review their websites to understand how they use JIT today. o Read more at http://accounting4management.com/just_in_time.htm#OdLquAm S2AB6GCP m.99 o What is Inventory Management - http://merchantos.com/articles/inventory/what-is-inventory-
  • 91. management/ Topic’s summary JIT is a philosophy that was developed by the Toyota Motor Company in the mid- 1970s. It has since become the standard of operation for many industries. It focuses on simplicity, eliminating waste, taking a broad view of operations, visibility, and flexibility. Three key elements of this philosophy are JIT manufacturing, total quality management, and respect for people. JIT views waste as anything that does not add value, such as unnecessary space, energy, time, or motion.
  • 92. Traditional manufacturing systems use “push” production, whereas JIT uses “pull” production. Push systems anticipate future demand and produce in advance in order to have products in place when demand occurs. This system usually results in excess inventory. Pull systems work backwards. The last workstation in the production line (or the customer) requests the precise amounts of materials required. JIT manufacturing is a coordinated production system that enables the right quantities of parts to arrive when they are needed precisely where they are needed. Key elements of JIT manufacturing are the pull system and
  • 93. kanban production, small lot sizes and quick setups, uniform plant loading, flexible resources, and streamlined layout. JIT considers people to be the organization's most important resource. All employees are highly valued members of the organization. Workers are empowered to make decisions and are rewarded for their efforts. Team efforts make possible cross-functional and multilayer coordination. http://accounting4management.com/just_in_time.htm#OdLquAm S2AB6GCPm.99 http://accounting4management.com/just_in_time.htm#OdLquAm S2AB6GCPm.99 http://accounting4management.com/just_in_time.htm#OdLquAm S2AB6GCPm.99
  • 94. http://merchantos.com/articles/inventory/what-is-inventory- management/ JIT is equally applicable in service organizations, particularly with the push toward time-based competition and the need to cut costs. JIT success is dependent on interfunctional coordination and effort. Marketing must work closely with customers to define customer-driven quality. IS must design a powerful information system. Engineering must develop equipment with low setup time and design jobs with foolproof devices. Finance must monitor financial improvements with realistic expectations. Accounting must develop appropriate
  • 95. costing mechanisms. Forecasting Three basic principles of forecasting are: forecasts are rarely perfect; forecasts are more accurate for groups or families of items rather than for individual items; and forecasts are more accurate for shorter than longer time horizons. The forecasting process involves five steps: decide what to forecast; evaluate and analyze appropriate data; select and test a forecasting model; generate the forecast; and monitor forecast accuracy. Forecasting methods can be classified into two groups:
  • 96. qualitative and quantitative. Qualitative forecasting methods generate a forecast based on the subjective opinion of the forecaster. Some examples of qualitative methods include executive opinion, market research, and the Delphi method. Quantitative forecasting methods are based on mathematical modelling. They can be divided into two categories: time series models and causal models. Time series models are based on the assumption that all the information needed for forecasting is contained in the time series of data. Causal models assume that the variable being forecast is related to other variables in the environment.
  • 97. There are four basic patterns of data: level or horizontal, trend, seasonality, and cycles. In addition, data usually contain random variation. Some forecasting models that can be used to forecast the level of a time series are naïve, simple mean, simple moving average, weighted moving average, and exponential smoothing. Separate models are used to forecast trend, such as trend-adjusted exponential smoothing. Forecasting seasonality requires a procedure in which we compute a seasonal index, the percentage by which each season is above or below the mean. A simple causal model is linear regression, in which a straight-
  • 98. line relationship is modelled between the variable we are forecasting and another variable in the environment. The correlation coefficient is used to measure the strength of the linear relationship between these two variables. Three useful measures of forecast accuracy are mean absolute deviation (MAD), mean square error (MSE), and a tracking signal. There are four factors to consider when selecting a forecasting model: the amount and type of data available, the degree of accuracy required, the length of forecast horizon, and patterns present in the data.
  • 99. Inventory Management Raw materials, purchased components, work-in-process (WIP), finished goods, distribution inventory and maintenance, repair and operating supplies are all types of inventory. Inventories have several uses: anticipation inventory is built before it is needed; fluctuation stock provides a cushion against uncertain demand; cycle stock is a result of the company's ordering quantity; transportation inventory includes items in transit; speculative inventory is a build-up to protect against some future event; and MRO inventory supports daily operations.
  • 100. The objectives of inventory management are to provide the desired level of customer service, to allow cost-efficient operations, and to minimize inventory investment. Customer service can be measured in several ways, including as a percentage of orders shipped on schedule, a percentage of line items shipped on schedule, a percentage of dollar volume shipped on schedule, or idle time due to material and component shortages. Cost-efficient operations are achieved by using inventory as buffer stocks, allowing a stable year-round workforce, and spreading the setup cost over a larger number of units. Inventory investment is measured in inventory turnover and/or
  • 101. level of supply. Inventory performance is calculated as inventory turnover or weeks, days, or hours of supply. Relevant inventory costs include item costs, holding costs, ordering costs, and shortage costs. Holding costs include capital costs, storage costs, and risk costs. Ordering costs are fixed costs for placing an order or performing a setup. Shortage costs include costs related to additional paperwork, additional shipping expense, and the intangible cost of lost customer goodwill. The ABC classification system allows a company to assign the appropriate level of
  • 102. control and frequency of review of an item based on its annual dollar volume. Cycle counting is a method for maintaining accurate inventory records. Determining what and when to count are the major decisions. Retailers, wholesalers, and food service organizations use tangible inventory even though they are service organizations. Proper inventory control and management for these organizations often is the difference between a profit and loss. Since the items are often desirable, organizations must strive to reduce the amount of theft by customers and employees. Magnetic strips, security devices, and surveillance
  • 103. systems are all means of reducing inventory loss. Lot-for-lot, fixed-order quantity, min-max systems, order n periods, periodic review systems, EOQ models, quantity discount models, and single- period models can be used to determine order quantities. Ordering decisions can be improved by analyzing total costs of an inventory policy. Total costs include ordering cost, holding cost, and material cost. Practical considerations can cause a company to not use the optimal order quantity, that is, minimum order requirements.
  • 104. Smaller lot sizes give company flexibility and shorter response times. The key to reducing order quantities is to reduce ordering or setup costs. Calculating the appropriate safety stock policy enables companies to satisfy their customer service objectives at minimum cost. The desired customer service level determines the appropriate z value. Inventory decisions about perishable products (like newspapers) can be made using the single-period inventory model. The expected payoff is calculated to assist the quantity decision.
  • 105. PLEASE SCROLL DOWN FOR ARTICLE This article was downloaded by: [Efstathiou, Victoria] On: 9 March 2011 Access details: Sample Issue Voucher: Total Quality Management & Business ExcellenceAccess Details: [subscription number 934628027] Publisher Routledge Informa Ltd Registered in England and Wales Registered Number: 1072954 Registered office: Mortimer House, 37- 41 Mortimer Street, London W1T 3JH, UK Total Quality Management & Business Excellence Publication details, including instructions for authors and subscription information: http://www.informaworld.com/smpp/title~content=t713447980 Application of the total quality management approach in a Spanish retailer: the case of Mercadona
  • 106. Blanco Callejo Miguela; Gutierrez Broncano Santiagoa a Departamento de Economía de la Empresa, Universidad Rey Juan Carlos, Madrid, Spain Online publication date: 14 December 2010 To cite this Article Miguel, Blanco Callejo and Santiago, Gutierrez Broncano(2010) 'Application of the total quality management approach in a Spanish retailer: the case of Mercadona', Total Quality Management & Business Excellence, 21: 12, 1365 — 1381 To link to this Article: DOI: 10.1080/14783363.2010.530782 URL: http://dx.doi.org/10.1080/14783363.2010.530782 Full terms and conditions of use: http://www.informaworld.com/terms-and-conditions-of- access.pdf This article may be used for research, teaching and private study purposes. Any substantial or systematic reproduction, re-distribution, re-selling, loan or sub- licensing, systematic supply or distribution in any form to anyone is expressly forbidden. The publisher does not give any warranty express or implied or
  • 107. make any representation that the contents will be complete or accurate or up to date. The accuracy of any instructions, formulae and drug doses should be independently verified with primary sources. The publisher shall not be liable for any loss, actions, claims, proceedings, demand or costs or damages whatsoever or howsoever caused arising directly or indirectly in connection with or arising out of the use of this material. http://www.informaworld.com/smpp/title~content=t713447980 http://dx.doi.org/10.1080/14783363.2010.530782 http://www.informaworld.com/terms-and-conditions-of- access.pdf Application of the total quality management approach in a Spanish retailer: the case of Mercadona Blanco Callejo Miguel∗ and Gutierrez Broncano Santiago Departamento de Economı́a de la Empresa, Universidad Rey Juan Carlos, Madrid, Spain
  • 108. This current article analyses the successful application of the total quality management (TQM) model by a firm in the Spanish commercial distribution sector. The TQM model implies a strategic, proactive and global approach that could prove appropriate in the face of a turbulent and changing environment, such as the one firms are currently experiencing. This article uses case study methodology to analyse the process by which Mercadona has implemented its TQM model, which involves different actions oriented to satisfying the needs of customers, employees, suppliers, society and capital. Applying this model allowed Mercadona to overcome a critical situation that threatened its very survival in the early 1990s, and since then the firm has bounced back to a position of leadership in its sector. Its excellent results and growth have caught the attention of both academics and industry rivals, in Spain and internationally. Keywords: total quality management model; stakeholders; satisfaction of
  • 109. expectations; success; organisational excellence Introduction The case of Mercadona presented here is a good example of how a firm has managed to implement the total quality management (TQM) model in the commercial distribution sector. The introduction of this model was a strategic decision taken by the firm’s president in the early 1990s and, as a consequence, the company has been able to differentiate itself from its rivals and hence gain considerable competitive advantage. This strategy has posi- tioned Mercadona as the leading Spanish supermarket chain, as well as the second fastest- growing food retailer in the world (Deloitte, 2007). This article describes the successful implementation of the TQM
  • 110. model in Mercadona and its outcome, which has been a new, remarkable and highly effective way of conceiving its business. The following section offers a brief theoretical discussion of the comprehen- sive TQM model and its orientation toward satisfying the wants and needs of the firm’s stakeholders. Later sections examine the empirical analysis, which uses the case study methodology. Mercadona’s project under the TQM paradigm, its implications for the firm’s five components (customers, employees, suppliers, society and capital), and how the firm tries to satisfy their needs and expectations are described. The article ends with the main conclusions and implications for managers.
  • 111. ISSN 1478-3363 print/ISSN 1478-3371 online # 2010 Taylor & Francis DOI: 10.1080/14783363.2010.530782 http://www.informaworld.com ∗ Corresponding author. Email: [email protected] Total Quality Management Vol. 21, No. 12, December 2010, 1365 – 1381 D o w n l o a d e d B
  • 114. The total quality management model The quality management concept has evolved in recent years, at the same time as the environment has evolved, and business needs to adapt to the changing environment (Ciampa, 1992; De Jouslin De Noray, 1992; Gehani, 1993; Ivancevich, Lorenzi, Skinner, & Crosby, 1985; James, 1991; Schonberger, 1992). This evolution in quality management has led authors to conceive different approaches that share the central position of the quality concept, but that have progressively become increasingly strategic, broad and proactive (Camisón, González, & Cruz, 2006). In fact, the concept of quality management was treated only partially (Deming, 1982;
  • 115. Feigenbaum, 1986; Hunter, 1999; Juran, 1994; O’Dell, 1996; Schein, 1997; Taguchi, 1987) until the arrival of more global approaches that led to the total quality management (TQM) model in the mid- 1980s and 1990s (Deming, 1986; Sashkin & Kaiser, 1993; Waldman, 1994). This approach offers quality management a multidimensional content that pursues the total excellence of the organisation along the firm’s entire value- creation chain (Black & Porter, 1995; Dean & Bowen, 1994; Dean & Evans, 1994; Deming, 1995; Douglas & Judge, 2001; Ghobadian & Gallear, 2001; Van Der Wiele, Williams, & Dale, 2000). Thus, the current TQM model has an interdisciplinary and integrative perspective that
  • 116. considers technical, physical, human and leadership aspects (Ciampa, 1992) and it is part of the strategic management of the company (Luchs, 1986). Introducing the model is the direct responsibility of top management, which assumes a leadership role that is vital for its successful implementation and for improving the firm’s results (Madu & Kuei, 1993). Although TQM is a complex and ambiguous phenomena with several distinct formu- lations and labels (Amsden, Ferratt, & Amsden, 1996; Wicks, 2001) the literature have looked for some commonalities that distinguish quality improvement methods from more traditional management practices (Dean & Bowen, 1994; Spencer, 1994; Wicks,
  • 117. 2001). Evans (1992), in a definition accepted in some relevant articles in the literature (Handfield, Ghosh, & Fawcett, 1998; Larson & Sinha, 1995), defines the TQM model as a people-focused management system that aims at continual increase of customer satisfac- tion at continually lower real cost. Total Quality is a total system approach (not a separate area or programme) and an integral part of high-level strategy; it works horizontally across functions and departments, involves all employees, top to bottom, and extends backwards and forwards to include the supply chain and the customer chain. Total Quality stresses learning and adaptation to continual change as keys to organisational success. Starting from this definition, there are a set of core values of
  • 118. the TQM model (Hellsten, 1997): orientation toward the external customer, orientation toward stakeholders, internal cooperation and teamwork, management’s leadership and commitment, process- and system-based management, orientation toward people or the internal customer, learning, innovation and continuous improvement, building alliances, and external cooperation and ethics (Black & Porter, 1996; Camisón et al., 2006; Deming, 1986; Nayebpour & Koehn, 2003; Pace, 1999; Raiborn & Payne, 1996; Steeples, 1994; Svensson & Wood, 2005; Wicks, 2001). Each of these principles is dealt with by developing different programmes in which all the firm’s employees participate. The model has three aims: to
  • 119. create value for all stakeholders; to gain competitive advantages and achieve superior income to competitors; and to produce a culture, organisation and management style that fosters commitment, participation and internal cooperation (Camisón et al., 2006). One of the fundamental aspects of the model is the relationship with the organisation’s stakeholders, with the objective being to achieve maximum satisfaction of their expec- tations (Lagrosen, 2001). This approach leads to the implementation of the most advanced 1366 B.C. Miguel and G.B. Santiago D o w n
  • 122. h 2 0 1 1 practices in human resources management, logistics, production, relationship with suppli- ers and customers, and organisational design. The aim is to permanently stimulate the commitment, participation and cooperation of all the firm’s stakeholders. In this respect, total quality is based on two considerations. First, recognition that the firm has social responsibilities to all its stakeholders – owners, consumers, employees, suppliers and society (Svensson & Wood, 2005; Vinten, 1998). And
  • 123. second, that top management needs the leadership skills required to motivate all stakeholders to share its holistic vision of the social contract and act accordingly (Laszlo, 1998). In order to verify the application of the TQM model and observe the initiatives put in place within the framework of this model, this study uses the exploratory case study as its research methodology. The literature suggests that the choice of research methodology is contingent on the problems and questions being analysed and the state of development of the area of knowledge (Eisenhardt, 1989; Pettigrew, 1990; Yin, 1994). Case study meth- odology is suitable for this study because it fully satisfies Yin’s (1994) premises. Yin rec-
  • 124. ommends the methodology first, when the researcher aims to test a theory that specifies a particular set of results in a specific situation, and has identified a firm in this situation. The case could be a critical test of the theory and of its applicability to the organisation. Second, if the researcher aims to study some specific characteristics of a rare, extraordinary or extreme situation in which the organisation finds itself, they can use this methodology to compare or contrast. Finally, the researcher can use case study methodology to analyse a situation or organisation that has been studied infrequently and that is unique, and can then hope to learn something new and important. In this sense, Mercadona seems to be an outstanding example of TQM implementation, with some
  • 125. specific characteristics that have made this company virtually unique in the way it has developed the model. This extra- ordinary situation is justified on the basis of the circumstances that made its adoption and subsequent development possible, bringing about a profound transformation in the company and putting it in a privileged position in the retailing sector in Spain. The case of Mercadona Mercadona is a family firm dedicated to the commercial distribution of food and hygiene products. The firm runs large supermarkets (.1000 m 2 ) following a model of local city- centre stores. The company name, Mercadona SA, appeared in 1977, but the company
  • 126. actually originated in Cárnicas Roig, a family firm owned by Francisco Roig Ballester and specialising in carving and selling meat. The firm subsequently evolved into a chain of eight grocer’s shops, Mercadona (1999 – 2007). In 1981, one of Francisco’s sons, Juan Roig, now running the firm, built a small com- mercial chain of various stores, which soon began to grow in size, first in the Valencia region and then in other areas in Spain. The firm’s expansion coincided with a period of growth in the commercial distribution sector in Spain, which had various causes, in par- ticular, the increasing concentration of the population within cities and the entry of women into the labour market. This growth attracted the attention of the
  • 127. large European distri- bution chains, which began to enter Spain. The strategy of these large companies was to open major retail outlets (hypermarkets) and offer low prices in particular products, accompanied by strong promotions, special offers and discounts that were supported by aggressive advertising campaigns in the media (Navarro, 2005). The firms achieved low prices by putting pressure on their suppliers to cut their prices as far as possible. Custo- mers, attracted by the low prices on some products, also bought other products not on special offer that yielded high profit margins. Total Quality Management 1367 D
  • 130. a r c h 2 0 1 1 As a consequence of this strategy, in the 1990s, the food distribution sector became highly concentrated, and foreign multinationals controlled a large part of the market. Com- petition from these firms intensified rivalry in the industry, which was now mature, with strong competition and low margins. Mercadona responded to this highly changeable and turbulent environment by adopting a similar policy to that of the
  • 131. large hypermarket chains. The retailer put downward pressure on its suppliers’ prices and ran intensive advertising campaigns to promote its special offers every day. But the results were not as good as expected, since this was the same strategy as the big hypermarket chains. Mercadona was selling more, but every year its profits declined. 1 This was a very tricky time for Mercadona, which had to face some extremely difficult situations. Nevertheless, the president ignored tempting offers to buy the company and stuck firmly to his commitment to remain in the business. Thus, in 1993, Juan Roig decided to implement a strategy that broke radically with the dynamic of the sector: he
  • 132. introduced the TQM model. This initiative translated into a new commercial strategy sum- marised in a simple slogan ‘Siempre Precios Bajos’ (SPB, which translates as ‘Always Low Prices’). While its competitors continued with their massive daily advertising cam- paigns in the media, Mercadona immediately stopped all its advertising spending. Merca- dona cancelled all its special offers and made a commitment to its customers always to sell at the same price, and to its suppliers to remain loyal to them and maintain stable prices for years (Caparrós & Biot, 2006). This was quite a turnaround, as suppliers had previously seen Mercadona as one of the toughest negotiators. The firm’s main objective was to
  • 133. protect itself in the midst of all this turbulence and implement an unusual and original model, novel in the commercial distribution sector: price, supplier and employee stability to achieve permanent customers. The results immediately after adopting the new model were not very promising: although the firm managed to practically double its sales from four years before, its profits were less than half. But the president stuck by his decision and firmly maintained the strategy based on the new management model. In 1995, its performance improved, and Mercadona soon entered a spectacular and unstoppable process of growth, which was mainly organic. Mercadona supermarkets spread out throughout the whole country like
  • 134. an olive oil spill. The company is now one of the most profitable and widely distributed supermarket chains in the Spanish market. Mercadona currently employs more than 60,000 workers, runs more than 1100 supermarkets dotted practically all over the country, and earned a net profit of E336m in the last accounting year (Mercadona, 1999 – 2007). Moreover, in recent years, Mercadona has maintained a rate of new super- market openings of nearly 100 per year (Figure 1). The growth rate in its sales of .25% per year in the second half of this period makes Mercadona the 14th fastest- growing retailer in the world, and the second fastest-growing food distributor in the
  • 135. world, after the American commercial distribution giant Wal- Mart (Deloitte, 2007). Mercadona’s management firmly believes that adopting and maintaining the TQM model has been critical in allowing the firm to achieve this rate of growth and these spec- tacular economic results. Through this approach, management has impressed on the firm a clear orientation to satisfy the needs and expectations of all its stakeholders. On the basis of this approach, Mercadona has defined five components in the firm: customers, employ- ees, suppliers, society and capital. All are equally important, but in that sequential order, Mercadona (1999 – 2007). Mercadona’s TQM model starts from a universal premise: ‘to be satisfied, first you have
  • 136. to satisfy everyone else’ (Mercadona, 1999 – 2007). Thus, in the first place, Mercadona orients its entire business model towards the complete satisfaction of its customers, 1368 B.C. Miguel and G.B. Santiago D o w n l o a d e d B y : [
  • 138. 0 9 : 1 4 9 M a r c h 2 0 1 1 which the firm considers so important that internally it calls them its ‘bosses’. In the same
  • 139. sense, the management is convinced that the workers – who are the people who have to satisfy the customers in the stores – must, in turn, be satisfied. This is why the firm has estab- lished its own way of managing its employees, implementing policies that seek to encourage their self-realisation through job security and stability, training, internal promotion and improvements in their quality of life. It is the suppliers’ products that have to maximally satisfy the firm’s customers, so Mercadona has established a relationship with its suppliers based on trust, cooperation, mutual collaboration and stability. Society is the medium through which the firm carries out its activities, so Mercadona feels involved with and ethically committed to its protection and development. Finally,
  • 140. by satisfying the needs of its customers, employees, suppliers and society, Mercadona contributes to satisfying the expectations of the fifth component of its model, capital (Figure 2). Despite its apparent simplicity, applying the TQM model is neither simple nor easy. In fact, one of the main difficulties is to introduce and develop programmes and tools that allow the firm to satisfy each and every one of its diverse components, and at the same time, ensure that the components perceive that the firm is satisfying their needs so the firm transmits the image of a responsible and committed company. In any case, with this powerful model, Mercadona has gained competitive advantages over its rivals, has been able to globally
  • 141. orient its strategy and organisational culture and has had adopted a coherent decision- making tool. So, any initiative proposed in the company must first be evaluated for its compliance with the model. The firm adopts and implements proposals only when their consequences are satisfactory to all five components, otherwise it rejects them. Orientation toward customer satisfaction One of the fundamental cornerstones of the TQM model is its orientation toward satisfying customer needs. This is why Mercadona puts the customer in a privileged position and carries out a large number of activities and initiatives to be able to care for its customers, strengthen their loyalty and help them generate the maximum
  • 142. possible value from doing their shopping in Mercadona stores (Figure 3). Figure 1. Evolution in the number of Mercadona supermarkets 1996 – 2006. Source: Mercadona Annual Reports. Total Quality Management 1369 D o w n l o a d e d B y :
  • 144. : 0 9 : 1 4 9 M a r c h 2 0 1 1 For Mercadona, the customers are at the centre of its activity, because its very survival
  • 145. depends on their decision to shop in Mercadona supermarkets or elsewhere. Thus, the firm calls anyone who shops in its stores ‘boss’. Under this premise, the whole organisation is focused on providing an excellent service to its customers. This conception places the customer at the top of the firm’s inverted organisational pyramid, and the function of the leader and the rest of the organisation is to serve the customer. Given the customer’s privileged position, Mercadona’s philosophy is to continually increase the ‘value for the customer’ by maintaining its ‘Always Low Prices’ policy and eliminating special offers, promotions and temporary discounts. But the philosophy
  • 146. not only focuses on prices. All the firm’s actions are oriented toward satisfying all the cus- tomer’s specifications, whether known or potential future expectations. In order to find these out, Mercadona maintains a constant and direct dialogue with its ‘bosses’, carrying out activities to collect information, opinions and needs from its customers: meetings with neighbours in neighbourhoods where new stores are being opened, monographic courses on product lines, open days, blind tests, a free customer service hotline and suggestion boxes in supermarkets. 2 These operations require considerable economic investment Figure 2. Mercadona’s TQM model. Source: authors, based on Mercadona Annual Reports.
  • 147. Figure 3. Orientation toward customer satisfaction in Mercadona. Source: authors. 1370 B.C. Miguel and G.B. Santiago D o w n l o a d e d B y : [ E f
  • 149. 9 : 1 4 9 M a r c h 2 0 1 1 from Mercadona, but the firm considers this form of contact more appropriate than big advertising campaigns in the media, which are extremely expensive and collect little infor-
  • 150. mation from customers. Mercadona learns directly about its customers’ tastes, the products habitual customers need and future trends in different lines of consumption. The firm then tries to anticipate their future needs through innovation, R&D and product-improvement programmes. 3 On the basis of the information collected and distributed, Mercadona carries out actions to increase value for customers. The aim is to give customers the chance to carry out all their shopping under the principles of ‘maximum quality, maximum range, maximum service, minimum cost and minimum time – always’. With regard to quality,
  • 151. the retailer stresses the nutritional quality of its more than 9000 products. 4 But quality also involves convenience, speed, comprehensiveness of service and product variety. Product variety – the maximum range – does not mean offering a large number of brands, but rather all the products that satisfy all the customer’s needs in food, hygiene, cleaning and pet food. Moreover, Mercadona aims to become a ‘prescriber’: choosing and recommending products for their quality and minimum price. Mercadona guarantees the life and name principles for those products, guaranteeing the origin and date of packa- ging of the products, as well as the same name on products of