The next "Wave" of buyers
•
0 gefällt mir•274 views

The next wave of buyers in the Phoenix metro area are currently renting single family homes.

Empfohlen
Weitere ähnliche Inhalte
Was ist angesagt?
Andere mochten auch
Andere mochten auch (20)
Ähnlich wie The next "Wave" of buyers
Kürzlich hochgeladen
Kürzlich hochgeladen (20)
The next "Wave" of buyers
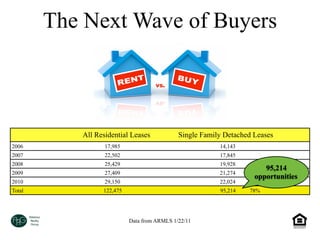
- 1. The Next Wave of Buyers All Residential Leases Single Family Detached Leases 2006 17,985 14,143 2007 22,502 17,845 2008 25,429 19,928 95,214 2009 27,409 21,274 opportunities 2010 29,150 22,024 Total 122,475 95,214 78% Data from ARMLS 1/22/11
- 2. Single Family Detached Residential Rentals 95,214 prospective buyers 30,000 2 year FHA waiting period to finance after Bankruptcy 3 year FHA waiting period to finance after Short Sale or Foreclosure 21,274 22,024 22,500 19,928 17,845 15,000 14,143 7,500 0 2006 2007 2008 2009 2010 2011 2012 Data from ARMLS 1/22/11
- 3. Leases by Property Type Category Inventory 12/10 December leases signed Estimated months supply Single family detached 4,527 2,295 2.0 Apartment style 1,486 268 4.6 Townhouse 1,129 258 3.6 Patio homes 232 48 4.8 Totals 7,374 2,869 2.5 Leases signed in Phoenix 2006 -2010 All Residential Leases Single Family Detached Leases 2006 17,985 14,143 2007 22,502 17,845 2008 25,429 19,928 95,214 2009 27,409 21,274 opportunities 2010 29,150 22,024 Total 122,475 95,214 78% Data from ARMLS
- 4. Number of properties that have gone through foreclosure or short sale process Greater Phoenix January 2010 - January 2011 Number of Transactions Transaction Type January 2010 - January 2011 Foreclosures/REO: some of these were investment properties and commercial properties, but the majority 31,052 49% were single family properties Third party purchases (non-REO) at trustee’s 21% 12,364 auction: property did not go back to the bank Short sales 17,149 30% Total 60,565 100% Data from NetvalueCentral.com and ARMLS 1/22/11
- 5. Maricopa County Rental Properties Total number of potential rental properties 369,782 Total number of potential single family rental properties 250,931 Data from ARMLS 1/22/11
- 6. N W E S 95,214 Single family renters 1/06-1/11 Data from ARMLS 1/22/11
- 7. 4,237 Single family rentals in direct vicinity of six SE Valley Meritage Communities (1/1/08 - 1/22/11 ARMLS) Warner Road Arizona Ave Power Road Riggs Road
- 8. Rent vs. Own Southeast Valley *4,237 Single family residential leases signed 1/08 - 1/11 Arizona Ave - Power Rd, Warner Rd - Riggs Rd # Of renters by range MLS listings by $ range **Monthly payment • $1,000-$1,250 - 2052 • $135K-$160K - 203 $1,100-$1,275 • $1,250-$1,500 - 1488 84% • $160K-$200K - 276 $1,250-$1,500 • $1,500-$1,750 - 439 • $200K-$250K - 224 $1,500-$1,750 • $1,750-$2,000 - 178 • $250K-$300K - 133 $1,750-$2,000 • $2,000-$2,500 - 70 • $300K-$325K - 44 $2,000-$2,200 • $2,500-$3,000 - 10 • $325K-$350K - 50 $2,200-$2,300 • Over $3,000 -0 • $350K-$375K - 22 $2,300-$2,500 * Information from Arizona Multiple Listing Service as of 1/22/11 ** PITI + HOA with FHA Loan, 3.5% down-payment, 30 yr fixed @ 5% APR
- 9. 545 Single family rentals within 5 mile radius of Cibola Vista Paying $1,750-$4,000/mo. rent (1/1/08 - 1/22/11 ARMLS) Lake Pleasant Vistancia New River Arrowhead Ranch
- 10. 170 Single family rentals within 2 mile radius of Verrado paying $1,500 - $3,500/mo. rent (1/1/08 - 1/22/11 ARMLS) Indian School Rd Raven Golf Club I-10
- 11. 127 Single family rentals paying $2,500-$6,000/mo. within 4 mile radius of Mirabel (1/1/08 - 1/22/11 ARMLS) Desert Mountain Black Mountain Mirabel The Boulders Legend Trail
- 12. 1,165 Single family rentals paying $800 - $1,500/mo. within 3 mile radius of Rancho El Dorado/Maricopa (1/1/08 - 1/22/11 ARMLS)
- 13. Top Ten Cities to Buy vs. Rent Trulia.com Rent vs. Buy Index Interpretation Key City Price-to-Rent Ratio 1 Minneapolis, Minnesota 1:8 2 Arlington, Texas 1:8 3 Miami, Florida 1:8 4 Fresno, California 1:8 5 San Antonio, Texas 1:8 6 Mesa, Arizona 1:9 7 Jacksonville, Florida 1:9 8 Phoenix, Arizona 1:10 9 El Paso, Texas 1:10 10 Las Vegas, Nevada 1:11 Price-to-Rent Ratio of 1:15 = It is much less expensive to own than to rent a home in this city Price-to-Rent Ratio of 16:20 = It is more expensive to own a home in this city. The total costs of home ownership in this city are greater than the costs of renting. Price-to-Rent Ratio of 21+ = The total costs of owning a home in this city are much greater than the costs of renting. On Trulia.com, the price-rent ratio is calculated comparing the average list price to the average rental cost of two-bedroom apartments, condos, and townhomes. To create this list, Trulia analyzed the largest 50 U.S. cities by population. Data from trulia.com
- 14. Wasted Money
- 16. They don’t build houses like they used to, they build them Better Advantages of purchasing a brand New Home 1. Brand new homes are one of the easiest ways for any home buyer to get on the property ladder and start generating substantial equity over the first few years. 2. New homes are safer than older homes! They feature better wiring systems and have to adhere to today's strict building codes and standards. 3. New homes are healthier because asbestos, lead and other hazardous materials have been eliminated from home building products. 4. New homes are much more energy efficient. Due to better windows, more efficient heating & cooling equipment, better control of air infiltration and greater use of new insulation technologies - new homes are TWICE as energy efficient as homes built prior to 1980! 5. New homes are less expensive to maintain than older homes. A new home can be operated for 20-30% less than a used home. 6. New homes often sell at higher resale values than older homes and carry better warranties. 7. A new home, in a new community allows you to make friends quickly - everyone in the neighborhood is new and that allows you to establish bonds and create long lasting friendships. 8. Pride in being the first owner of a new home - which is an expression of your style, lifestyle and opinions. 9. You don't have to worry about replacing old carpeting, counter tops, appliances or the roof! You get to choose exactly what you want and it's ready as soon as you move in! 10. Today's new homes are being wired to take full advantage of the latest communication, security, home office & entertainment technologies.
- 18. QUICK REFERENCE GUIDE FOR WAITING PERIODS TO FINANCE Waiting Periods to Finance Conventional FHA Deed-in-Lieu of Foreclosure 2 years - 80% Max LTV 3 years from completion Short Sale, Pre-Foreclosure 4 years - 90% Max LTV (no waiting for extenuating circumstances) 7 years from completion 3 years from completion Foreclosure Sale (3 years extenuating circumstances) (Short Sale w/90 day late considered foreclosure) 4 years from discharge Bankruptcy (except Chapter 13) 2 years from discharge (2 years extenuating circumstances) 2 years from discharge A minimum history of 1 year of on time Chapter 13 Bankruptcy 4 years from filing date payout period
- 19. Executive Summary The high number of properties exchanging ownership because of foreclosures or short sales has created a boom in the single family rental market. For the first six months of 2010, approximately 34,000 properties in greater Phoenix went back to the lender, were purchased by a third party at a trustee’s auction or sold through a short sale. The majority of these properties were single family detached homes. ARMLS reports that for the first six months of 2010, 14,142 residential leases were signed of which 10,736 were single family properties, representing 76% of the total. Most single family home owners who lose their home would prefer to continue living in a single family house rather than renting a patio home, townhouse or an apartment. As of January 22, 2011, single family detached rentals were at a two month supply. At the current demand for renting a single family home, 2010 most likely will be the record year this decade for the number of signed single family leases. Before a buyer may obtain a loan and purchase again there is a waiting period, depending on the loan type. Many single family renters will purchase again once they are through the required waiting period, have improved their credit, have obtained the funding for their down payment and are employed. This group represents a future home buying boom. Strategic Plan The Arizona Regional Multiple Listing Service enables subscribers to extract detailed property and contact information, price points, and contract terms of residential leases signed within specific geographic locations and time frames in the Phoenix area. Strategically locating, marketing, educating, and following up with these renters as they approach the termination of their lease and required waiting periods will enable sales agents to create action plans that identify more potential buyers in their direct market and sell more homes.
- 20. Prepared by James Adelman Designated Broker