Clustering and dendogram Clustering and dendogram Clustering and dendogram Clustering and dendogramClustering and dendogram Clustering and dendogramClustering and dendogram Clustering and dendogram Clustering and dendogram Clustering and dendogram Clustering and dendogram Clustering and dendogram Clustering and dendogram Clustering and dendogram Clustering and dendogram Clustering and dendogram Clustering and dendogram Clustering and dendogram Clustering and dendogram Clustering and dendogram Clustering and dendogram Clustering and dendogramClustering and dendogram Clustering and dendogramClustering and dendogram Clustering and dendogram Clustering and dendogram Clustering and dendogram Clustering and dendogram Clustering and dendogram Clustering and dendogram Clustering and dendogram Clustering and dendogram Clustering and dendogram Clustering and dendogram Clustering and dendogram Clustering and dendogram Clustering and dendogram Clustering and dendogram Clustering and dendogramClustering and dendogram Clustering and dendogramClustering and dendogram Clustering and dendogram Clustering and dendogram Clustering and dendogram Clustering and dendogram Clustering and dendogram Clustering and dendogram Clustering and dendogram Clustering and dendogram Clustering and dendogram Clustering and dendogram Clustering and dendogram Clustering and dendogram Clustering and dendogram Clustering and dendogram Clustering and dendogramClustering and dendogram Clustering and dendogramClustering and dendogram Clustering and dendogram Clustering and dendogram Clustering and dendogram Clustering and dendogram Clustering and dendogram Clustering and dendogram Clustering and dendogram Clustering and dendogram Clustering and dendogram Clustering and dendogram Clustering and dendogram Clustering and dendogram Clustering and dendogram Clustering and dendogram Clustering and dendogramClustering and dendogram Clustering and dendogramClustering and dendogram Clustering and dendogram Clustering and dendogram Clustering and dendogram Clustering and dendogram Clustering and dendogram Clustering and dendogram Clustering and dendogram Clustering and dendogram Clustering and dendogram Clustering and dendogram Clustering and dendogram Clustering and dendogram Clustering and dendogram Clustering and dendogram Clustering and dendogramClustering and dendogram Clustering and dendogramClustering and dendogram Clustering and dendogram Clustering and dendogram Clustering and dendogram Clustering and dendogram Clustering and dendogram Clustering and dendogram Clustering and dendogram Clustering and dendogram Clustering and dendogram Clustering and dendogram Clustering and dendogram Clustering and dendogram Clustering and dendogram Clustering and dendogram Clustering and dendogramClustering and dendogram Clustering and dendogramClustering and dendogram Clustering and dendogram Clustering and dendogram Clustering and dendogram Clustering and dendogram Clustering and dendogram Cluster
VIP Independent Call Girls in Bandra West 🌹 9920725232 ( Call Me ) Mumbai Esc...
Clustering-dendogram.pptx
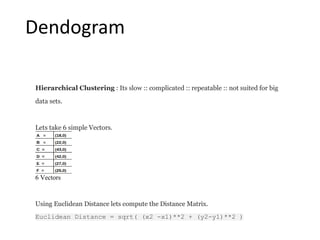
1. Dendogram
Hierarchical Clustering : Its slow :: complicated :: repeatable :: not suited for big
data sets.
Lets take 6 simple Vectors.
6 Vectors
Using Euclidean Distance lets compute the Distance Matrix.
Euclidean Distance = sqrt( (x2 -x1)**2 + (y2-y1)**2 )
2. Using Euclidean Distance lets compute the Distance Matrix.
Euclidean Distance = sqrt( (x2 -x1)**2 + (y2-y1)**2 )
Distance Matrix
Complete Link Clustering: Considers Max of all distances. Leads to many small
clusters.
Distance Matrix: Diagonals will be 0 and values will be symmetric.
Stage 0
3. Step a: The shortest distance in the matrix is 1 and the vectors associated with that
are C & D
So the first cluster is C — D
Distance between other vectors and CD
A to CD = max(A->C, A->D) = max(25,24) = 25
B to CD = max(B-<C, B->D) = max(21,20) = 21
and similarly find for E -> CD & F -> CD
Stage 1
4. Step b : Now 2 is the shortest distance and the vectors associated with that are E & F
Second cluster is E — F
A to EF = max(A->E, A->F) = max(9,7) = 9
CD to EF = max(CD->E, CD->F) = max(15,17) = 17
Step c : Now 4 is the shortest distance and vectors associated are A & B. Third cluster
is A — B
CD to AB = max(CD -> A, CD ->B) = max(25,21) = 25
EF to AB = max(EF -> A, EF ->B) = max(9,5) = 9
5. Step d : Now 9 is the shortest distance and vectors associated are AB and EF. Fourth
cluster is AB — EF
CD to ABEF = max(CD->AB, CD->EF) = max(25,18) = 25
Step e : Last cluster is CD — ABEF
6. Let’s take a sample of 5 students:
Creating a Proximity Matrix
First, we will create a proximity matrix which will tell us the distance between each of
these points. S
ince we are calculating the distance of each point from each of the
other points, we will get a square matrix of shape n X n (where n is the number of
observations).
Let’s make the 5 x 5 proximity matrix for our example:
7. Step 1: First, we assign all the points to an individual cluster:
Different colors here represent different clusters. You can see that we have 5
different clusters for the 5 points in our data.
Step 2: Next, we will look at the smallest distance in the proximity matrix and merge
the points with the smallest distance. We then update the proximity matrix:
Here, the smallest distance is 3 and hence we will merge point 1 and 2:
8. Let’s look at the updated clusters and accordingly update the proximity matrix:
Here, we have taken the maximum of the two marks (7, 10) to replace the marks for
this cluster. Instead of the maximum, we can also take the minimum value or the
average values as well. Now, we will again calculate the proximity matrix for these
clusters:
9. Step 3: We will repeat step 2 until only a single cluster is left.
So, we will first look at the minimum distance in the proximity matrix and then merge
the closest pair of clusters. We will get the merged clusters as shown below after
repeating these steps:
10. How should we Choose the Number of Clusters in Hierarchical Clustering?
Let’s get back to our teacher-student example. Whenever we merge two clusters, a
dendrogram will record the distance between these clusters and represent it in graph
form. Let’s see how a dendrogram looks like:
We have the samples of the dataset on the x-axis and the distance on the y-
axis. Whenever two clusters are merged, we will join them in this dendrogram and
the height of the join will be the distance between these points.
11. Let’s build the dendrogram for our example:
Take a moment to process the above image. We started by merging sample 1 and 2
and the distance between these two samples was 3 (refer to the first proximity matrix
in the previous section).
12. Let’s plot this in the dendrogram:
Here, we can see that we have merged sample 1 and 2. The vertical line represents
the distance between these samples. S
imilarly, we plot all the steps where we merged
the clusters and finally, we get a dendrogram like this:
13. Now, we can set a threshold distance and draw a horizontal line (Generally, we try to
set the threshold in such a way that it cuts the tallest vertical line). Let’s set this threshold
as 12 and draw a horizontal line:
The number of clusters will be the number of vertical lines which are being
intersected by the line drawn using the threshold. In the above example, since the
red line intersects 2 vertical lines, we will have 2 clusters. One cluster will have a
sample (1,2,4) and the other will have a sample (3,5).