

Empfohlen
Empfohlen
Weitere ähnliche Inhalte
Was ist angesagt?
Was ist angesagt? (20)
Ähnlich wie Tax cronyism
Ähnlich wie Tax cronyism (20)
Mehr von ALEC
Mehr von ALEC (11)
Kürzlich hochgeladen
Kürzlich hochgeladen (20)
Tax cronyism
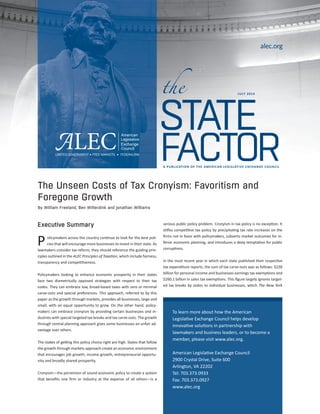
- 1. the alec.org STATE JULY 2014 FACTOR A PUBLICATION OF THE AMERICAN LEGISLATIVE EXCHANGE COUNCIL The Unseen Costs of Tax Cronyism: Favoritism and Foregone Growth By William Freeland, Ben Wilterdink and Jonathan Williams Executive Summary olicymakers across the country continue to look for the best poli-cies that will encourage more businesses to invest in their state. As lawmakers consider tax reform, they should reference the guiding prin-ciples outlined in the ALEC Principles of Taxation, which include fairness, transparency and competitiveness. Policymakers looking to enhance economic prosperity in their states face two diametrically opposed strategies with respect to their tax codes. They can embrace low, broad-based taxes with zero or minimal carve-outs and special preferences. This approach, referred to by this paper as growth through markets, provides all businesses, large and small, with an equal opportunity to grow. On the other hand, policy-makers can embrace cronyism by providing certain businesses and in-dustries with special targeted tax breaks and tax carve-outs. The growth through central planning approach gives some businesses an unfair ad-vantage over others. The stakes of getting this policy choice right are high. States that follow the growth through markets approach create an economic environment that encourages job growth, income growth, entrepreneurial opportu-nity and broadly shared prosperity. Cronyism—the perversion of sound economic policy to create a system that benefits one firm or industry at the expense of all others—is a serious public policy problem. Cronyism in tax policy is no exception. It stifles competitive tax policy by precipitating tax rate increases on the firms not in favor with policymakers, subverts market outcomes for in-ferior economic planning, and introduces a deep temptation for public corruptions. In the most recent year in which each state published their respective tax expenditure reports, the sum of tax carve-outs was as follows: $228 billion for personal income and business earnings tax exemptions and $260.1 billion in sales tax exemptions. This figure largely ignores target-ed tax breaks by states to individual businesses, which The New York To learn more about how the American Legislative Exchange Council helps develop innovative solutions in partnership with lawmakers and business leaders, or to become a member, please visit www.alec.org. American Legislative Exchange Council 2900 Crystal Drive, Suite 600 Arlington, VA 22202 Tel: 703.373.0933 Fax: 703.373.0927 www.alec.org P
- 2. THE STATE FACTOR Times reports total 157,072 specific grants to firms over the past two decades. Crucial to policymakers’ efforts to rout out cronyism in the tax code is understanding what it is, what it is not, why it is unsound policy, why it should be abolished and incremental steps to ending it in state gov-ernment. After cataloguing the nature of cronyism and establishing its pervasive problems, this report suggests the following: 1. Eliminate tax cronyism in a revenue-neutral fashion, or as part of broader tax cuts. Attempting to close off these tax carve-outs without decreasing tax rates elsewhere can be a devastating blow to firms and does little to improve a state’s competitiveness. 2. If tax cronyism is not completely eliminated, remove cronyism from the tax code and put it on the budgetary side of the fiscal ledger—make the program budget-based, cash payouts instead of elements of the tax code that reduce a firm’s tax burden. This increases revenue certainty and budgetary transparency. 3. Subject existing tax cronyism to rigorous reporting standards to ensure transparency, and conduct a critical analysis of whether these measures are creating tangible economic growth over and above their true economic cost. Routing out cronyism is essential to ensure that economic growth is maximized and government truly operates with the public’s trust. Every state has these types of carve-outs in their tax codes to some degree, meaning that every state economy is held back, at least to some extent, from achieving their true potential for economic growth. This guide for policymakers describes a path to a tax code that provides equal oppor-tunity for all and unleashes economic development based on powerful market mechanisms, not inferior centralized economic planning. Defining Tax Cronyism Cronyism refers to the use of public policy to benefit a specific industry, firm, or individual, as opposed to setting broad and generally applicable rules and policies that apply to society as a whole.1 It is rooted in the belief that reliance on government planning to direct economic activity will result in greater economic prosperity than free markets can achieve on their own. As economist David Henderson, editor of the Encyclope-dia of Economics, defines it:2 Cronyism is the substitution of political influence for free markets. It comes about when government has a lot of power over pri-vate- sector decisions and when the government officials in power have great discretion over how to use it. It is worth noting that the practice of businesses utilizing existing tax carve-outs to reduce their tax burden is not tax evasion. Though some high tax proponents like to use the term “tax avoidance” to suggest mal-feasance on the part of companies using tax preferences for which they qualify, the charge is wholly disingenuous. These carve-outs are dem-ocratically passed by lawmakers with the explicit purpose of lowering the tax burden for select firms or industries. Fundamentally, lawmak-ers have the power to pass or repeal these provisions. Although firms 2 • AMERICAN LEGISLATIVE EXCHANGE COUNCIL actively lobbying for these carve-outs (as opposed to passively qualify-ing for them) introduces a different moral calculus, businesses should generally not be vilified or blamed for tax cronyism. The key issue rests with the policymakers who introduce these laws. Moreover, general, across-the-board tax cuts done through corporate and personal income tax rate reductions certainly do not qualify as cro-nyism. General cuts do not favor a specific firm or industry and conform to the general principle of sound tax policy, which holds that the means of raising government revenue should not tax the returns of productive labor in any form—wages, investment returns and business profits.3 This is because taxing productive activity lowers the real return of the productive behavior and therefore results in less productive behavior being undertaken by society. Types of tax policy cronyism may include: 1. Targeted tax breaks or cash subsidies for specific firms granted by so-called “economic development” agencies. 2. Preferential tax treatment for firms located in a given geographic area and meeting numerous other qualifications. 3. Punitively high or special taxes on some firms or industries that competitively disadvantage them relative to other firms or indus-tries. 4. Tax carve-outs that benefit certain industries or groups relative to the rest of the tax base. Routing out cronyism is essential to ensure that economic growth is maximized and government truly operates with the public’s trust. Although the specific nature and extent of tax cronyism varies from state to state, it is a feature of all 50 states’ tax codes. Similarly, elements of tax cronyism are generally supported by politicians on both the left and the right, though the specific policies tend to differ. Conversely, there are political reformers on both the left and right who decry the specter of tax cronyism and call for a policy of tax neutrality. Much of the debate about tax cronyism surrounds a central disagree-ment about the nature of economic development and the facilitation of economic growth. The camps can be described as follows: Growth Through Central Planning: Those in this camp believe that tax competitiveness is less about having generally low tax rates across the board, and is instead about policies that attract and assist key industries and large firms. The hope is that many businesses and industries will continue to operate in a given state despite an uncompetitive tax struc-ture due to a mixture of factors not related to tax policy. Meanwhile, a
- 3. THE UNSEEN COSTS OF TAX CRONYISM: FAVORITISM AND FOREGONE GROWTH THE STATE FACTOR • 3 few select firms and industries not currently residing in the state will choose to relocate to the state if incentivized to do so. Members of this camp believe prudent, central government planning can maximize the revenue collected from firms currently residing in the state while com-peting for new firms considering relocation or expansion. Growth Through Markets: This camp holds that choosing to introduce tax policies that are favorable to a few large firms, rather than imple-menting competitive tax policy for all firms—whether currently existing or soon to be started by entrepreneurs—hurts a state’s growth poten-tial. Government does not know which firms will provide innovation, employment growth, wage growth and tax revenue growth for the state. Empowering government to cater to a few high-profile firms while not fixing underlying problems in the tax code is poor policy, as policy-makers and bureaucrats are unlikely to outperform diversified market performance relative to their narrow picks. The merits of these two models will be discussed with great depth later in this paper. But it is important to acknowledge in the context of defin-ing and cataloguing tax cronyism that the definition tends to be subject to a disagreement about what the role of tax policy is. To the extent an individual believes a tax provision has some sort of legitimate goal, he or she is less likely to dismiss it as cronyism. That said, as a first approxima-tion, it is fair to consider cronyism any policy that deviates from broad, neutral tax bases. Exceptions to Tax Cronyism Stepping beyond the general definition, there are discrepancies in what many choose to categorize as cronyism. Cronyist carve-outs are often compared against a broad, neutral and economically sound base from a public finance perspective. However, tax measures that attempt to achieve the proper tax base are in no sense cronyist. Additionally, tax measures that seek to advance anti-poverty policy in a neutral fashion likely should also be excluded from cronyist consideration. Business and Investment: Getting the Tax Base Right Business-to-business transactions are one glaring example of so-called tax carve-outs that emphatically do not fit the definition. States that utilize the sales tax vary in the degree to which they exempt busi-ness- to-business transactions. As the Council on State Taxation (COST) has noted, taxing business-to-business transactions leads to distortion-ary “tax pyramiding,” where value is taxed multiple times along the pro-duction chain, which increases the effective rate of taxation unevenly on final goods.4 First, this is problematic because as COST notes, “A sales tax on business inputs is an additional cost of doing business in the state, which companies must either attempt to pass on to their cus-tomers or reduce their economic activity in the state.” Second, because the tax compounds on itself as it moves through additional stages of production, it distorts economic activity and disadvantages firms down the production chain, as well as products with many stages of produc-tion and inputs. As such, exempting business-to-business transaction is not cronyism but simply an economically appropriate way to establish a tax base. There is a narrow category of business exemptions that should also be excluded from the category of tax cronyism beyond business-to-busi-ness transactions. Research and development, accelerated depreci-ation, and full expensing of business capital investment, for example, are tax exemptions that allow businesses to deduct legitimate business expenses from their taxable earnings. Moreover, though they do tend to benefit companies that more heavily engage in research and develop-ment or capital investment, the idea is to incentivize all firms to invest more robustly in expansion. These policies are equally available to all firms that choose to invest. They essentially do not discriminate against firms or industries, and instead advance the broad and neutral goal of enhanced economic growth and innovation through research and devel-opment and capital investment of any form by enterprising firms. Most notably, they largely cannot be considered a form of economic planning. Along these same lines, although the so-called “preferential” rate on investment income (capital gains, interest income and dividends) is sometimes considered a tax carve-out, it should be excluded from this category. As with research and development, accelerated depreciation, and full expensing of business capital, the lower rate on investment income is available for all taxpayers and exists for the legitimate pur-pose of incentivizing increased investment. This investment has massive dividends to all of society in terms of innovation, business hiring and wage growth. Moreover, much of the investment income generated by corporate entities for their equity holders has already been taxed under business income taxes. As such, the lower rate on capitol income serves to correct this double taxation. Anti-Poverty Programs Some exemptions that assist low-income individuals are difficult to label as cronyism. The earned income tax credit and child tax credit are two key examples. Both of these credits do not clearly benefit any firm or industry relative to the rest of the tax base. They do, indeed, narrow the base and benefit a specific class of individuals, but they are clear-ly a matter of social assistance and have no particular exigent policy objective such as economic growth, promoting alternative energy, or advancing home ownership. It is true that there is disagreement among economists—particularly those with a strong free-market, limited-gov-ernment orientation—on the prudence of these credits relative to direct cash assistance or greater reliance on private charity for social assistance. These benefits, like most policy objectives, are best tackled through the spending side of the fiscal ledger, not the tax code. But giv-en that they don’t fit the mold of cronyism, they will be set aside for the purpose of this paper.
- 4. THE STATE FACTOR Charitable income tax deductions and charitable entities’ tax-free sta-tuses, rightly constructed, belong in the same category as the earned income tax credit. Structure is the key issue in deciding whether a particular charitable deduction or tax-free charitable status is cronyist. Properly structuring charitable status means avoiding granting tax ex-emptions to organizations and the entities’ funders if the organization is for all intents and purposes a business and in competition with for-profit entities in the marketplace.5 Instead, these organizations must have a strictly charitable purpose. Given this proper structure, these tax ex-emptions also fall into the category of social assistance and therefore are largely not cronyism. Any taxpayer, regardless of status, can take advantage of the credit as it suits his or her financial situation. Similarly, any truly charitable entity can qualify to benefit and can enhance social well-being broadly without falling under the cronyist label. Last, like the earned income tax credit, some can take issue with whether the credit is the optimum means of achieving a given social policy, but it also is true that it is largely not cronyism if properly implemented. Not all exemptions from the tax base designed to help low-income citi-zens deserve exception from the cronyist label. Exclusions of goods and services that are not business inputs largely provide unjust enrichment to specific industries, distort consumer behavior by changing after-tax price differences between consumer purchases taxed differently, and often arbitrarily bias the prospect of business success between firms and industries that largely provide the same final consumer value. Al-though these exemptions are often justified as helping low-income indi-viduals, better policies such as direct cash assistance, the earned income tax credit and keeping taxes low generally can better assist low-income individuals without creating economic distortions or picking “winner” industries or firms. Given these sales tax exemptions favor specific prod-ucts, firms and industries relative to the rest of the tax base, they are appropriately considered cronyist tax policy. With these few exceptions established, it should be noted that the ex-ceptions largely make the rule. Nearly every exemption in the code that does not narrowly seek to construct the appropriate tax base from a neutral perspective should rightly be considered cronyism. This includes numerous popular deductions and metaphorical “sacred cows.” As a general rule, if paying a tax entails more than providing an income or profit figure, property value or cost of goods purchased, that tax likely involves cronyist tax carve-outs. Tax Cronyism in America: The Figures Given the broad and unwieldy nature of tax cronyism in America, it is difficult to settle on a specific figure or even determine a relative esti-mate for how much in cronyist tax carve-outs are realized each year in each state. This issue is further compounded by poor reporting of tax carve-outs and a general lack of transparency regarding tax cronyism. On the federal level, exemptions in the personal and corporate income tax code are meticulously scored and recorded annually by the Joint Committee on Taxation (JCT). The JCT goes through the totality of the corporate and personal income tax codes, acknowledges all “tax expen-ditures” (the economic term for carve-outs in a taxes base) relative to 4 • AMERICAN LEGISLATIVE EXCHANGE COUNCIL the base and provides a line item score for each item it defines as a carve-out. This includes items that are not often considered tax carve-outs but certainly should register as such (the exemption for employers providing health care benefits, for example), and carve-outs that are perhaps not true exemptions (the “preferential” rate on investment income, for example). In addition to the individual line item costs, the totality of tax carve-outs in both the personal and corporate income tax code is totaled in static format. Ideally, these figures would be calcu-lated dynamically because these credits have interactions between the related taxpayer qualification for credits and behavioral effects, thus it is not strictly correct to sum the individual line items. But, given that figures for aggregate estimates of tax carve-outs accounting for dynamic effects are not provided, static figures—which serve as estimates only— are the most useful data available. In the 2014 Fiscal Year, the sum of Treasury Department estimates for corporate and personal income tax carve-outs is $158 billion and $1.146 trillion, respectively.6 Unfortunately, the 50 states’ reporting on these tax expenditures in the personal and corporate income tax, along with the sales tax or other state taxes, often does not come close to the reporting of the JCT at the federal level. The reports vary widely regarding which taxes the state uses to calculate carve-outs, what credits are excluded (and their cri-teria for exclusion), how often the reports are issued and whether they are even issued at all. A diverse array of policy organizations have be-moaned the poor reporting and the general lack of transparency, includ-ing the American Legislative Exchange Council (ALEC), the Tax Founda-tion, the Cato Institute, the Center for Budget and Policy Priorities and the Institute for Taxation and Economic Policy.7 As such, it is tough to get a solid figure from most states, let alone a total figure for all the states. Figure 1 (see pages 6-9) attempts to look at the most recent year of tax expenditures in all 50 states. It is worth noting that these figures are not strictly comparable between states. Some states exclude many tax-es from analysis entirely. States have different types of carve-outs that they include and exclude—for example, Arizona includes a credit valued at $703.00, whereas California excludes reporting on all credits valued at less than $5 million. Some states’ tax expenditures are on fiscal year calendars and some are on standard calendar years. The most recent year available differs widely, and some states have no recent reports at all, or worse still, have never issued a report. Figure 2 details those states with irregular or severely incomplete reporting. Figure 2: States with the Worst Reporting on Tax Carve-Outs No Report Infrequent or Incomplete Alabama Arkansas Alaska Hawaii Nevada Iowa South Dakota Missouri Wyoming North Dakota South Carolina Utah Virginia Source: ALEC research based on available tax expenditure reports
- 5. THE UNSEEN COSTS OF TAX CRONYISM: FAVORITISM AND FOREGONE GROWTH Figure 3: The New York Times Analysis of Targeted Business Incentives THE STATE FACTOR • 5 Therefore, these numbers are baselines for the purpose of considering the extent of carve-outs in the respective states’ tax codes. They are limited to the quality of state reporting, which is frequently poor. They should be considered as figures for one year, not comparable to other states, and with all appropriate context and caveats. That said, the most recent year of data provides a relative baseline of what states pay in carve-outs. This paper attempts to offer as much information and ap-propriate caveats as possible to provide analysis and details of states’ reporting standards. This includes what taxes are not included in the analysis, the criteria for not reporting a specific exemption, whether the exemption of services from the sales tax base is included and whether federal tax conformity is included. Federal tax conformity is the cost of tax expenditures created by the federal government for federal corpo-rate and personal income taxes with which states choose to conform their own tax codes. Property tax exemptions are not included because they are inconsistently treated as state or local taxes. This data can be seen in Figure 1. There are a few caveats related to Figure 1. For all figures that include the expenditure total as a percent of total state expenditures, the tax expenditure year is matched to the appropriate fiscal year. If the ex-penditure report is a calendar year and revenue is based on the fiscal year, the average of the two revenue reports that the expenditure re-port overlaps is taken. Most importantly, as noted above regarding the federal report, aggregating credits in static fashion without accounting for interactions in dynamic form is not accurate, so these figures are estimates. This paper does not attempt to exclude the tax exemptions argued in the previous section are not true tax carve-outs, or make any other adjustments. Instead, the analysis simply totals the results of each state’s own self-reporting, without alteration due to incomplete and in-consistent reporting. Please review Figure 1 table notes for additional context and explanations. Summing the extent of tax expenditures in each state in the most recent year the state reported those expenditures yields the following totals: $228 billion for personal income and business earnings tax exemptions and $260.1 billion in sales tax exemptions. These figures are subject to the previously mentioned reporting shortcomings. Figure 1 also details whether the state documents the policy rationale for various tax carve-outs and whether the state conducts a perfor-mance review. An additional transparency issue from which tax carve-outs suffer is the lack of performance reporting. Tax carve-outs often have no clearly stated goal. For those that do have a goal, the goal is not associated with clear metrics to evaluate how well the credit accom-plishes that goal, nor do states engage in regular analysis to determine how well carve-outs are accomplishing their stated goals. Moreover, even when analysis is conducted, it often suffers from numerous flaws of economic analysis. This paper was therefore unable to chronicle performance of tax carve-outs by state as part of its analysis. The Pew Center on the States has a seminal report on the topic, titled “Evidence Counts,” that chronicles the specific issues and shortcomings across the states with painstaking detail.8 States # of Grants to Companies Alabama 1,732 Alaska 50 Arizona 2,430 Arkansas 489 California 2,696 Colorado 324 Connecticut 293 Delaware 681 D.C. 44 Florida 1,804 Georgia 261 Hawaii 416 Idaho 253 Illinois 1,941 Indiana 1,339 Iowa 2,132 Kansas 808 Kentucky 3,196 Louisiana 2,930 Maine 4,840 Maryland 260 Massachusetts 1,479 Michigan 11,747 Minnesota 1,032 Mississippi 1,202 Missouri 2,552 Montana 60 Nebraska 590 Nevada 457 New Hampshire 400 New Jersey 7,335 New Mexico 183 New York 52,132 North Carolina 1,760 North Dakota 619 Ohio 3,321 Oklahoma 6,933 Oregon 10,027 Pennsylvania 5,506 Rhode Island 597 South Carolina 255 South Dakota 195 Tennessee 143 Texas 2,649 Utah 3,504 Vermont 601 Virginia 1,126 Washington 10,528 West Virginia 308 Wisconsin 903 Wyoming 9 Source: The New York Times
- 6. THE STATE FACTOR Figure 1: Total State Tax Expenditures in Most Recent Available Year State Year of Most Individual Income Tax Recent Report Expenditures New Hampshire CY 2013 No Income Tax N/A $28,821,000 0.58% New Jersey FY 2014 $5,941,800,000 11.41% $5,135,500,000 9.86% New Mexico FY 2012 and CY 2012* $705,695,900 4.98%‡ New York FY 2010 $21,668,400,000 16.81% $2,315,000,000 1.80% North Carolina FY 2015 $2,328,400,000 4.53% $872,800,000 1.70% North Dakota CY 2012 Not Reported N/A Not Reported N/A Ohio FY 2013 $1,894,700,000 3.25% $416,900,000 0.72% 6 • AMERICAN LEGISLATIVE EXCHANGE COUNCIL Individual Income Tax Expenditures as a % of Budget Corporate, Gross Receipts and Franchise Tax Expenditures Corporate Earnings Tax Expenditures as a % of Budget Alabama No Report Alaska No Report Arizona FY 2013 $255,280,000 0.87% $12,222,189,124 41.72% Arkansas CY 2012 $79,365,533 0.38%‡ California FY 2014 $34,717,000,000 15.23% $5,753,000,000 2.52% Colorado CY 2011 $684,126,000 2.29%‡ Connecticut FY 2013 $409,800,000 1.46% $313,000,000 1.11% Delaware FY 2013 $120,200,000 1.31% $5,220,000 0.06% Washington, D.C. FY 2012 $840,319,000 8.75%‡ Florida FY 2014 No Income Tax N/A $1,565,500,000 2.24% Georgia FY 2014 $8,274,000,000 20.14% $458,000,000 1.12% Hawaii CY 2011 $184,900,000 1.63% $101,100,000 0.89% Idaho FY 2015 $398,194,000 5.50%‡ Illinois FY 2013 $4,354,000,000 6.55% $518,823,000 0.78% Indiana FY 2009 $19,384,906,976 75.37%‡ Iowa FY 2010 Not Reported N/A $255,000,000 1.45% Kansas CY 2012 $1,729,383,826 12.01% Kentucky FY 2014 $3,374,300,000 13.14% $417,100,000 1.62% Louisiana FY 2013 $1,961,388,192 6.61% $1,841,371,401 6.21% Maine FY 2013 $1,178,634,662 15.11%‡ Maryland FY 2014 $1,944,900,000.00 5.26% $227,400,000 0.62% Massachusetts FY 2013 $13,877,200,000 23.01% $2,734,700,000 4.54% Michigan FY 2014 $7,814,300,000 16.03% $911,000,000 1.87% Minnesota FY 2014 $5,569,700,000 15.57% $770,100,000 2.15% Mississippi FY 2013 $1,197,978,000 6.17% $103,902,000 0.54% Missouri FY 2011 $6,599,100,000 28.57% $1,081,900,000 4.68% Montana FY 2010 $619,958,000.00 10.25% $25,260,098 0.42% Nebraska CY 2012 $1,640,232,000 16.61%‡ Nevada No Report
- 7. THE UNSEEN COSTS OF TAX CRONYISM: FAVORITISM AND FOREGONE GROWTH THE STATE FACTOR • 7 Sales Tax Expenditures Sales Tax Expenditures as a % of Budget Sales Tax Service Exemptions? Federal Tax Conformity? Exclusion Rule Policy Rationale? Performance Evaluation? $12,107,810,000 41.33% Yes No No notable exclusions No No Not Reported N/A No No Credits only. No deductions, exclusions and exemptions No No $11,887,000,000 5.22% No Yes Expenditures less than $5 million No No $1,514,810,000 5.08% No No No notable exclusions No No $3,710,900,000 13.19% Yes Yes No notable exclusions Yes No No Sales Tax N/A N/A No No notable exclusions Yes No $741,096,000 7.72% Yes Yes Expenditures less than $50,000 Yes Yes $12,089,000,000 17.28% Yes No No notable exclusions No No $6,609,000,000 16.09% Yes Yes No notable exclusions No No Not Reported N/A No No Credits only. No deductions, exclusions and exemptions No No $2,098,982,000 28.98% Yes No No notable exclusions No No $3,502,000,000 5.27% No No Expenditures less than $1 million No No Not Reported N/A No No No notable exclusions No No $6,376,227,000 36.15% Yes No Expenditures less than $1 million Yes Yes $5,701,237,181 39.59% Yes Partial No notable exclusions No No $4,982,772,000 19.41% Yes No No notable exclusions Yes No $2,663,450,562 8.98% Yes Yes Expenditures less than unspecified threshold Yes No $1,847,112,454 23.69% Yes Partial No notable exclusions Yes No $2,098,300,000 5.68% Yes No No notable exclusions No No $36,951,900,000 61.28% Yes No Major tax categories (property, excise, fuel and others) No No $26,038,396,000 53.41% Yes Yes No notable exclusions No No $5,851,500,000 16.36% Yes Yes Taxes subject to alternative tax and expenditures less than $50,000 No No $1,235,270,839 6.36% Yes Yes No notable exclusions No No $2,880,500,000 12.47% Partial Yes Major components of sales tax No No No Sales Tax N/A N/A No No notable exclusions Yes No $4,061,561,000 41.12% No No No notable exclusions Yes Yes No Sales Tax N/A N/A No Major tax categories (property, excise, interest on dividends and others) No No $9,669,100,000 18.56% No Yes No notable exclusions Yes No No Sales Tax N/A N/A No Expenditures that were "too difficult" to calculate Yes Yes $10,487,000,000 8.13% No Yes Expenditures less than $100,000 No No $3,378,600,000 6.57% No Yes Expenditures less than $100,000 No No $714,685,500 11.95% Yes No Estimates for sales tax expendi-tures less than $5,000 No No $4,852,300,000 8.33% No Yes Expenditures less than $1 million, expenditures derived from state constitutions and expenditures related to taxes with an alternative tax No No
- 8. THE STATE FACTOR State Year of Most Recent Report Individual Income Tax Expenditures 8 • AMERICAN LEGISLATIVE EXCHANGE COUNCIL Individual Income Tax Expenditures as a % of Budget Corporate, Gross Receipts and Franchise Tax Expenditures Corporate Earnings Tax Expenditures as a % of Budget Oklahoma FY 2012 $1,565,141,000 6.93%‡ Oregon FY 2014 and FY 2015 $5,931,000,000 22.98% $317,500,000 1.23% Pennsylvania FY2014 $8,736,800,000 12.87% $2,601,700,000 3.83% Rhode Island CY 2010 $530,507,799 6.78% $105,419,611 1.35% South Carolina FY 2013 Not Reported N/A Not Reported N/A South Dakota No Report Tennessee FY 2013 No Income Tax N/A $236,000,000 0.75% Texas FY 2013 No Income Tax N/A $1,475,600,000 1.52% Utah FY 2013 Not Reported N/A Not Reported N/A Vermont FY 2011 $308,933,060 6.36% $5,540,000 0.11% Virginia FY 2009 $791,600,000 2.14%‡ Washington FY 2012 & FY 2013 No Income Tax N/A $3,940,908,000 11.57% West Virginia FY 2013 & FY 2011* $2,955,800,000 13.94% $4,211,838,000 19.87% Wisconsin FY 2012 $6,065,590,000 14.68% $378,394,000 0.92% Wyoming No Report Source: ALEC analysis of state tax expenditure reports. All budget data comes from the National Association of State Budget Officers. All tax expenditure data comes from the most recently published state tax expenditure reports. Reports utilizing fiscal years are denoted with "FY" while calendar years are denoted as "CY." For reports that are published only once every two years with combined biennium totals, both years are noted. For those biennium reports, the average of those two years are taken to create a single year total. ‡ For states that do not differentiate their reporting on personal and corporate tax exemptions, their totals and percentages are combined. This can be noted by those category's respective cells being merged. Exclusion rules are developed using the state tax expenditure report's own written criteria, ALEC analysis of those reports and a previous study conducted by the Center for Budget and Policy Priorities on state tax expenditure reports ("Promoting State Budget Accountability Through Tax Expenditure Reporting.") For exclusion of major taxes (i.e. personal income, corporate income or sales), exclusion of services from sales tax exemption calculations or exemption of federal tax conformity, review those respective columns. *West Virginia's state tax expenditure data timeline differs based on the type of tax expenditures considered. Sales tax data reflects fiscal year 2013. Income tax data reflects fiscal year 2011. New Mexico's reporting of credits vary between fiscal 2012 and calendar year 2012, depending on the tax expenditure considered. **Virginia only provides policy rationales for sales tax exemptions. Although the numbers in Figure 1 look at general tax exemptions, states also give firms targeted tax carve-outs that are generally not included in tax expenditure reports. The New York Times has reported on the number of targeted incentives to companies states have provided in recent years in their “United States of Subsidies” data tool, which can be seen in Figure 3.9 Some of these are tax benefits and some are cash subsidies. Due to the various state reporting standards, these figures do not reflect identical time periods. Their state specific results total to 157,072 specific reported grants to firms. What’s Wrong with Carve-Outs in the Tax Code? Much like how people report they have an unfavorable view of Congress but view their own congressman favorably, people often speak against specialized tax carve-outs in general, but view one or a few in particu-lar as having some special and invaluable purpose. One problem is that often these carve-outs are couched in terms of “investment,” “targeted incentive for growth” or “economic development”—terms designed to solicit public support. However, on critical analysis, these carve-outs of-ten fail to achieve their stated policy objectives. More Carve-Outs Means High Taxes The broadest sensible tax bases and lowest possible rates are the ba-sic tenants of sound tax policy. This approach especially emphasizes revenue stability, predictability, fairness and the need to minimize the economic drag of taxes on the economy by ensuring that the tax base is as broad as reasonable. Since it is true that taxes are necessary for funding core functions of government and that taxes are a net drag on the economy by taking capital out of the productive market, the solu-
- 9. THE UNSEEN COSTS OF TAX CRONYISM: FAVORITISM AND FOREGONE GROWTH An effective tax system should be broad-based, utilize a low overall tax rate with few loopholes and avoid multiple layers of taxation through tax pyramiding. THE STATE FACTOR • 9 Sales Tax Expenditures Sales Tax Expenditures as a % of Budget Sales Tax Service Exemptions? Federal Tax Conformity? Exclusion Rule Policy Rationale? Performance Evaluation? $6,726,301,805 29.76% No No Expenditures less than $25,000 without "high accuracy" estimates and expenditures with under 5 occurrences No No No Sales Tax N/A N/A Yes Expenditures less than $100,000 Yes Yes $8,090,900,000 11.92% Yes No Expenditures less than $100,000 Yes No $1,032,449,500 13.19% No Yes Expenditures with "no reliable data" No No $3,052,364,706 13.69% No No No notable exclusions No No $6,557,800,000 20.85% Yes No No notable exclusions No No $35,985,000,000 37.13% Yes Yes Expenditures less than unspecified threshold No Yes $666,947,978 5.29% Yes No Expenditures for which data is "not available" No No $560,100,000 11.52% No Yes Expenditures for which data is "not available" No No $377,500,000 1.02% No No Major tax categories (property, excise, interest on dividends and others) Yes** No $7,761,006,500 22.78% Yes N/A Expenditures that exist in order to prevent double counting Yes No $1,933,490,000 9.12% Yes Yes Expenditures less than unspecified threshold Yes No $3,278,371,000 7.93% No Yes Expenditures less than unspecified threshold No No tion is to develop a tax policy that is as least intrusive, burdensome and distortionary as possible. Tax carve-outs for specific industries or busi-nesses are opposite to these goals and some of the most basic maxims of sound tax policy. The ALEC Principles of Taxation, adopted with input from legislators, members of the private sector and public policy experts from around the country, outline seven guiding principles of sound taxation, includ-ing that specialized carve-outs in the tax code violate the principle of economic neutrality. This principle states that: The purpose of the tax system is to raise needed revenue for core functions of government, not control the lives of citizens or micro-manage the economy. The tax system should exert minimal impact on the spending and decisions of individuals and businesses. An ef-fective tax system should be broad-based, utilize a low overall tax rate with few loopholes and avoid multiple layers of taxation through tax pyramiding.10 By setting a general tax rate and then immediately exempting or giving preferential treatment to certain businesses or industries, the tax base for the general tax rate becomes smaller. With a smaller revenue base, states must continually raise tax rates to get the desired amount of reve-nue. The result is increasing tax rates on a shrinking tax base. In practical terms, this means that businesses or industries that are not the favored few end up paying more taxes so that other businesses or industries can enjoy a lower tax bill. The types of businesses and industries that have the political clout, con-nections and lobbying resources to secure these preferential tax deals are generally very large firms. Meanwhile, individuals and smaller busi-nesses— those not favored by policymakers—cannot afford such gen-erous deals. Case Study: Boeing A notorious example of this occurred when the state of Washington of-fered Boeing, a multinational company that reported almost $87 billion worth of sales in 2013, about $8.7 billion worth of tax and other specific benefits to build a new line of aircraft wings in the state.11 These benefits
- 10. THE STATE FACTOR took the form of an aeronautics industry tax credit that was designed specifically with Boeing in mind. This tax benefits package included tax-es of all sorts, one of which was Washington’s Business and Occupation Tax (B & O Tax). This is a type of gross receipts tax, which means that the tax is levied on a company’s gross revenue rather than net revenue (profit) on which a traditional corporate income tax is levied. Additionally, in the hope Boeing might decide to move its production of aircraft wings out of Washington, other state policymakers met to pass targeted tax carve-outs to entice the firm to move to their states. One egregious example of this was in Missouri, when Governor Jay Nixon called a special session for lawmakers to pass a special tax carve-out agreement in an effort to lure the company to Missouri. Ironically, this special session was called shortly after Gov. Nixon vetoed a small but broad-based income tax cut for Missourians.12 Despite creating an environment with higher tax rates on a shrinking number of people and industries, special tax carve-outs can also be somewhat of a hypocritical policy for some states. Often, some will claim that “taxes don’t matter” to creating economic growth or attract-ing businesses and people. But while doing so, these same states make every effort to extend special tax favors to companies and industries that relocate to their state. Case Study: New York State A textbook example of this hypocrisy is the state of New York. The Em-pire State ranked dead last in the most recent edition of Rich States, Poor States: ALEC-Laffer State Economic Competitiveness Index. It also has the highest marginal corporate income tax rate in the na-tion and the second highest marginal personal income tax rate. But despite New York’s refusal to acknowledge that taxes matter to eco-nomic growth, Governor Andrew Cuomo and the state legislature have developed a plan to grow the economy: create specialized tax 10 • AMERICAN LEGISLATIVE EXCHANGE COUNCIL carve-outs for industries and exempt them from one of the worst tax climates in the country by setting up “Empire Zones.” The Empire Zones are specific geographical areas that require would-be businesses to locate there and meet the zone’s many eligibility requirements. These requirements are laid out in a 64-page document and administered by the New York Department of Taxation and Finance.13 Apparently the irony in providing generous tax carve-outs “needed” to foster new businesses in one of the worst tax policy climates is lost on the state’s lawmakers. Meanwhile, average New Yorkers will continue to pay much higher tax rates than the rest of the country so that these special businesses and industries can be exempted. Apparently the irony in providing generous tax carve-outs “needed” to foster new businesses in one of the worst tax policy climates is lost on the state’s lawmakers. The Failure of Central Economic Planning Setting aside the issue of grossly deviating from generally accepted principles of sound tax policy (i.e., securing the broadest possible base and the lowest possible rate), the issue of specific tax carve-outs can be reduced to two different views on how best to achieve economic growth: growth through markets vs. growth through central planning. In a classic essay, “The Use of Knowledge in Society,” economist Frie-drich Hayek argues strongly that no one person (or group of people) could ever match the level of knowledge that is held by all the individual actors in the market. Knowledge is decentralized, and for this reason, it is more efficient to make use of local knowledge to make economic decisions rather than trying to centrally plan an economy. On this topic, Hayek is famous for claiming that “the curious task of economics is to demonstrate to men how little they really know about what they imag-ine they can design.”14 Even before the arguments regarding economic efficiency begin, the disagreement between the growth through markets and the growth through central planning camps starts at the most basic level of what the tax code should or should not be used to achieve. Generally, the growth through markets camp would agree that the tax code should be used only to raise revenue for the necessary core functions of gov-ernment and should do so in a way that impacts people, decisions and businesses as little as possible. Conversely, the growth through central planning camp sees the tax code as a policy tool to incentivize certain industries, punish others and direct the overall economy to a specific preferred outcome.
- 11. THE UNSEEN COSTS OF TAX CRONYISM: FAVORITISM AND FOREGONE GROWTH THE STATE FACTOR • 11 The practical problem with the growth through central planning ap-proach, as Hayek pointed out long ago, is simply that policymakers and experts cannot direct the economy with the precision they imagine, and certainly not without the unforeseen consequences and tradeoffs that often are ignored. For instance, the higher tax rates on the unfavored industries and businesses will hamper overall economic growth. A study from Christina Romer, formerly the head of the Council of Economic Advisers for President Obama, and David Romer, Christina’s husband, found that for each one percent increase in taxation, real GDP was low-ered by two to three percent.15 This assessment coincides with the vast majority of economic evidence that lower taxes mean more economic growth.16 The lost economic growth due to artificially higher taxes on a shrinking tax base to prop up the tax carve-outs for favored industries is rarely mentioned as a cost. Another problem with the growth through central planning approach is the assumption that policymakers have some special knowledge about which industry or business is best suited to be located in a specific state, rather than the business or industry knowing itself. Artificially creating policies that encourage firms to move can result in a misallocation of re-sources. When resources are misallocated by government interference and the tax treatment of similar firms is different, market distortions are created. Certain goods become cheaper than they would be otherwise, disrupting price signals for the rest of the market. Some firms remain profitable when they otherwise would not, creating a class of firms that are heavily dependent upon government to continue. The existence of these market distortions can have wide effects through the economy because the prices, supply and/or demand for certain goods or services are artificially disrupted and distorted.17 These distortions are the un-seen costs of tax carve-outs. The idea that planned economies are superior was proven false long ago as part of the Soviet era “Socialist Calculation Debate” within the economics field.18 But the prevalence of specific tax carve-outs is a concession to the basic assumption of planned economies—that pol-icymakers know what is best. They understand which industries and businesses will drive economic growth, which industries and businesses should be located where and, most importantly, that any tax carve-out is certainly worth any corresponding cost to the economy. There is no good evidence to support these assumptions. Create a Level Playing Field The cost of the growth through central planning approach can be mea-sured by the destruction of the level playing field for all competitors in the market. It becomes much more difficult for smaller, mid-size and new firms to compete with the larger and more politically connect-ed firms in this scenario. These smaller firms cannot effectively lobby for comparable tax carve-outs relative to their larger competitors. Tax carve-outs often create a culture that emphasizes relocation of busi-nesses from other states and a bias toward larger-sized firms. They can also crowd out unsubsidized competitors and can even lead to the com-pulsory funding of a firm’s competitors. The entire purpose of economic development departments through-out the states is to lure businesses to come to their state. There is no problem informing companies of options and benefits that a certain state can offer, but often the economic development department will offer special deals that create carve-outs to the tax base to attract spe-cific firms. By giving tax carve-outs to newly relocated competitors, the deals often make it cheaper for relocated businesses to operate than the firms that were in the state originally. Ideally, neither new nor ex-isting firms in a state would have any tax advantage over each other. Complementing the culture of business relocation, a larger-firm bias is also present in the tax carve-out strategy. Bigger businesses from other states are better targets for incentive packages than smaller businesses located out-of-state. But the advantage of large businesses goes even further. Large businesses are able to afford the lobbying efforts neces-sary to gain and maintain the specific tax carve-outs they enjoy, while smaller and mid-size competitors often cannot. One famous example is a Utah State University study that tracked over 200 companies that received money from the Troubled Asset Relief Program (TARP). The authors found that “for every dollar spent on lobbying during the five years before the TARP bailout, firms received between $485.77 and $585.65 in TARP support.”19 While this is a federal example, and data is difficult to come by on the state level, in general, larger firms that can afford to influence policymakers can enjoy a greater amount of tax carve-outs and other government privileges. Additionally, tax carve-outs given to larger firms reduce the cost of do-ing business for these firms overall. This means the smaller firms are left to compete with large competitors that have lower tax rates. Having firms compete against one another in the market is the cornerstone of the economy, but it only works if there is a level playing field in which all competitors know the rules and are treated equally. But the creation of tax carve-outs specifically intends to treat them differently, perhaps even causing some firms to go out of business that otherwise would not have failed. This effect serves to crowd out the businesses and indus-tries that did not get the favorable tax carve-outs.
- 12. THE STATE FACTOR For this reason, the ALEC Principles of Taxation, which can be viewed in Appendix A, make clear that the tax system should not “be used to bestow special favors on any particular group of taxpayers.” These types of carve-outs violate the principle of equity and fairness in the tax code. By treating firms differently for arbitrary and political reasons, the gov-ernment is essentially picking winners and losers through the tax code.20 Specialized tax carve-outs deviate from the premise of a fair and equal playing field for all and can open the door to misuse. Close the Door to Rent Seeking The focus of this paper is on cronyism, specifically state tax cronyism in the form of preferential tax carve-outs given to various favored busi-nesses and industries. While this paper considers all these special carve-outs (with the exception of a few caveats outlined at the beginning) to be cronyist in nature, they open the door to real corruption. Economist David R. Henderson begins his paper, “The Economics and History of Cronyism,” with a fitting anonymous quote, “When you leave the honey jar open, expect ants.”21 While it is true that many of these specialized tax carve-outs can be created based on the best of intentions, it is equally true that many of them do not necessarily come from the best intentions. When politi-cians and unaccountable agencies are given the power to strike special deals with businesses that can save them extremely large amounts of money and give them a competitive edge, the door is certainly open for less-than-appropriate deals to take place. Clearly, businesses see a growing opportunity to work with governments at all levels to increase their competitive edge. In 1973, only 14 percent of Fortune 1,000 companies had people with “government service ex-perience” on their boards; since 2002 it has been over 50 percent.22 Despite the occasional shocking story of outright gross corruption, the power that tax carve-outs can have on businesses and their relationship with government officials can often be overlooked. But when the gov-ernment has the power to skew the rules in favor of certain industries or businesses, they have an incredible incentive to get increasingly friendly with those making the decisions about who gets special tax treatment and who does not. 12 • AMERICAN LEGISLATIVE EXCHANGE COUNCIL However, businesses should not bear the blame for these specific tax carve-outs, or at least not all businesses are equally to blame. There is a significant difference between firms that actively lobby to re-write special rules that hamper competition and create barriers to entry for new firms entering the market and firms that simply use the carve-outs that exist to decrease their tax liability. Businesses have every incentive and legal right to use the carve-outs that are available to them. The real problem is not that businesses are acting in their own rational self-in-terest, but rather that the tax system they are a part of is fundamentally flawed. The focus of reform should not be demonizing responsible busi-nesses acting in a legal and rational way, but rather on fixing the prob-lem that results from favoring certain industries or businesses through specialized carve-outs in the tax code. Tax Carve-Outs Don’t Work Tax carve-outs distort the market, violate the principles of sound tax policy, destroy the level playing field for firms in the market and open the door to ever-increasing rent-seeking. Still, could some consider this tradeoff worth the cost? Except for a few anecdotes, the data over-whelmingly show that despite these high economic costs, packing the tax code with specialized tax carve-outs for businesses and industries does not even achieve the goals of economic growth and job creation.23 When a state endeavors to lure a company into its borders using tar-geted tax carve-outs, the results can vary. Many times, the company would have located in that state even in the absence of state-offered tax carve-outs. But sometimes companies shop around for a good deal and are ready to relocate at a moment’s notice for a better one. If this While it is true that many of these specialized tax carve-outs can be created based on the best of intentions, it is equally true that many of them do not necessarily come from the best intentions.
- 13. THE UNSEEN COSTS OF TAX CRONYISM: FAVORITISM AND FOREGONE GROWTH Given the high cost, few benefits, large economic distortion and temptation for quid-pro-quo corruptions that come with tax cronyism, states should reverse the trend of using them to incentivize growth. THE STATE FACTOR • 13 were the case, the state is in a bind. Should it expand the tax carve-outs it already gave the firm or simply let it go? Too often, states choose to expand tax carve-outs under pressure from firms that will always be asking for more. Case Study: Maryland Consider the case recently in Maryland. Netflix’s hit show, “House of Cards,” was given a generous tax carve-out worth about $11 million for choosing to shoot the first season of the show in Maryland. Tax carve-outs for the second season could total about $15 million. But in spite of these enormous tax carve-outs, the show’s producers called upon Maryland lawmakers to pass even more tax credits for the show or else they would relocate to another state.24 After reaching a deal with Gov-ernor Martin O’Malley, the show will remain in Maryland to shoot the third season, and will receive another $11.5 million in tax carve-outs that were not originally planned.25 Case Study: Oregon and Illinois The latest examples of states put in a tough spot by companies demand-ing higher tax carve-outs just to stay in the state are Oregon and Illinois. Oregon is in talks to keep Intel in the state, offering millions of dollars in extra tax carve-outs.26 Illinois passed tax carve-out deals with CME Group Inc. and Sears Holdings Corporation to keep them in the state at a cost of $218 million per year, at a time when general corporate tax rates have gone up dramatically and Oregon and Illinois are dangerously underfunding their pension systems.27 Case Study: New Jersey New Jersey is another state that is in the limelight for its disappointing results of tax carve-outs. A report from New Jersey Policy Perspective examines the $4 billion worth of tax carve-outs the state has given out since 2010 and deems the results a “largely unsuccessful attempt to spur economic activity.” The report goes on to note that since 2010, the $4 billion in tax carve-outs went to only 252 companies and left the majority of New Jersey businesses and residents to make up the lost revenue.28 On a related note, New Jersey has consistently maintained some of the highest taxes in the country, and now, faced with a major budget shortfall (particularly due to underfunded pensions), the New Jersey legislature may resort to raising over $1 billion in taxes on resi-dents and businesses yet again.29 Overall, there are some good reasons to doubt the real-world effective-ness of tax carve-outs and very little evidence to support their contin-uation. States do not have the advantage of seeing what the economy would be like without specialized tax carve-outs, but the evidence pre-sented in this paper suggests it would eliminate distortions, cut waste and help economic growth in the long term. There is no strong evidence that tax carve-outs are as effective at cre-ating jobs and spurring economic growth as they claim. As opposed to lower general tax rates and a competitive business climate, specialized tax carve-outs are subject to fleeting political whims and tend to target firms that are always searching for the better deal rather than firms that are actually positioned to naturally grow the economy without an artifi-cial advantage. In fact, a review of the literature on tax carve-outs shows that “most empirical studies on tax incentives find that they have little or no effect on employment or on the economy as a whole.”30 Solutions for Fixing the Tax Code Tax cronyism is a bad deal for the states. The problems are pervasive and cannot be entirely mitigated by improved structuring and process-es. Moreover, the benefits are weak, particularly once it is acknowl-edged that exempting some businesses from the tax base while trying to reach a given revenue target requires higher rates on the rest of the tax base. Given the high cost, few benefits, large economic distortion and temptation for quid-pro-quo corruptions that come with tax crony-ism, states should reverse the trend of using them to incentivize growth. This should be done in a revenue-neutral fashion and, ideally, alongside broader fundamental tax reform that lowers the overall burden of tax-ation, thereby giving competitive tax rates to all taxpayers and minimiz-ing the number of losers from fundamental tax reform. The best option would be to eliminate all current tax carve-outs that deviate from the tax base, while lowering tax rates on productive be-havior, such as income taxes, in a revenue-neutral or revenue-negative tax reform package. However, this might be a politically heavy lift for many states. Even if this option isn’t immediately achievable, there are some concrete examples of good policy other states have adopted that can help to control and, eventually, reverse the problem of specialized tax carve-outs. Tax Carve-Out Transparency—Washington Washington state is one success story in attempting to reverse the trou-bling trend of tax carve-outs. In 2013, thanks largely to the efforts of the Washington Policy Center, the state of Washington approved a law that added desperately needed clarification to the state’s tax carve-outs. Specifically, whenever a new tax carve-out is proposed, the legislature must include the reason for the deviation from the tax base and (in some cases) set specific benchmarks so policymakers can review the tax carve-out and evaluate whether it is successful and should continue.31
- 14. THE STATE FACTOR Transparency is key. Many people, including policymakers, are not aware of all the various tax carve-outs that hide in their tax codes, let alone what those proposals were intended to achieve. By requiring benchmarks for success and timelines for new tax carve-outs, legisla-tures can at least identify which carve-outs are achieving their goals and which are not. This information alone is lacking in many states today. By increasing transparency and being able to identify the reasons be-hind tax carve-outs and which ones are failing to meet goals, policymak-ers will have the tools they need to clean out their tax codes and more carefully evaluate which carve-outs get included in the first place. This type of transparency should be applied to any proposed new tax carve-outs moving forward and should not undermine the privacy of taxpayers through retroactive reporting requirements. The Pew Center on the States report, “Evidence Counts,” provides a guide for states looking to improve their transparency and obtain con-crete evidence of tax preference performance. Further, ALEC has model policy (see Appendix B) based on the Washington state experience that can serve as a guide for policymakers attempting to subject tax cronyism to sunlight. Cash Subsidies, Not Tax Carve-Outs—Michigan One important step states can take to address tax carve-outs, particu-larly those that involve targeted preferences to just one firm, is to put these programs “on budget.” That is, make them cash payments done through the standard state appropriation process, not elements of the tax code or off-budget tax abatement. One reason for this move is predictability. Many states end up essen-tially unaware of the extent of tax credits and target preferences they owe to firms and individuals. This introduces massive revenue volatil-ity to tax collections and makes appropriate budgeting, particularly in the context of state balanced-budget requirements, extremely difficult. Through annual appropriations processes and cash payouts, states can better forecast what revenue they can expect to take in and the value of business subsidies they will pay out. Another reason is framing. These tax carve-outs are essentially econom-ically indistinguishable from cash subsidies; but they are framed as tax cuts, which is deceptive. Firms receiving carve-outs can claim that the elimination of these preferences essentially is a tax increase, and legis-lators who support tax carve-outs can frame them as tax cuts instead of business subsidies. Moreover, having these preferences on the tax side underestimates the state’s true public expenditure. Michigan took this important step under the Snyder administration for many of the state’s targeted tax preferences administered by the Michi-gan Economic Development Corporation.32 This state’s leadership is con-verting these subsidies from tax carve-outs to cash payments, which is sound in terms of budget integrity and political framing. Eliminate Tax Carve-Outs and Reduce Rates It is worth mentioning that some “fixes” try to solve the problem in a negative way. Attempting to close off these tax carve-outs without de-creasing 14 • AMERICAN LEGISLATIVE EXCHANGE COUNCIL tax rates elsewhere can be a devastating blow to firms within a given state. This amounts to a tax increase to firms that harms state competitiveness, which policymakers should avoid. The overall goal of tax policy is to raise revenue for the core functions of government and to do so with as little distortion or burden on state residents and businesses as possible. If tax carve-outs are eliminated and rates for everyone are reduced, an equal playing field is achieved and everyone is better off. However, if tax carve-outs are eliminated and there are no accompanying rate cuts to make up for this, the tax code will be more fair but more burdensome and distortionary. Using the elimination of tax carve-outs to raise revenue undermines the key goal of tax reform: improving state economic competitiveness. Conclusion Specialized carve-outs in the tax code are distortionary and ineffective at best, and examples of government cronyism at worst. These carve-outs run contrary to the principles of sound tax policy and the basic fairness of a level playing field for all businesses to compete. Every state has these types of carve-outs in their tax codes to some degree, mean-ing that every state economy is held back, at least to some extent, from achieving their true potential for economic growth. Identifying and lim-iting specialized carve-outs in the tax code is an important policy tool that lawmakers can use to make their business climate more fair and ultimately grow their state’s economy without arbitrarily favoring one business or industry over others. Additionally, identifying tax carve-outs for elimination can be the golden ticket to fundamental tax reform. These carve-outs can be included in any package to broaden the tax base and lower the tax rate in either a revenue-neutral way or as part of a larger tax cut package. This allows states to end tax carve-outs and make their tax policy climate compet-itive and open for everyone. Lower rates, broader bases and an equal playing field with no favors make a recipe for economic success.
- 15. THE UNSEEN COSTS OF TAX CRONYISM: FAVORITISM AND FOREGONE GROWTH THE STATE FACTOR • 15 Appendix A: ALEC Principles of Taxation The proper function of taxation is to raise money for core functions of government, not to direct the behavior of citizens or close budget gaps created by overspending. This is true regardless of whether government is big or small, and this is true for lawmakers at all levels of government. Taxation will always impose some level of burden on an economy’s performance, but that harm can be minimized if policymakers resist the temp-tation to use the tax code for social engineering, class warfare and other extraneous purposes. A principled tax system is an ideal way for advancing a state’s economic interests and promoting prosperity for its residents. The goal of American tax policy should be to raise revenue for functions of government in a way that minimizes distortions, so as to grow the overall economy and facilitate commerce. Guiding principles of taxation The fundamental principles presented here provide guidance for a neutral and effective tax system: one that raises needed revenue for core func-tions of government, while minimizing the burden on citizens. • Simplicity – The tax code should be easy for the average citizen to understand, and it should minimize the cost of complying with the tax laws. Tax complexity adds cost to the taxpayer, but does not increase public revenue. For governments, the tax system should be easy to administer, and should help promote efficient, low-cost administration. • Transparent – Tax systems should be accountable to citizens. Taxes and tax policy should be visible and not hidden from taxpayers. Changes in tax policy should be highly publicized and open to public debate. • Economic Neutrality – The purpose of the tax system is to raise needed revenue for core functions of government, not control the lives of cit-izens or micromanage the economy. The tax system should exert minimal impact on the spending and decisions of individuals and businesses. An effective tax system should be broad-based, utilize a low overall tax rate with few loopholes and avoid multiple layers of taxation through tax pyramiding. • Equity and Fairness – The government should not use the tax system to pick winners and losers in society, or unfairly shift the tax burden onto one class of citizens. The tax system should not be used to punish success or to “soak the rich,” engage in discriminatory or multiple taxation, nor should it be used to bestow special favors on any particular group of taxpayers. • Complementary – The tax code should help maintain a healthy relationship between the state and local governments. The state should always be mindful of how its tax decisions affect local governments so they are not working against each other – with the taxpayer caught in the middle. • Competitiveness – A low tax burden can be a tool for a state’s private sector economic development by retaining and attracting productive business activity. A high-quality revenue system will be responsive to competition from other states. Effective competitiveness is best achieved through economically neutral tax policies. • Reliability – A high-quality tax system should be stable, providing certainty in taxation and in revenue flows. It should provide certainty of financial planning for individuals and businesses. Benefits of a principled tax burden Since taxes lower the economic welfare of citizens, policymakers should try to minimize the economic and social problems that taxation imposes. Citizens then directly gain the benefits of a low tax burden. These benefits are summarized below: • Greater economic growth – A tax system that allows citizens to keep more of what they earn spurs increased work, saving and investment. A low state tax burden would mean a competitive advantage over states with high-rate, overly progressive tax systems. • Greater wealth creation – Low taxes significantly boost the value of all income-producing assets and help citizens maximize their fullest eco-nomic potential, thereby broadening the tax base. • Minimize micromanagement and political favoritism – A complex, high-rate tax system favors interests that are able to exert influence in the state capitol, and who can negotiate narrow exemptions and tax benefits that help only limited taxpayers and not the general economy. “A fair field and no favors” is a good motto for a strong tax system. Approved by the ALEC Board of Directors on June 3, 2010.
- 16. THE STATE FACTOR Appendix B: The ALEC Tax Expenditure Transparency Act Summary The legislature finds that the state’s tax code includes tax expenditures enacted to achieve a variety of policy goals for the public interest. The ultimate goal should be for the state’s tax system to reflect sound principles of taxation. In order to make policy choices going forward regarding the best use of limited state resources, the legislature concludes that it is necessary to articulate the legislative intent and have measurable perfor-mance goals for each tax expenditure created. Model Policy Short Title. This Act shall be known and may be cited as the “Tax Expenditure Transparency Act.” Section 1. (A) For purposes of this section, “tax expenditure” means a provision in the tax code that provides incentives for particular kinds of activities or that gives special or selective relief to certain groups of taxpayers. “Tax expenditures” are considered deviations from the normative tax base. (1) “Tax expenditures” shall not include: (a) deductions to arrive at income under an income tax; (b) exemptions of business inputs under a sales tax; (c) deductions or credits used to offset a discriminatory tax or fee. (B) For any bill introduced in either the House of Representatives or the Senate that adopts a new tax expenditure or expands or extends an existing tax expenditure, the bill should include legislative intent provisions, establishing the policy goals, and any related metrics. Section 2. {Severability clause} Section 3. {Repealer clause} Adopted by the Tax and Fiscal Policy Task Force at the Annual Meeting, August 9, 2013. Approved by the ALEC Board of Directors, September, 30, 2013. 16 • AMERICAN LEGISLATIVE EXCHANGE COUNCIL
- 17. THE UNSEEN COSTS OF TAX CRONYISM: FAVORITISM AND FOREGONE GROWTH (Endnotes) 1 Mitchell, Matthew. “The Pathology of Privilege.” The Mercatus Center at George Mason University. March 2014. 2 Henderson, David R. “The Economics and History of Cronyism.” The Mercatus Center at George Mason University. July 26, 2012. 3 ALEC Principles of Taxation. American Legislative Exchange Council Task Force on Tax and Fiscal Policy. Also see: McBride, William. “What is the Evidence on Taxes and Growth?” Tax Foundation. December 18, 2012. Also see: McBride, William. “Empirical Evidence on Taxes and Growth: A Response to CBPP.” Tax Foundation. February 21, 2014. 4 Cline, Robert; Phillips, Andrew; and Neubig, Tom. “What’s Wrong with Taxing Business Services? Adverse Effects from Existing and Proposed Sales Taxation of Busi-ness THE STATE FACTOR • 17 Investment and Services.” Council on State Taxation. April 4, 2013. 5 Freeland, William and Sullivan, Cara. “Fair Business Competition Requires a Neutral, Consumption-Based Tax System.” American Legislator. July 18, 2013. 6 Data calculated by the U.S. Treasury Department and published in the Office of Management and Budget’s “Analytical Perspectives” report. 7 Leachman, Michael; Grundman, Dylan; and Johnson, Nicholas. “Promoting State Budget Accountability Through Tax Expenditure Reform.” Center for Budget and Policy Priorities. May 2011. Also see: “Five Steps Towards a Better Tax Expenditure Debate.” Institute for Taxation and Economic Policy. October 2012. Also see: Free-land, William. “A Halloween Horror Story: Tax Carve-Outs Edition.” American Legislator. October 2013. Also see: Splinter, David. “Transparency for Tax Expenditures: A California Proposal.” Tax Foundation. July 2009. Also see: Kleinbard, Edward D. “The Hidden Hand of Government Spending.” Regulatory Magazine. October 2010. 8 “Evidence Counts: Evaluating State Tax Incentives for Jobs and Growth.” The Pew Center on the States. April 2012. 9 Story, Louise; Fehr, Tiff; and Watkins, Derek. “United States of Subsidies.” The New York Times. December 2012. 10 ALEC Principles of Taxation. American Legislative Exchange Council Task Force on Tax and Fiscal Policy. 11 Westneat, Danny. “Tax Breaks for Boeing: We’re No. 1.” The Seattle Times. November 13, 2013. 12 Freeland, William and Wilterdink, Ben. “Missouri Tax Hypocrisy.” RedState. January 17, 2014. 13 Parts 10 through 14 of the Regulations of the Commissioner of Economic Development. New York State Department of Taxation and Finance. 14 Hayek, Friedrich. The Fatal Conceit: The Errors of Socialism. University of Chicago Press. 1988. 15 Fruits, Eric and Pozdena, Randall. Tax Myths Debunked. American Legislative Exchange Council. 2013. 16 McBride, William. “What is the Evidence on Taxes and Growth?” Tax Foundation. December 18, 2012. 17 Coyne, Christopher J. and Moberg, Lotta. “The Political Economy of State-Provided Targeted Benefits.” The Mercatus Center at George Mason University. May 2014. 18 Boettke, Peter. “Socialism and the Market: The Socialist Calculation Debate Revisted.” Routledge. 2000. 19 Blau, Benjamin; Brough, Tyler; and Thomas, Diana. “Corporate Lobbying, Political Connections, and the 2008 Troubled Asset Relief Program” (under review at the Journal of Financial Economics). Via Mitchell, Matthew. “The Pathology of Privilege: The Economic Consequences of Government Favoritism.” The Mercatus Center at George Mason University. March 2014. 20 ALEC Principles of Taxation. American Legislative Exchange Council Task Force on Tax and Fiscal Policy. 21 Henderson, David R. “The Economics and History of Cronyism.” The Mercatus Center at George Mason University. July 26, 2012. 22 Schweizer, Peter. Throw Them All Out. Houghton Mifflin Harcourt Publishing Company. 2011. 23 Coyne, Christopher J. and Moberg, Lotta. “The Political Economy of State-Provided Targeted Benefits.” The Mercatus Center at George Mason University. May 2014. 24 Johnson, Jenna. “’House of Cards’ Threatens to Leave if Maryland Comes Up Short on Tax Credits.” The Washington Post. February 20, 2014. 25 Johnson, Ted. “’House of Cards’ Receives Maryland Tax Credits.” Variety. April 25, 2014. 26 Dondero, Russ. “Intel Jumps through Oregons [sic] Tax Loophole.” Hillsboro Tribune. April 12, 2013. 27 Bergen, Kathy. “Illinois House OKs Tax Breaks for CME, Sears.” Chicago Tribune. December 12, 2011. 28 DePaul, Jennifer. “New Jersey Tax Subsidies Surge Doesn’t Equal Economic Boom, Report Says.” Tax Analysts. June 12, 2014. 29 Rizzo, Salvador. “NJ budget clears first hurdles in Legislature, with $1 billion in tax hikes.” The Star Ledger. June 25, 2014. 30 Calcagno, Peter T. and Hefner, Frank. “Unleashing Capitalism: A Prescription for Economic Prosperity in South Carolina.” The South Carolina Policy Council. 2010. Via Coyne, Christopher J. and Moberg, Lotta. “The Political Economy of State-Provided Targeted Benefits.” The Mercatus Center at George Mason University. May 2014. 31 Mercier, Jason. “American Legislative Exchange Council Considers Washington’s New Tax Preference Transparency Law.” Washington Policy Center. August 13, 2013. 32 LaFaive, Michael. “Good, Bad, Ugly of Gov. Snyder’s Budget.” Michigan Capitol Confidential. February 2011.
- 18. THE STATE FACTOR Acknowledgements The authors recognize and express thanks to Jacob Gram and Jacob Kohlhepp, for their research contributed greatly to this project. Special thanks are due to Chris Edwards of the Cato Institute; Matt Mitchell of the Mercatus Center; and Scott Drenkard, Liz Malm and Lyman Stone of the Tax Foundation for their valuable feedback on this report. We also thank our colleagues: Kati Siconolfi, Ted Lafferty, Bill Meierling, Ashley Varner, Molly Fuhs, Jordan Conrad, Michael Bowman and the staff of the American Legislative Exchange Council for their many efforts to ensure the publishing of this report in a timely manner. Finally, we thank the numerous economists and tax policy researchers who provided important analyses on these matters that informed our own research. We hope these research findings serve to educate America's state policymakers and members of the public interested in fair, neutral, pro-growth tax reform. 18 • AMERICAN LEGISLATIVE EXCHANGE COUNCIL
- 19. THE UNSEEN COSTS OF TAX CRONYISM: FAVORITISM AND FOREGONE GROWTH THE STATE FACTOR • 19 About the American Legislative Exchange Council The American Legislative Exchange Council is America’s largest nonpartisan, voluntary membership organization of state legislators. Made up of nearly one-third of America’s state elected officials, the Council provides a unique opportunity for state lawmakers, business leaders and citizen or-ganizations from around the country to share experiences and develop state-based, pro-growth models based on academic research, existing state policy and proven business practices. The ultimate goal of the Exchange Council is to help state lawmakers make government work more efficiently and move government closer to the communities they serve, thereby creating opportunity for all Americans. In state legislatures around the country, citizen groups foster ideas, participate in discussions and provide their points of view to lawmakers. This process is an important part of American Democracy. The Exchange Council and its nine task forces closely imitate the state legislative process: resolutions are introduced and assigned to an appropriate task force based on subject and scope; meetings are conducted where experts present facts and opinion for discussion, just as they would in com-mittee hearings; these discussions are followed by a vote. Council task forces serve as testing grounds to judge whether resolutions can achieve consensus and enough support to survive the legislative pro-cess in a state capitol. All adopted model policies are published at www.alec.org to promote increased education and the open exchange of ideas across America. The Exchange Council’s Nine Task Forces and Issue Areas Include: TASK FORCE ON CIVIL JUSTICE • Civil Liability Predictability • Fairness in Damages • Discouraging Lawsuit Abuse TASK FORCE ON COMMERCE • Limiting Government Mandates on Business • Transportation and Infrastructure • Employee Rights and Freedoms TASK FORCE ON ENERGY, ENVIRONMENT AND AGRICULTURE • Energy Affordability and Reliability • Regulatory Reform • Agriculture and Land Use TASK FORCE ON EDUCATION • Education Reform • Parental Choice • Efficiency, Accountability and Transparency TASK FORCE ON HEALTH AND HUMAN SERVICES • Pro-Patient, Free Market Health Policy • Private and Public Health Insurance • Federal Health Reform TASK FORCE ON INTERNATIONAL RELATIONS • International Trade • Intellectual Property Rights Protection • Federalism TASK FORCE ON TAX AND FISCAL POLICY • Pro-Growth Tax Reform • Priority-Based Budgeting • Pension Reform TASK FORCE ON COMMUNICATIONS AND TECHNOLOGY • Broadband Deployment • Consumer Privacy • E-Commerce JUSTICE PERFORMANCE PROJECT • Recidivism Reduction • Overcriminalization • Data-Driven Criminal Justice Reform
- 20. To learn more about how the American Legislative Exchange Council helps develop innovative solutions in partnership with lawmakers and business leaders, or to become a member, please visit www.alec.org. American Legislative Exchange Council 2900 Crystal Drive, Suite 600 Arlington, VA 22202 Tel: 703.373.0933 Fax: 703.373.0927 www.alec.org 2900 Crystal Drive, Suite 600 Arlington, VA 22202 www.alec.org STATE A PUBLICATION OF THE AMERICAN LEGISLATIVE EXCHANGE COUNCIL FACTOR the