SlideShare ist ein Scribd-Unternehmen logo
1 von 1
Europe: World’s top economic power
Cradle of ABB


ABB in Europe
                                                                 Four out of seven ABB research
Revenues 2011:                                                   centers are located in Europe:
US $ 15 bn                                                       Krakow, Poland
                                                                 Ladenburg, Germany
Employees 2011:                                                  Västeras, Sweden
60,300                                                           Baden, Switzerland


World’s leading economic power
Europe has the largest economy among all
regions in the world. The Gross Domestic
Product (GDP) of the European countries is
approximately E 2,000 billion larger than the
GDP of the Unites States. In comparison to
                                                     Europe                USA                   BRICS
the rising national economies of the BRICS-
countries Brazil, Russia, India, China and        E 13,221           E 11,174                E   8,803
South Africa, the GDP of Europe is larger by         bn                 bn                        bn
around E 4,400 billion.


Largest internal trade worldwide

                                                 Asia	                            9.3 %	         E 403 bn 
         Europe	

     71 %                                        Northern Europe	

                                                 Commonwealth states	
                                                                                  7.4 %	

                                                                             3.2 %	
                                                                                                 E 320 bn

                                                                                                 E 138    bn
     E 3,075 bn                                  Africa	                     3.1 %	              E 136    bn 
                                                 Middle East	                3.0 %	              E 129    bn 
                                                 South and Central America 	 1.7 %	              E   75   bn 
                                                 Other	                      1.3 %	              E   56   bn 


The largest share of trade is between European countries.
71 % of all exported goods from European countries are destined for the European market.


Magnet for foreign                                                   In total, the flow of
direct investment                                                    investments into Europe
                                                                       three times
                                                                     are
                                                                     as big as that into
                                                                     America or Asia.


The flow of investments to Europe in  2010    counted E
Two-thirds of these came from European countries.
                                                              9,736               billion.


Competitive and innovative
In the listing of worldwide competitiveness there are seven European national
economies among the leading ten. The ranking of the most innovative countries
shows    six out of ten countries are from Europe.

           	 1.	Switzerland                              	 1. 	Switzerland
           	 2.	Singapore                                	 2. 	Sweden
           	 3. 	Sweden                                  	 3. 	Japan
           	 4. 	Finland                                 	 4. 	Finland
           	 5. 	USA                                     	 5. 	Germany
           	 6. 	Germany                                 	 6. 	USA
           	 7. 	Netherlands                             	 7. 	Israel
           	 8. 	Denmark                                 	 8. 	Denmark
           	 9. 	Japan                                   	 9. 	Netherlands
           10. Great Britain                             10. Taiwan, China
          The Global Competitiveness                     The Global Competitiveness
          Index 2011 – 2012, Overall Index,              Index 2011 – 2012, Innovation
          World Economic Forum                           and sophisticated factors,
                                                         World Economic Forum


Expenses for research and
development
In   2010 around E 160 billion has been invested in research and development in Europe.
This amount is about    ten times      as high as the global players Microsoft, IBM, Google, Apple
and 3M spend per year on research and development put together.


     Microsoft	     	           E 6.7   bn
     IBM	           	           E 4.6   bn            x 10 = Europe
     Google	        	           E 2.9   bn
     Apple	         	           E 1.4   bn
     3M	            	           E 1.1   bn

                        = total E 16.7 bn


Investments in the energy infrastructure
                                                     In order to achieve the targets of climate
                                                     and environmental protection, around
                                                     E 1,000 billion has to be invested according to
                                                     the European Commission. Of these, around
                                                     E 200 billion is needed for the electricity grid.


                                                         E 104 billion alone is
                                                         set aside for rehabilittion
                                                         and building of additional
                                                         51,500 kilometers of high
                                                         voltage lines.


Revamping Europe’s power supply

                                                              Europe’s targets:

                                                              20 – 20 – 20
                                                              Up to the year 2020, 20 % less
                                                              CO2 emissions, 20 % more energy
                                                              efficiency and 20 % more renew-
                                                              ables.

                                                            As electric energy will increasingly be
                                                            produced far away from the consu-
                                                            mers, the European system of energy
                                                            supply is facing fundamental change.


Investments in renewable energy
on a record high
In 2011 around E 200 billion was invested in renewable energies, E 77 billion of which in Europe
alone. The investments of the record year 2011 were five times as high as in 2004.


                                                                              E 77 bn
                                                                            in Europe

                                              5 x
                                        invested in
          E   41        bn
                                    renewable energies
                                                                           E   200               bn

              2004                                                                2011

Weitere ähnliche Inhalte

Ähnlich wie Infographic Europe - Cradle of ABB

Energy Efficiency in Buildings, IPEEC
Energy Efficiency in Buildings, IPEEC Energy Efficiency in Buildings, IPEEC
Energy Efficiency in Buildings, IPEEC
nooone
 
Bitec 2013 , IPEEC
Bitec 2013 , IPEECBitec 2013 , IPEEC
Bitec 2013 , IPEEC
nooone
 
Eurozone Crisis
Eurozone CrisisEurozone Crisis
Eurozone Crisis
Yash Jain
 

Ähnlich wie Infographic Europe - Cradle of ABB (15)

The case for VC and the opportunity in Europe
The case for VC and the opportunity in EuropeThe case for VC and the opportunity in Europe
The case for VC and the opportunity in Europe
 
Europe vc tech ecosystem report
Europe vc tech ecosystem report Europe vc tech ecosystem report
Europe vc tech ecosystem report
 
Energy Efficiency in Buildings, IPEEC
Energy Efficiency in Buildings, IPEEC Energy Efficiency in Buildings, IPEEC
Energy Efficiency in Buildings, IPEEC
 
UK support for energy in developing countries 2010-14: Pie charts and graphs
UK support for energy in developing countries 2010-14: Pie charts and graphsUK support for energy in developing countries 2010-14: Pie charts and graphs
UK support for energy in developing countries 2010-14: Pie charts and graphs
 
Bitec 2013 , IPEEC
Bitec 2013 , IPEECBitec 2013 , IPEEC
Bitec 2013 , IPEEC
 
2. european union
2. european union2. european union
2. european union
 
What does BREXIT mean for my EU funding? EU Environmental Funding Webinar
What does BREXIT mean for my EU funding? EU Environmental Funding Webinar What does BREXIT mean for my EU funding? EU Environmental Funding Webinar
What does BREXIT mean for my EU funding? EU Environmental Funding Webinar
 
Invest Europe - Investor Forum Geneva 2019
Invest Europe - Investor Forum Geneva 2019Invest Europe - Investor Forum Geneva 2019
Invest Europe - Investor Forum Geneva 2019
 
Europe has never been better - 2019
Europe has never been better - 2019Europe has never been better - 2019
Europe has never been better - 2019
 
UNECA - Unleashing Africa’s Potential as a Pole of Global Growth
UNECA - Unleashing Africa’s Potential as a Pole of Global GrowthUNECA - Unleashing Africa’s Potential as a Pole of Global Growth
UNECA - Unleashing Africa’s Potential as a Pole of Global Growth
 
Golden Growth: Restoring the Lustre of the European Economic Model
Golden Growth: Restoring the Lustre of the European Economic ModelGolden Growth: Restoring the Lustre of the European Economic Model
Golden Growth: Restoring the Lustre of the European Economic Model
 
Technological universities as source of innovation seeram ramakrishna
Technological universities as source of innovation seeram ramakrishnaTechnological universities as source of innovation seeram ramakrishna
Technological universities as source of innovation seeram ramakrishna
 
European attractiveness-survey-2013
European attractiveness-survey-2013European attractiveness-survey-2013
European attractiveness-survey-2013
 
European attractiveness-survey-2013
European attractiveness-survey-2013European attractiveness-survey-2013
European attractiveness-survey-2013
 
Eurozone Crisis
Eurozone CrisisEurozone Crisis
Eurozone Crisis
 

Infographic Europe - Cradle of ABB

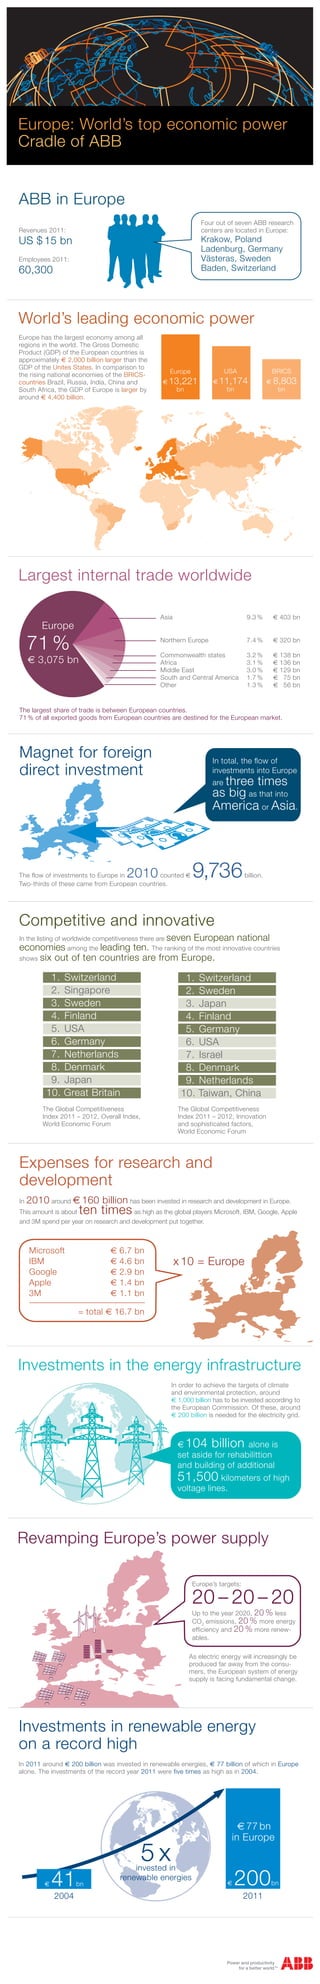
  • 1. Europe: World’s top economic power Cradle of ABB ABB in Europe Four out of seven ABB research Revenues 2011: centers are located in Europe: US $ 15 bn Krakow, Poland Ladenburg, Germany Employees 2011: Västeras, Sweden 60,300 Baden, Switzerland World’s leading economic power Europe has the largest economy among all regions in the world. The Gross Domestic Product (GDP) of the European countries is approximately E 2,000 billion larger than the GDP of the Unites States. In comparison to Europe USA BRICS the rising national economies of the BRICS- countries Brazil, Russia, India, China and E 13,221 E 11,174 E 8,803 South Africa, the GDP of Europe is larger by bn bn bn around E 4,400 billion. Largest internal trade worldwide Asia 9.3 % E 403 bn  Europe 71 % Northern Europe Commonwealth states 7.4 % 3.2 % E 320 bn E 138 bn E 3,075 bn Africa 3.1 % E 136 bn  Middle East 3.0 % E 129 bn  South and Central America 1.7 % E 75 bn  Other 1.3 % E 56 bn  The largest share of trade is between European countries. 71 % of all exported goods from European countries are destined for the European market. Magnet for foreign In total, the flow of direct investment investments into Europe three times are as big as that into America or Asia. The flow of investments to Europe in 2010 counted E Two-thirds of these came from European countries. 9,736 billion. Competitive and innovative In the listing of worldwide competitiveness there are seven European national economies among the leading ten. The ranking of the most innovative countries shows six out of ten countries are from Europe. 1. Switzerland 1. Switzerland 2. Singapore 2. Sweden 3. Sweden 3. Japan 4. Finland 4. Finland 5. USA 5. Germany 6. Germany 6. USA 7. Netherlands 7. Israel 8. Denmark 8. Denmark 9. Japan 9. Netherlands 10. Great Britain 10. Taiwan, China The Global Competitiveness The Global Competitiveness Index 2011 – 2012, Overall Index, Index 2011 – 2012, Innovation World Economic Forum and sophisticated factors, World Economic Forum Expenses for research and development In 2010 around E 160 billion has been invested in research and development in Europe. This amount is about ten times as high as the global players Microsoft, IBM, Google, Apple and 3M spend per year on research and development put together. Microsoft E 6.7 bn IBM E 4.6 bn x 10 = Europe Google E 2.9 bn Apple E 1.4 bn 3M E 1.1 bn = total E 16.7 bn Investments in the energy infrastructure In order to achieve the targets of climate and environmental protection, around E 1,000 billion has to be invested according to the European Commission. Of these, around E 200 billion is needed for the electricity grid. E 104 billion alone is set aside for rehabilittion and building of additional 51,500 kilometers of high voltage lines. Revamping Europe’s power supply Europe’s targets: 20 – 20 – 20 Up to the year 2020, 20 % less CO2 emissions, 20 % more energy efficiency and 20 % more renew- ables. As electric energy will increasingly be produced far away from the consu- mers, the European system of energy supply is facing fundamental change. Investments in renewable energy on a record high In 2011 around E 200 billion was invested in renewable energies, E 77 billion of which in Europe alone. The investments of the record year 2011 were five times as high as in 2004.  E 77 bn in Europe 5 x invested in E 41 bn renewable energies E 200 bn 2004 2011