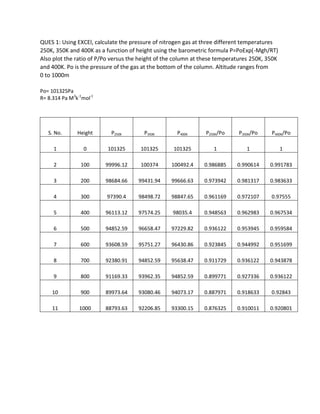
1. QUES 1: Using EXCEl, calculate the pressure of nitrogen gas at three different temperatures
250K, 350K and 400K as a function of height using the barometric formula P=PoExp(-Mgh/RT)
Also plot the ratio of P/Po versus the height of the column at these temperatures 250K, 350K
and 400K. Po is the pressure of the gas at the bottom of the column. Altitude ranges from
0 to 1000m
Po= 101325Pa
R= 8.314 Pa M3
k-1
mol-1
S. No. Height P250K P350K P400K P250K/Po P350K/Po P400K/Po
1 0 101325 101325 101325 1 1 1
2 100 99996.12 100374 100492.4 0.986885 0.990614 0.991783
3 200 98684.66 99431.94 99666.63 0.973942 0.981317 0.983633
4 300 97390.4 98498.72 98847.65 0.961169 0.972107 0.97555
5 400 96113.12 97574.25 98035.4 0.948563 0.962983 0.967534
6 500 94852.59 96658.47 97229.82 0.936122 0.953945 0.959584
7 600 93608.59 95751.27 96430.86 0.923845 0.944992 0.951699
8 700 92380.91 94852.59 95638.47 0.911729 0.936122 0.943878
9 800 91169.33 93962.35 94852.59 0.899771 0.927336 0.936122
10 900 89973.64 93080.46 94073.17 0.887971 0.918633 0.92843
11 1000 88793.63 92206.85 93300.15 0.876325 0.910011 0.920801
2. y = -9E-05x + 0.9994
0.9
0.92
0.94
0.96
0.98
1
1.02
0 200 400 600 800 1000 1200
P350K/Po
Height of the column
P350K/Po versus height
y = -0.0001x + 0.9988
0.86
0.88
0.9
0.92
0.94
0.96
0.98
1
1.02
0 200 400 600 800 1000 1200
P250K/Po
Height of the column
P250K/Po versus height
y = -8E-05x + 0.9995
0.9
0.92
0.94
0.96
0.98
1
1.02
0 200 400 600 800 1000 1200
P400K/Po
Height of the column
P400K/Po versus height
3. QUES 2: The following data represents variation of heat capacity at constant pressure (Cp) of Al2O3 as a function
of temperature i.e. Cp= a+Bt+Ct2
. using spreadsheet, plot Cp of and fit the data to polynomial of degree 2 to
determine the value of constants a,b,c.
S. No. T/K Cp(JK-1
mol-1
)
1 10 0.009
2 50 1.49
3 100 12.8
4 150 31.9
5 200 51.1
6 220 57.9
From the graph the values of the constants are -
a= -2.1726
b= 0.0638
c= 0.001
y = 0.001x2 + 0.0638x - 2.1726
-10
0
10
20
30
40
50
60
70
0 50 100 150 200 250
Cp(JK-1mol-1)
T/K
Cp(JK-1mol-1) versus T/K
4. QUES 3: Using spreadsheet, calculate the pressure of carbon dioxide gas (CO2) at
various volumes (from 0.05 to 0.5dm3
in steps of 0.05) assuming it to be van der waals gas
and plot P-V isotherm at 28K
a= 3.610 atm dm6
mol-2
b= 0.0429 dm3
mol-1
R= 0.0821 atm K-1
mol-1
S. No. Volume of (CO2) Pressure
1 0.05 1446.845
2 0.1 -1.54291
3 0.15 31.19888
4 0.2 40.39927
5 0.25 41.34671
6 0.3 39.72164
7 0.35 37.36552
8 0.4 34.9144
9 0.45 32.59043
10 0.5 30.46265
-200
0
200
400
600
800
1000
1200
1400
1600
0 0.1 0.2 0.3 0.4 0.5 0.6
Pressure
Volume of (CO2)
Pressure versus Volume of (CO2)
5. QUES 4: Using spreadsheet plot molar conductance λm vs c^.5.Fit the data to a straight line
using equation λm = λom - kπ and calculate λom
S. No. Concentration c1/2
(M1/2
) Molar Conductance /Sm2
mol-1
1 17.68 4.204759 42.45
2 10.8 3.286335 45.91
3 2.67 1.634013 51.81
4 1.28 1.131371 54.09
5 0.83 0.911043 55.78
6 0.19 0.43589 57.42
λom = 58.889
k= -3.9535
y = -3.9535x + 58.889
0
10
20
30
40
50
60
70
0 0.5 1 1.5 2 2.5 3 3.5 4 4.5
MolarConductance/Sm2mol-1
c1/2(M1/2)
Molar Conductance /Sm2 mol-1 versus c1/2(M1/2)
6. QUES 5 -Using spreadsheet plot fraction of molecules having velocities between 0-1200
in intervals of 100 at 400k versus velocities (maxwell distribution of molecular velocities )
for carbon monoxide gas
Given=
M=molecular mass
R=gas constant
T=temperature in kelvin
V=velocity
S.NO Velocity f(v)
1 0 0
2 100 0.000187
3 200 0.000659
4 300 0.001201
5 400 0.001591
6 500 0.001702
7 600 0.001542
8 700 0.001214
9 800 0.000843
10 900 0.000522
11 1000 0.00029
0
0.0002
0.0004
0.0006
0.0008
0.001
0.0012
0.0014
0.0016
0.0018
0 200 400 600 800 1000 1200
f(v)
Velocity
f(v) versus Velocity