

Empfohlen
Weitere ähnliche Inhalte
Was ist angesagt?
Was ist angesagt? (20)
Ähnlich wie PECs for Entrepreneurs
Ähnlich wie PECs for Entrepreneurs (20)
Mehr von FLORENCE FERNNADEZ
Mehr von FLORENCE FERNNADEZ (6)
Kürzlich hochgeladen
Kürzlich hochgeladen (20)
PECs for Entrepreneurs
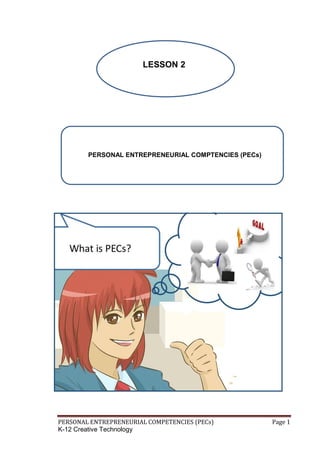
- 1. PERSONAL ENTREPRENEURIAL COMPETENCIES (PECs) Page 1 K-12 Creative Technology LESSON 2 PERSONAL ENTREPRENEURIAL COMPTENCIES (PECs)
- 2. PERSONAL ENTREPRENEURIAL COMPETENCIES (PECs) Page 2 K-12 Creative Technology At the end of the lesson, you are expected to do the following: LEARNING OUTCOME Learning Competency 2.1 Identify one’s PECs (characteristics, attributes, lifestyle, skills, & traits) suited for industry demands. Learning Competency 2.2 Do an oral presentation on the importance of PECs using productivity and presentation tools. Learning Competency 2.3 Use different dynamic computer applications and editing tools in making infographics on PECs.
- 3. PERSONAL ENTREPRENEURIAL COMPETENCIES (PECs) Page 3 K-12 Creative Technology LEARNING COMPETENCY 1.1 Identify one’s PECs (characteristics, attributes, lifestyle, skills, & traits) suited for industry demands. PERFORMANCE STANDARD The learner independently create different infographics showing the importance of strengthening one’s PECs ENTREPRENEUR - is an individual who organizes and operates a business/businesses COMPETENCY – is a breaking down into specific skills or tasks, each skill or task can be described in terms of specific behaviors and different levels of proficiency. ENTREPRENEURSHIP - is an act of creating a business or businesses while building and scaling it to generate a profit. ACHIEVEMENT CLUSTER – a PEC cluster that entrepreneurs possessed. These are people who accomplish things, they perform tasks excellently not for prestige or money but for the sake of excellence. PLANNING CLUSTER - a PEC cluster where entrepreneurs do not plunge into a business on the basis of inspiration but rather as the result of deliberate goal- setting tireless information-seeking, and systematic planning and monitoring. POWER CLUSTER – a PEC cluster where entrepreneurs’ personal motto is “I can”, he thinks that he can achieve things; he can convince people to his way of thinking; and he can influence the outcome of events. Definition of Terms
- 4. PERSONAL ENTREPRENEURIAL COMPETENCIES (PECs) Page 4 K-12 Creative Technology What Do You Already Know? Pre-test Directions: Read the statements carefully and state whether each statement is true or false. Write True if the statement is true and False if the statement is False. Write your answer in a separate sheet of paper. 1. Entrepreneurs are risk-takers. 2. To use business and personal contacts to accomplish our objectives is not a good attitude to develop. 3. A person who sticks to his judgment in the face of opposition or early lack of success is said to be persistent. 4. A person who uses deliberate strategies to influence or persuade others is said to exhibit the entrepreneurial characteristic called self-confidence. 5. Goal setting as a characteristic belongs to the planning cluster competency. 6. The PECs are classified under three major clusters. 7. It is enough that one sees new business opportunities to be called an opportunity-seeking individual. 8. A person that accepts job and take full responsibility and have the job done efficiently. 9. A successful entrepreneur does not demand quality standard. 10.It’s unimportant for an entrepreneur to seek feedback from his clients.
- 5. PERSONAL ENTREPRENEURIAL COMPETENCIES (PECs) Page 5 K-12 Creative Technology What Do You Need To Know? Entrepreneurship is not just a simple business activity but rather a strategic process of innovation and new venture of creating. It is both an art and science of converting business ideas into marketable products or services to improve the quality of living. It is what people do to take their career ad dreams into their own choice. It’s about building a life on your own terms. An entrepreneur is an individual who organizes and operates a business/businesses. They take great deal of financial risks to make their business succeed. An entrepreneur has the ability in handling the involvement of the total business operation from ideas to design and creation, from sales to operations and customer feedback. They choose whom to deal business with and what business they will venture. An entrepreneur is commonly seen as an innovator, a source of new ideas, goods, services and business/procedures. Competency among entrepreneurs plays a critical role in achieving excellent performance to ensure a continuous growth and success of a business amongst competitive enterprise environment. The entrepreneur is the one who shoulders both the risk and success of a business and the standard needed to carry on his business successfully is called his competency. To be able outline the attitude and behavior of Read Information Sheet 2.1 very well then find out how much you can remember and how much you learned by doing Self-Check 2.1 Information Sheet 2.1 Figure 2.2 Entrepreneur https://www.slideshare.net/100001106607777/personal- entrepreneurial-competencies-pecs Figure 2.3 What is PECs? https://www.youtube.com/watch Figure 2.1 Entrepreneurship https://www.slideshare.net/eivyportuguez/personal- entrepreneurial-competencies-pecs
- 6. PERSONAL ENTREPRENEURIAL COMPETENCIES (PECs) Page 6 K-12 Creative Technology entrepreneurs, a set of qualities has been created and developed by a behavioral scientist and is collectively called as Personal Entrepreneurial Competencies (PECs). A lot of studies have been made to characterize entrepreneurial personalities and even though there is no particular set of traits that can assure success, some identified behaviors are found common in most successful entrepreneurs. A well-known research on human behavior is done by McClelland and McBer and is able to identify 10 behavioral patterns grouped into three general clusters: the achievement, planning and power clusters. The entrepreneurial qualities, more known as the Personal Entrepreneurial Competencies (PECs) are as follows: 1. Opportunity Seeking 2. Persistence 3. Commitment to Work Contract 4. Risk-taking 5. Demand for Efficiency and Quality 6. Goad Setting 7. Information Seeking 8. Systematic Planning and Monitoring 9. Persuasion and Networking 10.Self-Confidence ACHIEVEMENT CLUSTER OPPORTUNITY SEEKING is being active in finding openings in the environment which can be used in different ways to start a business, to create a new market or to improve business operations. Opportunity seeking is what enables an entrepreneur to act and grab new business opportunities even in the most problematic and hopeless situations. PERSISTENCE is doing something continuously even though other people say that you will not succeed or that you are just wasting your time and effort. It is doing something over and over again until you get what you think you deserve. It means standing up straight and not giving up even during the hardest times when you are trying to do something new or something difficult. Opportunity Seeking https://www.academia.edu/30955388/PERSON AL_ENTREPRENEURIAL_COMPETENCIES Persistence https://www.academia.edu/30955388/PERSON AL_ENTREPRENEURIAL_COMPETENCIES
- 7. PERSONAL ENTREPRENEURIAL COMPETENCIES (PECs) Page 7 K-12 Creative Technology COMMITMENT TO WORK CONTRACT is the state of giving much time and attention to something because you believe it is right and important. Commitment comes with a personal value, it is what a person truly believes and considered very important. In terms of being committed to work, once a person accepts a job, he should agree to take full responsibility and have the job done efficiently to create a delighted customer. Commitment is being able to meet the deadline. RISK-TAKING means taking the chances to do something which is out of your comfort zone. It may also imply doing something that can result in anything unpleasant or dangerous. The three kinds of risk-taking behaviors are as follows: a. High risk-taking is doing something risky without even checking what are the possible results of such action and without calculating the probable losses that may be incurred after the action has been taken. b. Low risk-taking is almost as not taking risk or avoiding anything difficult or anything which may have unpleasant or dangerous results. c. Moderate risk-taking is carefully calculating all the chances before doing something difficult or something which may have unpleasant or dangerous results, thus reduces possible negative results by making the most out of the positive possibilities. DEMAND FOR EFFICIENCY and QUALITY is a good entrepreneur demands quality and efficiency not only from himself but also from her workers and suppliers. A successful entrepreneur demands quality standards and cannot stand a bad performance from people he is working with. Quality is the standard that customers seek when buying a product or receiving a service. Efficiency is the ability of an entrepreneur and its staffs to work well without error or without wasting time, money and energy. Having demands for efficiency and quality is a normal occurrence in any business. They often set a high standard of excellence to fulfill the needs of the customers. Commitment https://www.slideshare.net/eivyportugue z/personal-entrepreneurial- competencies-pecs Risk-taking https://www.academia.edu/30955388/PERSON AL_ENTREPRENEURIAL_COMPETENCIES Demand for efficiency and quality slideshare.net/fbuiza/personal-13280748
- 8. PERSONAL ENTREPRENEURIAL COMPETENCIES (PECs) Page 8 K-12 Creative Technology PLANNING CLUSTER INFORMATION SEEKING is the behavior of gathering information from relevant sources. Information-seeking means an entrepreneur must always be ready to seek useful information from persons related to his business including clients, suppliers, and competitors through contacts or information networks. An entrepreneur must also be open to the idea of expert consultation for business and technical assistance. Feedback is important to the entrepreneur; he seeks direct response for his performance and only acknowledges accurate and relevant data on the information he gets. Entrepreneurs often deal with a variety of changes, take notes on any management weaknesses and try to find immediate feedback on their performance (Calvin, 2008). An entrepreneur is a GOAL ORIENTED individual who knows how to set specific, measurable, attainable, realistic and time-bound (SMART) goals. He plans his every action and carefully makes decisions based on where he wants to go. He is competitive in a positive way and loves the idea of winning through hard work and perseverance. SYSTEMATIC PLANNING AND MONITORING: Entrepreneurs who develop and use logical, step-by-step plans to reach their goals. He plans by breaking large tasks down into small one and puts time limits against them. They monitor progress towards goals and to alter strategies when necessary. POWER CLUSTER PERSUASION AND NETWORKING: Entrepreneurs know how to use the right strategies to influence or persuade other people. It’s something that helps you connect with the people around you. They’re respected, well-liked and able to talk about their accomplishments, goals and ideas in a way that gets those around them excited and passionate as well. Goal Oriented https://www.academia.edu/30955388/PERSON AL_ENTREPRENEURIAL_COMPETENCIES Persuasion and Networking https://www.academia.edu/30955388/PERSONAL_ENTRE PRENEURIAL_COMPETENCIES Information Seeking https://www.academia.edu/30955388/PERSON AL_ENTREPRENEURIAL_COMPETENCIES Systematic planning and monitoring https://www.slideshare.net/fbuiza/personal- 13280748
- 9. PERSONAL ENTREPRENEURIAL COMPETENCIES (PECs) Page 9 K-12 Creative Technology Information Sheet 1.1 An entrepreneur is a SELF-CONFIDENCE in a person who have a strong faith in his ability inspite of the problems the will be encountered along the way. He trusts his own skills and embraces his own imperfections. His self-awareness and faith in his personal ability makes it easier for him to complete any task or activity. How Much Have You Learned? Self Check 2.1 Directions: Choose from the list in column B, the PEC that fits the descriptions of each statement. Write the letter only in a separate sheet of paper. Column A Column B 1. An entrepreneur that cannot stand a bad performance from people he is working with. a. Opportunity- seeking 2. An entrepreneur who set specific, measurable, attainable, realistic and time- bound goals. b. Persistence 3. An entrepreneur who break down tasks into small one and puts time limits against them. c. Commitment to the work contract 4. An entrepreneur who acts and grab new business opportunities even in a most problematic situation. d. Demand for quality and efficiency 5. An entrepreneur who risks without even checking what are the possible results will be. e. Risk-taking 6. An entrepreneur who knows how to use the right strategies to influence or persuade other people. f. Goal-setting 7. An entrepreneur who have a strong faith in his ability inspite of the problems he will encounter along the way. g. Information- seeking 8. An entrepreneur who develop and use logical step-by-step plans to reach his goals. h. Systematic planning and monitoring 9. An entrepreneur whose feedback from clients are very important. i. Persuasion and networking 10.An entrepreneur who demands quality standard and cannot stand a bad performance from people he is working with. j. Self-confidence Refer to the Answer Key. What is your score? Self-Confidence https://www.shutterstock.com/video/clip-29722075- confidence-arrow-rising-trend-3d-animation
- 10. PERSONAL ENTREPRENEURIAL COMPETENCIES (PECs) Page 10 K-12 Creative Technology LEARNING OUTCOME 2.2 Do an oral presentation on the importance of PECs using productivity and presentation tools. PERFORMANCE STANDARD The learner independently create different infographics showing the importance of strengthening one’s PECs Definition of Terms Cut – is a command that allows you to cut out a selection of text or other data and save it to the clipboard. Copy - refers to duplicating a section of a document and placing it in a clipboard. Save is the process of writing data to a storage medium such as a floppy disk, USB flash drive or hard drive. Slides is a single page or image shown in a slideshow.
- 11. PERSONAL ENTREPRENEURIAL COMPETENCIES (PECs) Page 11 K-12 Creative Technology Information Sheet 2.2 PowerPoint helps us to think of each projected page as a “slide” in a slideshow. But just as someone else’s home movies can be thoroughly uninteresting if they’re grainy, poor in quality, and irrelevant. PowerPoint Slides that are too flashy, cluttered, meaningless or poorly designed can quickly turn a darkened room full or smart people into a mere gathering of snoozers. As you design your slides, consider these factors: Templates: Eventhough PowerPoint helps you design your slides, don’t assume that someone else’s template will always match your needs. Take charge of slide design by considering first the most efficient way to transmit the necessary information. Simplicity: Keep slides as simple and uncluttered as possible, and if the information must be complex, prioritize it for audience as you present it (for example: if presenting a ten-column table, direct your audience to the most significant columns). Offer only one major point per illustration. Titles: Gives most slides titles, with a font size at least 36 points, and body text with a font size of at least 24 points. If you need to cite a source of information, include the citation in a smaller font size at the bottom of your slide. Rule of 8s. Apply the “rule of 8”. This include no more than 8 words per line and 8 lines per slide. Bullets: When using bulleted lists in slides, present each bulleted line in parallel fashion – example: if the first line is a fragment, the others should be as well; if the first line opens with a verb, so should the others. Design: Design slides so that their longest dimension is horizontal rather than vertical. Use both uppercase and lowercase letters and orient pictures left to right. Avoid the overuse of animations and transitions which can be distracting and downright silly. Color: Make sure the color for both the background and text are highly readable, especially under less than optimal lighting conditions. Images: When possible, replace words with images. Use images in particular when presenting data, demonstrating trends, simplifying complex issues and visualizing abstractions. Spelling: Spelling does count, and you can’t rely on PowerPoint to be an effective proofreader. What Do You Need To Know? Read Information Sheet 2.2 very well then find out how much you can remember and how much you learned by doing Self-Check 2.2
- 12. PERSONAL ENTREPRENEURIAL COMPETENCIES (PECs) Page 12 K-12 Creative Technology Microsoft PowerPoint 2010 is a full-featured presentation program that helps you quickly and efficiently develop dynamic, professional-looking presentations and then deliver them to an audience. Appearance of Microsoft PowerPoint After opening Microsoft PowerPoint, you will be taken to a blank presentation and see the following screen. The default view in Microsoft PowerPoint 2010 is Normal, displaying the presentation in a view that allows you to see a preview of all slides available along the left, the slide work area (main portion of screen), and the notes area associated with a slide along the bottom. The view can be changed by selecting the View Tab on the ribbon and selecting one of the other Layout options from the Presentation Views logical group. You can also change the Presentation View by clicking the view icons beside the Zoom Slider Creating a New Presentation To begin a new presentation, click the file tab and then click New. The New Presentation Window will appear, giving you various options to create a new presentation.
- 13. PERSONAL ENTREPRENEURIAL COMPETENCIES (PECs) Page 13 K-12 Creative Technology You can start from a blank presentation by selecting Blank Presentation (this is selected by default) and then click Create. You can also create a new presentation from a pre-existing template in one of the categories under the Office.com Templates section. Opening a Presentation Opening an existing presentation, click the File tab and then click Open. The open window will appear. Select the location where you saved the file, then click the file name from the list and click the Open button. You can also double click on the file from the list to open the presentation. Saving a Presentation To save a presentation, click the File tab and then click Save. If this is a new presentation that you are saving for the first time, the Save As dialog box will open up. Select the location where you would like to be saved, enter a File name and then click the Save button. The default file format is the PowerPoint Presentation (*.pptx) file format. This format ensures that all presentation formatting is saved and will be available the next time the file is opened. If you have previously saved the presentation, clicking Save under the File Tab will save changes to the existing file. If you prefer to have your changes saved to different file, click the File tab and then click Save As.
- 14. PERSONAL ENTREPRENEURIAL COMPETENCIES (PECs) Page 14 K-12 Creative Technology Home Tab – Styling your Presentation The Home tab can be used to style your presentation, including the formatting of fonts and paragraphs. Font formatting Highlight the text you want to format and then select the font, size, style and color under the Font group. For additional font options, click the Show Font Dialog Box icon. Cut/Paste Text Highlight the text you wish to move, click on Cut under the Clipboard group, move your cursor to the desired location, and click on Paste under the Clipboard group. Copy/Paste Text Highlight the text you wish to copy, click on Copy under the Clipboard group, move your cursor to the desired location and click on Paste under the Clipboard group. Paragraph Formatting Paragraph formatting options are available under the Paragraph group. The following options are available from the Paragraph group: Bullets and numbered lists Indentations, sorting and line spacing Alignment Text direction, align text(vertically), and convert to SmartArt For additional paragraph formatting options, click the Show Paragraph Dialog Box icon.
- 15. PERSONAL ENTREPRENEURIAL COMPETENCIES (PECs) Page 15 K-12 Creative Technology Working with Slides New presentations will be created with one slide. To add an additional slide, click New Slide under the Slides group. To remove a slide, highlight the slide you wish to remove and click Cut under the Clipboard group. To change the layout of a slide, click Layout under the Slides group and select the desired layout type. Drawing The Drawing Group offers tools for adding hand drawn objects to presentation, such as lines, rectangles, triangles, ovals, arrows and other shapes. Select the shape from the Drawing group and then draw the shape in the presentation. In Insert Tab this can be used to insert various types of object, including tables, images, illustrations, links, text, symbols and media. Headers and Footers
- 16. PERSONAL ENTREPRENEURIAL COMPETENCIES (PECs) Page 16 K-12 Creative Technology To have a consistent footer on each slide of a presentation, click on Header & Footer from the Text group and then select the footer components that you want included. These components include Date and Time, Slide number and customized text(Footer). The option can also be set to not show the footer on the title slide. To have a consistent header and footer on each notes or handouts page of a presentation, click on Header & Footer from the Text group, click the Notes and Handouts tab and then select the header and footer components that you want included. Components include Date and time, customized text (Header), Page Number, and customized text (Footer). Symbols Symbols that aren’t found on a normal keyboard can be added to Microsoft PowerPoint presentations by selecting a text area and pressing either the Equation or Symbols group. Media Clips To insert a video clip, click Video under the Media group and then select Video from File if you have a video file you would like to use or Clip Art Video if you would like to use a clip from the Microsoft collection. Audio Clips To insert an audio clip, click Audio under the Media group and then select Audio from File if you have an audio file you would like to use or Clip Art Audio if you would like to use a clip from the Microsoft collection. If you have a microphone connected to your computer you can also select Record Audio to record your own audio. Tables To create a table, click the Table icon from the Tables group and then select the number of cells you want. The example at the right has a table that is 6 cells wide by 5 cells high. If you need a table that is larger than 10 cells wide by 8 cells high, click Insert Table. The Insert Table window will open up. From here, the number of columns and rows can be specified. Pictures
- 17. PERSONAL ENTREPRENEURIAL COMPETENCIES (PECs) Page 17 K-12 Creative Technology Place your cursor where the picture is to be inserted and then select Picture from the Images group. Navigate to the directory where the picture is located, click the file name and then click the Insert button. See the Picture Tools Format Tab. Links Links to websites or other locations within a PowerPoint presentation can be created by using the Links group. To include a link to a website, select Hyperlink from the Links group. Enter the text that should be displayed in the presentation in the Text to display: text box and the web site address in the Address: text box and then click OK. The Design Tab is used to set slide layout options for a PowerPoint presentation. Page Setup The Page Setup group contains the options to specify the slide size and orientation. Click Page Setup under the Page Setup group to make changes to your slide size and orientation. To only change the page orientation of your presentation, click Slide Orientation under the Page Setup group and then select Portrait or Landscape.
- 18. PERSONAL ENTREPRENEURIAL COMPETENCIES (PECs) Page 18 K-12 Creative Technology Themes To set a theme for your presentation, select the theme you wish to use under the Themes group. For additional themes, select the More icon under the Themes group. More themes will be shown along with an option to download more themes form the Microsoft Office Online site. The theme colors, fonts, and effects can be changed by using the options to the right of the themes. Transition Tab is used to add transitions to the slides within the presentation. Transitions To set a transition between your slides, highlight the slides you want the transition applied to and then select the transition under the Transition to This Slide group. In the example to the right, the first and second slides have been selected and would have the same transition applied. For additional transitions, select the More icon under the Transitions to This Slide group. A transition sound and the speed of the transition can also be set from options within the Timing group.
- 19. PERSONAL ENTREPRENEURIAL COMPETENCIES (PECs) Page 19 K-12 Creative Technology Animations Tab can be used to add animation to the slides within the presentation. Animations To add animations for the objects on a slide, select the object and then select the animation that you would like applied from the Animation group. For additional animations, select the More icon under the Animation group. PowerPoint also gives you the option to setup a customized animation to specify exactly how you want an animation to appear. This option will allow you to add an effect and then specify when the effect should start, what direction it will use, and how fast it will run. Slide Show Tab is used for setting up and starting a slide show in presentation mode. Start Slide Show You can choose to start your slide show from the beginning of the presentation, from the current slide that is in focus, or a customized slide show can be setup to allow slides to appear in a certain order throughout the show. Set Up The Set Up group provides options for setting up your slide show for different purposes, such as a presentation by a speaker, browsing by an individual, or automatically run at a kiosk. You can also add narrations and timing for slides to automatically advance.
- 20. PERSONAL ENTREPRENEURIAL COMPETENCIES (PECs) Page 20 K-12 Creative Technology Monitors The Monitors group provides options for how you want the show to appear on the monitor, including the resolution to be used, which screen the presentation should be displayed on if using two monitors( a laptop and projector) with the 2nd in extended display mode instead of mirrored mode, and the option to show the presentation in presenter view if using the two monitors option in extended display mode. The presenter view can be useful as it will display the slide that is currently being presented along with the notes for the slide to the right, all of the slides in the presentation along the bottom, and a clock to show you how long you have been presenting for. The Review Tab is used to review your presentation, including proofing the presentation, adding comments, and comparing presentation files. Proofing The Proofing Group assists with proofing your presentation after it is finished. Click the Spelling icon to check for spelling problems within the presentation. Click the Thesaurus icon to open the Microsoft Thesaurus. If you highlight a word and then click the Thesaurus icon, the thesaurus will automatically look up the highlighted word. Language Click the Translate icon to translate your presentation form one language to another. Click the Language icon to set the language that will proof your presentation.
- 21. PERSONAL ENTREPRENEURIAL COMPETENCIES (PECs) Page 21 K-12 Creative Technology Comments To insert a comment in a presentation, highlight the text you want commented and then click New Comment under the Comments group. A comment box will appear to the right of your presentation where you can enter the comment. To remove the comment, click the comment box and then click Delete under the Comments group. Compare The compare group allows comparing the changes in the current presentation against another presentation. To select the presentation file to compare against, click the Compare icon and locate the file to compare, highlight it, and click the Merge button. The review pane will now open on the right side of the window. Under the Slides tab, a list of changes, if any, will be described. Accepting or rejecting changes can be done by clicking their respective button in the Compare group. In order to save any changes made, click the End Review button in the Compare group and click continue. The View Tab is used to set how you want your presentation to be viewed while you are working on it. Presentation Views Normal Switches to normal view, where you can work on one slide at a time or organize the structure of all slides in your presentation. Slide Sorter This view displays miniature versions of all slides in a presentation, complete with text and graphics. In slide sorter view, you can reorder slides, add transitions, and add animation effects. You can also set the timings for electronic slide shows. Notes Page Switches to notes view, where a smaller version of the slide will display and a larger notes area will allow you to enter additional notes for the slide. Reading View This view runs the presentation in a full-screen presentation mode, beginning with the current slide if you are in normal view or the selected slide if you are in slide sorter view.
- 22. PERSONAL ENTREPRENEURIAL COMPETENCIES (PECs) Page 22 K-12 Creative Technology Show The Show group allows different components of PowerPoint to be displayed, including the ruler, gridlines and guides. Zoom With the Zoom group, the zoom level of the presentation can be set. To change you zoom level, click the Zoom icon under the Zoom group. Window If you are working with multiple PowerPoint presentations, you can switch between them by clicking the Switch Windows icon under the Window group. Drawing Tools Format Tab can be used to make changes to objects that are hand-drawn in Microsoft PowerPoint presentations. Drawing Formatting To add more shapes to a side, select the shape from the Insert Shapes group and draw it on the slide until it reaches the desired size. To change the shape of an object, select the object, select Edit Shape, click Shape and select the desired shape that you would like the object to become. Use the options under the Shape Styles group to make changes to the properties of drawn objects, such as the shape style, fill, outline, and effects. To insert WordArt in a slide, Click Text Box under the Insert Shapes group and then draw a text box on the screen. After the text has been inserted, you can highlight it and apply formatting to the WordArt by using the options under the WordArt Styles group. Picture Tools Format Tab can be used to make changes to pictures that are added to Microsoft PowerPoint presentations. Picture Formatting Use the options under the Adjust group to make changes to the properties of pictures, such as brightness, contrast, and color. Use the options under the Picture Styles group to select a pre-defined style for your picture or manually set the picture shape, border, and effects. Use the options under the Arrange group to set text wrapping around the picture, rotate the picture, and position & align the picture. Use the options under the Size group to crop the picture to trim unwanted parts and resize the picture.
- 23. PERSONAL ENTREPRENEURIAL COMPETENCIES (PECs) Page 23 K-12 Creative Technology How Much Have You Learned? Self-Check 2.2 Activity 1 Read and answer the following questions: 1. How do you open the MS PowerPoint? ______________________________________________________ ______________________________________________________ ______________________________________________________ 2. How to save your PowerPoint Presentation? ___________________________________________________ ___________________________________________________ ___________________________________________________ Activity 2 Make an oral presentation on the importance of PECs using PowerPoint Presentation. How Well Did You Perform? Find out by accomplishing the Scoring Rubric honestly and sincerely, remember it is your learning stake! CRITERIA 10 POINTS 6 POINTS 3 POINTS Accuracy The output is accurately done without any help from the teacher. The output is done with a minimum supervision from the teacher The output is done with utmost supervision from the teacher. Presentation The output is properly laid-out and very satisfactorily presented. The output is laid out and satisfactorily presented. The output is satisfactorily presented with the supervision from the teacher. Creativity The use of own idea and imagination is applied without any help from the teacher. The use of own idea and imagination is applied with minimum supervision from the teacher. The use of own idea and imagination is applied with supervision from the teacher.
- 24. PERSONAL ENTREPRENEURIAL COMPETENCIES (PECs) Page 24 K-12 Creative Technology Neatness The output is presented in a neat, clear, and organized fashion. The output is presented in a neat and clear fashion. The work appears sloppy and unorganized. Completion The output is completed on or before the deadline. The output is completed after the deadline The output is completed after 1 week from deadline. POINTS EARNED NUMERICAL DESCRIPTIVE 45-50 90-100 VERY GOOD 30-44 86-90 GOOD 20-29 81-85 FAIR 1-19 75-80 NEEDS IMPROVEMENT
- 25. PERSONAL ENTREPRENEURIAL COMPETENCIES (PECs) Page 25 K-12 Creative Technology LEARNING COMPETENCY 2.3 Use different dynamic computer applications and editing tools in making infographics on PECs. PERFORMANCE STANDARD The learner independently create different infographics showing the importance of strengthening one’s PECs Infographics – is a visualization of data or ideas that tries to convey complex information to an audience in a manner that can be quickly consumed and easily understood. SmartArt graphic – is a way to turn ordinary text into something more visually appealing, make information easier to interpret and understand and can be used to create organizational chart, a decision tree, a pyramid or matrix structure, illustrate steps in a process or display events in a timeline. Definition of Terms
- 26. PERSONAL ENTREPRENEURIAL COMPETENCIES (PECs) Page 26 K-12 Creative Technology What Do You Need To Know? Information Sheet 2.3 What is an Infographics? Infographics is defined as a visualization of data or ideas that tries to convey complex information to an audience in a manner that can be quickly consumed and easily understood (Smiciklas, 2012). Infographics are essentially visual representations of information. They are used to tell stories, convey ideas or explore issues through a range of different graphics. The use of infographics and other data visualizations have become increasingly popular in the mainstream media as well as blogs, personal websites and social media. They can be a useful mechanism to display information in visual manner. There are many different ways you can create these images, some of which use specialist software while others make more creative use of software you may already frequently use like Microsoft Word and Microsoft PowerPoint. “The key to making information visual is to first have good information..”Alberto Cairo To make an effective infographic should be well-designed, supported by data and tell a story. Infographics are created for different purposes so whatever the purpose of the infographic the following lists should be considered: 1. It tells a Story An effective infographic not only conveys valuable information in a convincing manner, it also narrates a story worth telling. Read Information Sheet 2.3 very well then find out how much you can remember and how much you learned by doing Self-Check 2.3 Figure 2. It tells a Story https://www.visme.co/wp-content/uploads
- 27. PERSONAL ENTREPRENEURIAL COMPETENCIES (PECs) Page 27 K-12 Creative Technology 2. It takes your eyes on a Predefined Journey The mark of a good infographics is its effectiveness in communication a message. The example uses everything at its disposal-from a harmonious color combination with effective contrast to a clear storyline. 3. It is Well Structured Organize your infographic into sections so it is easier to read and scan. The example is neatly divided into sections, making it extremely easy to understand and digest the information presented 4. It sends one Key Message The most effective infographics implement everything at their disposal- including design elements and text- to send one key message. One way to gauge whether your infographic meets this criterion is to ask someone who wasn’t involved in the creation process to explain it to you. 5. It is visually Appealing Whether it’s a new website you’re launching or a series of charts and graphs, presentation matters and, when used effectively, can make your content all the more effective. Figure 2. A Pre-defined Journey https://www.visme.co/wp-content/uploads Figure 2. Well Structured https://www.visme.co/wp-content/uploads Figure 2. Key Message https://www.visme.co/wp-content/uploads Figure 2. Visually Appealing https://www.visme.co/wp-content/uploads
- 28. PERSONAL ENTREPRENEURIAL COMPETENCIES (PECs) Page 28 K-12 Creative Technology 6. Use your Data Effectively Handle information responsibly and give useful tips based on wide agreed-upon facts. There are no rules for making infographics and there is no set formula for a successful infographic as it will depend on the content, purpose and design of the infographic. As you begin to make infographics you will develop your own style, you will realize the kind of designs that you like and are happy to work with, and others that you don’t. If you are new to making infographics start with something small and simple and over time add in more features and design idea as you develop your skills. 10 Top Tips for Creating Infographics 1. Sketch out a draft storyboard on paper before creating your digital design. 2. Be clear – have a title that is likely to grab your audience. 3. Be concise – restrict the amount of ideas you are going to include. 4. Try to use different graphics to tell your story. 5. Limit your colour palette to keep the design simple. 6. Limit the amount of font styles used. 7. Try not to use too much text. 8. Only use data relevant to your infographic 9. Use simple graphics and icons that relate to your data. 10.If you have a lot of information to convey consider breaking the infographic into sections. There are a lot of online infographic design platforms, some of which use specialist software while others make more creative use of software you may already frequently use like Microsoft Word and Microsoft PowerPoint. Steps to make Infographics design in Microsoft Word: 1. Open Up A New Document The first step is opening up a new document in Word. You can use the regular A4 template or go for something else that fits what you are going for in a better way. There are a few templates that can be used for infographics such as the brochure or certificate templates. 2. Find the Insert Tab Find the insert tab and click on it in the top right toolbar. This is where you can insert a variety of different shapes, graphs, and pictures into your document. After you have clicked the insert tab. Click on the different Figure 2. Use data Effectively https://www.visme.co/wp-content/uploads
- 29. PERSONAL ENTREPRENEURIAL COMPETENCIES (PECs) Page 29 K-12 Creative Technology commands to find something that works for you. But checking on the SmartArt tab is recommended. 3. Smart Art In SmartArt you can find all sorts of different artwork that is made up of text boxes and shapes to give you the best of both worlds and save you a massive headache. You can find pretty much anything to spice up your data in this section of Word. Below is an example of a quick layout using SmartArt. Figure 2.1 https://infographicsite.com/articles/how-to-make-an-infographic-in-word
- 30. PERSONAL ENTREPRENEURIAL COMPETENCIES (PECs) Page 30 K-12 Creative Technology 4. Chart & Graphs Word can help you insert lots of different charts and graphs into your infographic. Just simply click on the “Charts” option under Insert to bring up this menu. Then choose which chart you would like to insert into your graphic. Word supplies you with different options to choose from such as bar graphs, pie charts, stock market charts, and combo charts. Visualize your data properly throughout your graphic with these effective but simple charts. Microsoft Word also has SmartArt options for relationship charts, pyramids, and more to help you visualize almost every kind of data.
- 31. PERSONAL ENTREPRENEURIAL COMPETENCIES (PECs) Page 31 K-12 Creative Technology How to Create Infographics using Microsoft Powerpoint: 1. Open Microsoft PowerPoint and start with a new slide, then change slide orientation to Portrait. 2. Change the size of the slide to better fit in a blog post – 6” wide, 11 or 12” height. 3. Start creating your infographic by clicking the Insert tab then use the commands in this tab such as SmartArt, Shapes, Chart, WordArt and etc.
- 32. PERSONAL ENTREPRENEURIAL COMPETENCIES (PECs) Page 32 K-12 Creative Technology 4. Click Design Tab to choose Themes that fits your infographic. 5. After choosing which Theme you prefer, save your infograph as PDF. 6. When the file is already saved as PDF, it will open to a new window, change view to what is shown below. Then, change the size so that you can see the entire infographic on one page and the Print Screen.
- 33. PERSONAL ENTREPRENEURIAL COMPETENCIES (PECs) Page 33 K-12 Creative Technology __ How Much Have You Learned? Self-Check 2.3 Activity 1 Read and answer the following questions: 1. What is Infographics? ______________________________________________________ ______________________________________________________ ______________________________________________________ 2. What are the two frequently used productivity tool that can be used to create infographics? ___________________________________________________ ___________________________________________________ 3. What the key points that you should consider in creating an infographic? ___________________________________________________ ___________________________________________________ ___________________________________________________ Activity 2 Directions: Create an effective infographics on PECs using Microsoft Word. Make it well-designed. Activity 3 Directions: Create an effective infographics on PECs using Microsoft PowerPoint. Make it well-designed. How Well Did You Perform? Find out by accomplishing the Scoring Rubric honestly and sincerely, remember it is your learning stake! CRITERIA 10 POINTS 6 POINTS 3 POINTS Accuracy The output is accurately done without any help from the teacher. The output is done with a minimum supervision from the teacher The output is done with utmost supervision from the teacher. Presentation The output is properly laid-out and very The output is laid out and satisfactorily presented. The output is satisfactorily presented with
- 34. PERSONAL ENTREPRENEURIAL COMPETENCIES (PECs) Page 34 K-12 Creative Technology satisfactorily presented. the supervision from the teacher. Creativity The use of own idea and imagination is applied without any help from the teacher. The use of own idea and imagination is applied with minimum supervision from the teacher. The use of own idea and imagination is applied with supervision from the teacher. Neatness The output is presented in a neat, clear, and organized fashion. The output is presented in a neat and clear fashion. The work appears sloppy and unorganized. Completion The output is completed on or before the deadline. The output is completed after the deadline The output is completed after 1 week from deadline. REFERENCES LESSON 2 www.slideshare.net/fbuiza/personal https://visme.co/blog/tools-to-create-infographics https://infographicsite.com/articles/how-to-make-an- infographic-in-word https://www.slideshare.net/kimberlygauthier/creating- infographics-with-ms-power-point