Bc Homes Sales Edge Lower in July 2011
•
0 gefällt mir•397 views

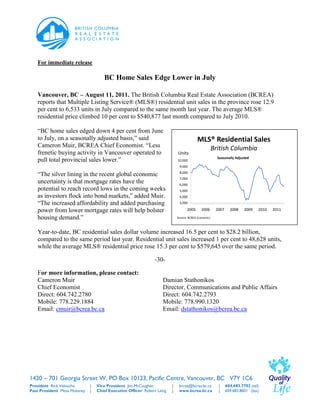
Vancouver, BC – August 11, 2011. The British Columbia Real Estate Association (BCREA) reports that Multiple Listing Service® (MLS®) residential unit sales in the province rose 12.9 per cent to 6,533 units in July compared to the same month last year. The average MLS® residential price climbed 10 per cent to 540,877 last month compared to July 2010.

Empfohlen
Empfohlen
Weitere ähnliche Inhalte
Was ist angesagt?
Was ist angesagt? (13)
Andere mochten auch
Andere mochten auch (20)
Ähnlich wie Bc Homes Sales Edge Lower in July 2011
Ähnlich wie Bc Homes Sales Edge Lower in July 2011 (20)
Mehr von Matt Collinge
Mehr von Matt Collinge (15)
Kürzlich hochgeladen
Kürzlich hochgeladen (20)
Bc Homes Sales Edge Lower in July 2011
- 1. For immediate release BC Home Sales Edge Lower in July Vancouver, BC – August 11, 2011. The British Columbia Real Estate Association (BCREA) reports that Multiple Listing Service® (MLS®) residential unit sales in the province rose 12.9 per cent to 6,533 units in July compared to the same month last year. The average MLS® residential price climbed 10 per cent to $540,877 last month compared to July 2010. “BC home sales edged down 4 per cent from June to July, on a seasonally adjusted basis,” said MLS® Residential Sales Cameron Muir, BCREA Chief Economist. “Less British Columbia frenetic buying activity in Vancouver operated to Units pull total provincial sales lower.” 10,000 Seasonally Adjusted 9,000 “The silver lining in the recent global economic 8,000 7,000 uncertainty is that mortgage rates have the 6,000 potential to reach record lows in the coming weeks 5,000 as investors flock into bond markets,” added Muir. 4,000 “The increased affordability and added purchasing 3,000 power from lower mortgage rates will help bolster 2005 2006 2007 2008 2009 2010 2011 housing demand.” Source: BCREA Economics Year-to-date, BC residential sales dollar volume increased 16.5 per cent to $28.2 billion, compared to the same period last year. Residential unit sales increased 1 per cent to 48,628 units, while the average MLS® residential price rose 15.3 per cent to $579,645 over the same period. -30- For more information, please contact: Cameron Muir Damian Stathonikos Chief Economist Director, Communications and Public Affairs Direct: 604.742.2780 Direct: 604.742.2793 Mobile: 778.229.1884 Mobile: 778.990.1320 Email: cmuir@bcrea.bc.ca Email: dstathonikos@bcrea.bc.ca 1420 – 701 Georgia Street W, PO Box 10123, Pacific Centre, Vancouver, BC V7Y 1C6 President Rick Valouche | Vice President Jim McCaughan | bcrea@bcrea.bc.ca | 604.683.7702 (tel) Past President Moss Moloney | Chief Executive Officer Robert Laing | www.bcrea.bc.ca | 604.683.8601 (fax)
- 2. BC Home Sales Edge Lower in July . . . Page 2 July 2011 Residential Average Price, Active Listings and Sales-to-Active-Listings Data by Board Average Price Active Listings Sales-to-Active-Listings July 2011 July 2010 July 2011 July 2010 July 2011 July 2010 Residential Residential Residential Residential Board Residential Residential % change % Active Active Sales to Active Sales to Active Average Price Average Price change Listings Listings Listings Listings ($) ($) (Units) (Units) (%) (%) BC Northern 226,359 211,542 7.0 3,366 3,330 1.1 11.1 10.2 Chilliwack 308,081 306,338 0.6 1,904 1,704 11.7 9.4 8.5 Fraser Valley 503,931 459,361 9.7 8,417 8,996 -6.4 14.9 11.5 Greater Vancouver 761,673 657,815 15.8 16,280 17,591 -7.5 16.1 13.1 Kamloops 287,005 310,740 -7.6 2,369 2,390 -0.9 7.9 7.9 Kootenay 292,899 269,931 8.5 3,609 3,440 4.9 5.0 4.9 Okanagan Mainline 408,035 406,072 0.5 7,001 7,257 -3.5 6.8 4.8 Powell River 243,439 219,729 10.8 271 277 -2.2 11.4 12.6 South Okanagan 315,422 303,739 3.8 2,276 2,249 1.2 6.6 5.2 Northern Lights 220,060 239,955 -8.3 359 363 -1.1 12.8 15.2 Vancouver Island 318,830 344,905 -7.6 6,815 6,617 3.0 8.0 8.5 Victoria 467,052 496,943 -6.0 4,178 3,587 16.5 11.9 13.9 Provincial Totals* 540,877 491,832 10.0 56,845 57,801 -1.7 11.5 10.0 *Numbers may not add due to rounding July 2011 BC Residential Multiple Listing Service® Data by Board Dollar Volume (000s) Units July 2011 July 2010 July 2011 July 2010 Board Residential Sales Residential Sales % change Residential Sales Residential Sales % change ($) ($) (Units) (Units) BC Northern 84,885 71,713 18.4 375 339 10.6 Chilliwack 55,146 44,113 25.0 179 144 24.3 Fraser Valley 629,914 475,439 32.5 1,250 1,035 20.8 Greater Vancouver 1,991,012 1,511,002 31.8 2,614 2,297 13.8 Kamloops 53,383 58,419 -8.6 186 188 -1.1 Kootenay 53,015 45,079 17.6 181 167 8.4 Okanagan Mainline 194,224 140,907 37.8 476 347 37.2 Powell River 7,547 7,691 -1.9 31 35 -11.4 South Okanagan 47,629 35,234 35.2 151 116 30.2 Northern Lights 10,123 13,198 -23.3 46 55 -16.4 Vancouver Island 174,081 193,492 -10.0 546 561 -2.7 Victoria 232,592 248,472 -6.4 498 500 -0.4 Provincial Totals* 3,533,550 2,844,756 24.2 6,533 5,784 12.9 * Numbers may not add due to rounding **NOTE: The Northern Lights Real Estate Board (NLREB) became part of the South Okanagan Real Estate Board (SOREB) on January 1, 2011. 1420 – 701 Georgia Street W, PO Box 10123, Pacific Centre, Vancouver, BC V7Y 1C6 President Rick Valouche | Vice President Jim McCaughan | bcrea@bcrea.bc.ca | 604.683.7702 (tel) Past President Moss Moloney | Chief Executive Officer Robert Laing | www.bcrea.bc.ca | 604.683.8601 (fax)
- 3. BC Home Sales Edge Lower in July . . . Page 3 July 2011 Year-to-Date BC Residential Multiple Listing Service® Data by Board Dollar Volume (000s) Unit Sales Average Price Board % % % 2011 2010 2011 2010 change 2011 2010 change change ($) ($) ($) ($) BC Northern 494,837 491,824 0.6 2,240 2,261 -0.9 220,909 217,525 1.6 Chilliwack 378,679 425,767 -11.1 1,267 1,356 -6.6 298,878 313,988 -4.8 Fraser Valley 4,773,738 4,215,110 13.3 9,388 9,278 1.2 508,494 454,312 11.9 Greater Vancouver 17,346,119 13,171,445 31.7 21,764 19,786 10.0 797,010 665,695 19.7 Kamloops 374,374 406,847 -8.0 1,221 1,326 -7.9 306,612 306,823 -0.1 Kootenay 289,082 347,342 -16.8 1,088 1,245 -12.6 265,700 278,989 -4.8 Okanagan Mainline 1,128,667 1,214,994 -7.1 2,943 3,078 -4.4 383,509 394,735 -2.8 Powell River 42,982 41,031 4.8 194 172 12.8 221,555 238,554 -7.1 South Okanagan 244,143 293,753 -16.9 789 901 -12.4 309,434 326,030 -5.1 Northern Lights 55,220 58,679 -5.9 259 279 -7.2 213,206 210,320 1.4 Vancouver Island 1,275,604 1,408,779 -9.5 3,898 4,276 -8.8 327,246 329,462 -0.7 Victoria 1,783,517 2,121,936 -15.9 3,577 4,169 -14.2 498,607 508,980 -2.0 Provincial Totals* 28,186,962 24,197,509 16.5 48,628 48,127 1.0 579,645 502,784 15.3 * Numbers may not add due to rounding BCREA represents 11 member real estate boards and their approximately 18,000 REALTORS® on all provincial issues, providing an extensive communications network, standard forms, economic research and analysis, government relations, applied practice courses and continuing professional education (cpe). To demonstrate the profession’s commitment to improving Quality of Life in BC communities, BCREA supports policies that encourage economic vitality, provide housing opportunities, respect the environment and build communities with good schools and safe neighbourhoods. For detailed statistical information, contact your local real estate board. MLS® is a cooperative marketing system used only by Canada’s real estate boards to ensure maximum exposure of properties listed for sale. 1420 – 701 Georgia Street W, PO Box 10123, Pacific Centre, Vancouver, BC V7Y 1C6 President Rick Valouche | Vice President Jim McCaughan | bcrea@bcrea.bc.ca | 604.683.7702 (tel) Past President Moss Moloney | Chief Executive Officer Robert Laing | www.bcrea.bc.ca | 604.683.8601 (fax)