Growth Rate of Gross State Domestic Product in Only Agriculture Sector at Constant 2004- 05 Prices ( 2005-06 to 2012-13 )
•
0 gefällt mir•1,386 views

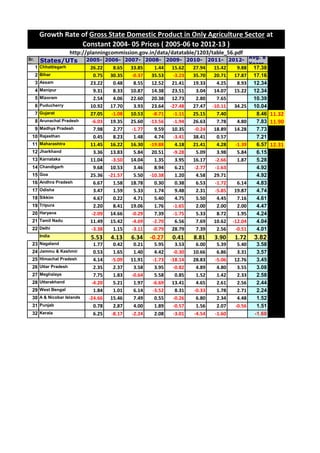
The planning commission has table 56 that gives Growth Rate of Gross State Domestic Product in Only Agriculture Sector at Constant 2004- 05 Prices ( 2005-06 to 2012-13 ). This document took the same table and ranked the states according to the average growth rate of GSDP for 8 years, i.e. 2005-06 to 2012-13. This was done to compare how different states have performed in Agriculture in comparison to their peers.
Empfohlen

Empfohlen
Weitere ähnliche Inhalte
Andere mochten auch
Ähnlich wie Growth Rate of Gross State Domestic Product in Only Agriculture Sector at Constant 2004- 05 Prices ( 2005-06 to 2012-13 )
Ähnlich wie Growth Rate of Gross State Domestic Product in Only Agriculture Sector at Constant 2004- 05 Prices ( 2005-06 to 2012-13 ) (20)
Mehr von Sadanand Patwardhan
Mehr von Sadanand Patwardhan (20)
Kürzlich hochgeladen
Kürzlich hochgeladen (20)
Growth Rate of Gross State Domestic Product in Only Agriculture Sector at Constant 2004- 05 Prices ( 2005-06 to 2012-13 )
- 1. Sr. No. States/UTs 2005- 06 2006- 07 2007- 08 2008- 09 2009- 10 2010- 11 2011- 12 2012- 13 Avg. 8 Years 1 Chhattisgarh 26.22 8.65 33.85 1.44 15.62 27.94 15.42 9.88 17.38 2 Bihar 0.75 30.35 -0.37 35.53 -3.23 35.70 20.71 17.87 17.16 3 Assam 23.22 0.48 8.55 12.52 21.41 19.33 4.25 8.93 12.34 4 Manipur 9.31 8.33 10.87 14.38 23.51 3.04 14.07 15.22 12.34 5 Mizoram 2.54 4.06 22.60 20.38 12.73 2.80 7.65 10.39 6 Puducherry 10.92 17.70 3.93 23.64 -27.48 27.47 -10.11 34.25 10.04 7 Gujarat 27.05 -1.08 10.53 -8.71 -1.11 25.15 7.40 8.46 11.32 8 Arunachal Pradesh -6.03 19.35 25.60 -13.56 -1.94 26.63 7.78 4.80 7.83 11.90 9 Madhya Pradesh 7.98 2.77 -1.77 9.59 10.35 -0.24 18.89 14.28 7.73 10 Rajasthan 0.45 8.23 1.48 4.74 -3.41 38.41 0.57 7.21 11 Maharashtra 11.45 16.22 16.30 -19.88 4.18 21.41 4.28 -1.39 6.57 12.31 12 Jharkhand 3.36 13.83 5.84 20.51 -9.28 5.09 3.98 5.84 6.15 13 Karnataka 11.04 -3.50 14.04 1.35 3.95 16.17 -2.66 1.87 5.28 14 Chandigarh 9.68 10.53 3.46 8.94 6.21 -2.77 -1.63 4.92 15 Goa 25.36 -21.57 5.50 -10.38 1.20 4.58 29.71 4.92 16 Andhra Pradesh 6.67 1.58 18.78 0.30 0.38 6.53 -1.72 6.14 4.83 17 Odisha 3.47 1.59 5.33 1.74 9.48 2.31 -5.85 19.87 4.74 18 Sikkim 4.67 0.22 4.71 5.40 4.75 5.50 4.45 7.16 4.61 19 Tripura 2.20 8.41 19.06 1.76 -1.65 2.00 2.00 2.00 4.47 20 Haryana -2.09 14.66 -0.29 7.39 -1.75 5.33 8.72 1.95 4.24 21 Tamil Nadu 11.49 15.42 -4.69 -2.70 6.56 7.69 10.62 -12.04 4.04 22 Delhi -3.38 1.15 -3.11 -0.79 28.79 7.39 2.56 -0.51 4.01 India 5.53 4.13 6.34 -0.27 0.41 8.81 3.90 1.72 3.82 23 Nagaland 1.77 0.42 0.21 5.95 3.53 6.00 5.39 5.40 3.58 24 Jammu & Kashmir 0.53 1.65 1.40 4.42 -0.30 10.66 6.86 3.31 3.57 25 Himachal Pradesh 4.14 -5.09 11.91 -1.73 -18.14 28.83 -5.06 12.76 3.45 26 Uttar Pradesh 2.35 2.37 3.58 3.95 -0.82 4.89 4.80 3.55 3.08 27 Meghalaya 7.75 1.83 -0.64 5.58 0.85 1.52 1.42 2.33 2.58 28 Uttarakhand -4.20 5.21 1.97 -6.69 13.41 4.65 2.61 2.56 2.44 29 West Bengal 1.84 1.01 6.14 -3.52 8.31 -0.33 1.78 2.71 2.24 30 A & Nicobar Islands -24.66 15.46 7.49 0.55 -0.26 6.80 2.34 4.48 1.52 31 Punjab 0.78 2.87 4.00 1.89 -0.57 1.56 2.07 -0.56 1.51 32 Kerala 6.25 -8.17 -2.24 2.08 -3.01 -4.54 -1.60 -1.60 Growth Rate of Gross State Domestic Product in Only Agriculture Sector at Constant 2004- 05 Prices ( 2005-06 to 2012-13 ) http://planningcommission.gov.in/data/datatable/1203/table_56.pdf