Ivcnz07paper30
•
1 gefällt mir•622 views

A statistical approach to defect detection and discrimination has been applied to the case of hot rolled steel. The probability distribution of pixel intensities has been estimated from a small set of images without defects, and this distribution is used to select pixels with unlikely values as candidates for defects. Discrimination of true defects from random noise pixels is achieved by a dynamical thresholding procedure, which tracks the behaviour of clusters of selected pixels for varying threshold level.

Empfohlen
Empfohlen
Weitere ähnliche Inhalte
Ähnlich wie Ivcnz07paper30
Ähnlich wie Ivcnz07paper30 (20)
Mehr von Sead Spuzic
Mehr von Sead Spuzic (20)
Kürzlich hochgeladen
Kürzlich hochgeladen (20)
Ivcnz07paper30
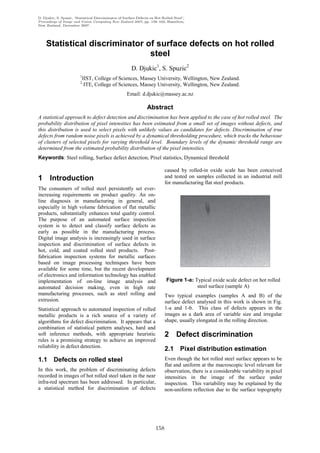
- 1. D. Djukic, S. Spuzic, ‘Statistical Discriminator of Surface Defects on Hot Rolled Steel’, Proceedings of Image and Vision Computing New Zealand 2007, pp. 158–163, Hamilton, New Zealand, December 2007. Statistical discriminator of surface defects on hot rolled steel D. Djukic1, S. Spuzic2 1 IIST, College of Sciences, Massey University, Wellington, New Zealand. 2 ITE, College of Sciences, Massey University, Wellington, New Zealand. Email: d.djukic@massey.ac.nz Abstract A statistical approach to defect detection and discrimination has been applied to the case of hot rolled steel. The probability distribution of pixel intensities has been estimated from a small set of images without defects, and this distribution is used to select pixels with unlikely values as candidates for defects. Discrimination of true defects from random noise pixels is achieved by a dynamical thresholding procedure, which tracks the behaviour of clusters of selected pixels for varying threshold level. Boundary levels of the dynamic threshold range are determined from the estimated probability distribution of the pixel intensities. Keywords: Steel rolling, Surface defect detection, Pixel statistics, Dynamical threshold caused by rolled-in oxide scale has been conceived 1 Introduction and tested on samples collected in an industrial mill for manufacturing flat steel products. The consumers of rolled steel persistently set ever- increasing requirements on product quality. An on- line diagnosis in manufacturing in general, and especially in high volume fabrication of flat metallic products, substantially enhances total quality control. The purpose of an automated surface inspection system is to detect and classify surface defects as early as possible in the manufacturing process. Digital image analysis is increasingly used in surface inspection and discrimination of surface defects in hot, cold, and coated rolled steel products. Post- fabrication inspection systems for metallic surfaces based on image processing techniques have been available for some time, but the recent development of electronics and information technology has enabled implementation of on-line image analysis and Figure 1-a: Typical oxide scale defect on hot rolled automated decision making, even in high rate steel surface (sample A) manufacturing processes, such as steel rolling and Two typical examples (samples A and B) of the extrusion. surface defect analysed in this work is shown in Fig. Statistical approach to automated inspection of rolled 1-a and 1-b. This class of defects appears in the metallic products is a rich source of a variety of images as a dark area of variable size and irregular algorithms for defect discrimination. It appears that a shape, usually elongated in the rolling direction. combination of statistical pattern analyses, hard and soft inference methods, with appropriate heuristic 2 Defect discrimination rules is a promising strategy to achieve an improved reliability in defect detection. 2.1 Pixel distribution estimation 1.1 Defects on rolled steel Even though the hot rolled steel surface appears to be flat and uniform at the macroscopic level relevant for In this work, the problem of discriminating defects observation, there is a considerable variability in pixel recorded in images of hot rolled steel taken in the near intensities in the image of the surface under infra-red spectrum has been addressed. In particular, inspection. This variability may be explained by the a statistical method for discrimination of defects non-uniform reflection due to the surface topography 158
- 2. and texture, by the changes in the ambient light, and I k − λ by randomness in the conversion process from an P (I ) = 1 − e W (2) optical image to its digital representative. Because of this non-uniformity, it is not possible to select pixels Relevant functions are defined by equation (1) for the corresponding to a defect simply by classifying their normal distribution, and (2) for Weibull distribution. intensities, e.g. by a uniform thresholding operation. The parameters of these distributions, µ and σ , and k and λ respectively, are estimated from a relatively small number (50 in this case) of images of the regular, faultless, surface. Fig. 2 presents the observed cumulative frequency of the pixel intensities, together with the cumulative probability functions corresponding to the estimated normal and Weibull distributions. It has been noted that Weibull distribution shows better agreement with the observed data, especially for low pixel intensities. 2.2 Dynamical image thresholding The discrimination of defects in the image is achieved by selecting pixels and pixel clusters which do not Figure 1-b: Typical oxide scale defect on hot rolled behave according to the estimated probability steel surface (sample B) distribution of the regular, faultless surface. Since the In the present work, the pixels in the image of the image pixels are realisations of a random process, inspected surface are treated as realisations of a pixels with any intensity value are possible, however random process described by a certain probability they may be more or less likely. For the distribution. The founding postulate of the method discrimination of defects in the image it is not developed here is the fact that the probability sufficient only to detect pixels with extremely low distributions of the pixels which represent the regular, probability of appearance. Further decision needs to flawless surface, and of the pixels which reperesent be made on whether the selected pixels do indeed defects, differ significantly to provide adequate correspond to a true defect. Since typical scale roll-in filtering criteria. defects are of certain size, the making of this decision is directed by the size of clusters of selected pixels. From the estimated probability distribution functions, Observed frequencies it is possible to deduce the quantile functions that Normal distribution Weibull distribution relate pixel intensities to their corresponding 0.75 cumulative probabilities. Selection of pixels Cumulative probability according to a certain probability level corresponds to a non-uniform thresholding, where the thresholding 0.5 level for each pixel is determined from the estimated probability distribution. In this process, a binary 0.25 valued representative Bxy (P ) of the original image, I xy , has been obtained, (3), where P is the given 0.45 0.5 0.55 probability level, I xy is the intensity of the pixel at Relative pixel intensity coordinates x and y in the original image, and Figure 2: Pixel distribution estimation q xy ( P ) is the corresponding quantile function. Before defect discrimination can be performed, it is necessary to determine the probability distribution of 0 I xy ≥ q xy ( P) the pixel intensities in the images of the regular Bxy ( P ) = (3) surface. In this work, two cumulative distribution 1 I xy < q xy ( P) functions are tried: one based on Gaussian (normal), and another one based on Weibull distribution. Reliable detection of defects requires resolving two 1 1 I −µ PN ( I ) = + erf ( ) (1) problems: finding the correct probability level, and 2 2 2σ the elimination of noise pixels. In addressing the first issue, one needs to establish the correct probability level for discrimination of pixels. 159
- 3. The probability level at which the pixels are selected indicating a possible presence of a defect. As the (discriminated) as pixels corresponding to a defect, probability grows with further increments, new pixels depends on the actual defect, and also on the join the nucleus, and the cluster area increases. conditions under which the image is taken. Thus, this However, some pixels do not form clusters, and they level ought not to be fixed in advance; it has to be remain isolated as the probability level increases. allowed to change according to the image Such pixels are considered to be the noise. circumstances. Eventually, as the probability level increases further, The second problem, noise elimination, is related to the number of noise pixels begins to increase rapidly, the fact that a pixel selected according to a fixed however, the growth of the pixel clusters indicating probability threshold may also be a pixel that is not a the presence of a defect ceases. In order to observe deviation from the probability distribution, but is a this behaviour, it is necessary to perform the variation realisation from its tail. A low probability fixed of the probability level in several increments over threshold would eliminate the noise but it would several orders of magnitude. In practice, 12 to 15 simultaneously hinder the detection of actual features increments over 3 to 6 orders of magnitude are ample of a real defect. A high probability fixed threshold to draw a conclusion on the behaviour of the selected pollutes the defect contours, due to the increase in pixels. In a number of cases, using as few as 5 to 8 noise density. increments has been sufficient for a successful discrimination of defects. Both issues may be satisfactorily resolved through dynamical thresholding. In dynamical thresholding, the probability level P changes, and the behaviour of the selected pixels i.e. the pixels with value 1 in Bxy (P ) , is tracked by means of this change. The probability level is varied between two values, which need not be precisely determined, but roughly correspond to levels that allow the method to discriminate pixels. The lower limit of the probability level of the moving threshold is that at which it is extremely unlikely that any of the pixels is selected as a candidate for defect. The upper limit of the probability range is the level at which the number of selected pixels becomes approximately equal to the expected number of the selected pixels, i.e. when the observed frequency of the event becomes comparable Figure 3-a: Bxy (P ) (Gaussian distribution), to the probability of that event. In the problem treated P = q ( µ − 4σ ) = 0.00003 in this work, it has been observed that these two probability levels differ by several orders of magnitude. 2.3 Defect discrimination As the probability level P changes from the lower to the upper limit, the number of selected pixels in Bxy (P ) increases, where some of the pixels form clusters, and some appear and remain isolated. Since the isolated pixels represent a very small area on the inspected surface, in order to declare the presence of a defect, it is necessary to detect the presence of a cluster of selected pixels. When the threshold is at the lower end of its range of values, only the pixels with extremely unlikely values Figure 3-b: Bxy (P ) (Gaussian distribution), are selected. In practice, this usually amounts to only P = q ( µ − 4σ ) = 0.00003 one or two isolated pixels. At this stage, they are all accepted as the candidates. As the probability level Based on these observations, a pixel tracking passes onto the next higher increment, more pixels are procedure for distinguishing defects from noise pixels selected. Some of these newly selected pixels are has been devised. The procedure is based on simple adjacent to, or in the immediate vicinity of, the heuristic rules: previously selected pixels. Such pixels form a cluster, 160
- 4. - Begin at such a low probability level that no pixels are selected. - Increase the probability level and mark the pixels as they appear. - Retain the pixels that form a cluster the size of which increases as the probability level increases. - Suppress isolated pixels that are distant from any cluster, and that remain isolated after the probability level has increased by more than one order of magnitude. - Suppress isolated pixels that are near a cluster, i.e. whose distance from a cluster is less than the size of that cluster, but that do Figure 4-b: Bxy (P ) (Gaussian distribution), not join it when the probability changes for more than 2 orders of magnitude. P = q ( µ − 2.5σ ) = 0.006 This procedure has enabled a robust and reliable discrimination of defects in all tested cases. 3 Experimental results The procedure for defect discrimination described in the previous section has been tested on a set of images of hot rolled steel, collected at New Zealand Steel production site at Glenbrook. The parameters of pixel distributions have been estimated from a subset of images without defects, both for Gaussian and for Weibull distributions. In this section, the defect detection procedure has been applied to two typical images, each showing a local region with rolled-in oxide scale (Figs. 1-a and Figure 5-a: Bxy (P ) (Gaussian distribution), 1-b). The detection procedure has been applied using both Gaussian and Weibull distributions. The process P = q ( µ − 1.5σ ) = 0.07 of surface defect discrimination is presented here visually, by means of Bxy (P ) images. These are bi- level (black and white) images in which the selected pixels are shown in black. Figure 5-b: Bxy (P ) (Gaussian distribution), P = q ( µ − 1.5σ ) = 0.07 In the case of Gaussian distribution, the threshold Figure 4-a: Bxy (P ) (Gaussian distribution), levels have been set directly from the distribution parameters µ and σ , and the corresponding P = q ( µ − 2.5σ ) = 0.006 probability level has been computed using equation (1). This has been necessary, as, for very small 161
- 5. probabilities, the numerical computation of the very low. As the probability level increases (Figs. 4-a quantile function becomes unreliable. and 4-b), clusters that show a tendency to increase in area are formed. Eventually (Figs. 5-a and 5-b), the pixel clusters indicating the defects stop growing, but the number of noise pixels begins to rise rapidly. Figure 6-a: Bxy (P ) (Weibull distribution), P = 0.00001 Figure 7-b: Bxy ( P ) (Weibull distribution), P = 0.01 Figure 6-b: Bxy ( P ) (Weibull distribution), P = 0.00001 Figure 8-a: Bxy ( P ) (Weibull distribution), P = 0 .1 Figure 7-a: Bxy ( P ) (Weibull distribution), P = 0.01 Figs. 3-a and 3-b, related to samples A and B Figure 8-b: Bxy ( P ) (Weibull distribution), respectively, show selected pixels that are candidates P = 0 .1 for defect indicators; however the probability level is 162
- 6. In the case of Weibull distribution, the quantile References function may be computed with adequate accuracy, and this function has been used to determine the [1] T. Sugimoto, T, Kawaguchi "Development threshold levels from the desired probability levels. of a Surface Defect Inspection System Using The behaviour of the selected pixels as the threshold Radiant Light from Steel Products in a Hot increases is similar to the behaviour described in the Rolling Line", IEEE Trans Inst. Meas.vol. 47 previous paragraph (Figs. 6-a and 6-b, Figs. 7-a and no. 2, April 1998, pp 409-416 7-b, and Figs. 8-a and 8-b). [2] C. Fernandez, S. Fernandez, P. Campoy, R. Aracil "On-line texture analysis for flat When compared to Gaussian distribution, products inspection. Neural nets thresholding levels determined by Weibull implementation", Proceedings of IECON distribution tend to produce less noise pixels. This '94., Sept. 1994, vol.2, pp 867 - 872 observation is of particular importance for the range of probability levels in which the cluster [3] R.J. Montague, J. Watton, K.J. Brown "A corresponding to the defect shows growth, as this machine vision measurement of slab camber enables reliable elimination of noise pixels. This in hot strip rolling", Journal of Materials advantage of Weibull distribution has been expected, Processing Technology 168 (2005) 172–180 since the Weibull distribution shows a better [4] H. Jia, Y. L. Murphey, J. Shi, T.-S. Chang concordance with the observed distribution of pixel "An Intelligent Real-time Vision System for intensities. In addition, when estimated Weibull Surface Defect Detection", Proceedings of distribution is being used, the defect discrimination ICPR’04, IEEE Computer Society, 2004 decision may be reached in fewer increments. [5] C. Fernandez; C. Platero; P. Campoy; R. Aracil "Vision system for on-line surface 4 Conclusion inspection in aluminum casting process" Proceedings of IECON '93, Nov. 1993, In this work, the problem of detection of scale roll-in vol.3, pp 1854-1859 defects in hot rolled steel has been solved using a [6] J. J. Haapamaki, S. M. Tamminen, J. J. statistical approach. The probability distribution of Roning "Data mining methods in hot steel pixels of regular, faultless surface has been estimated. rolling for scale defect prediction" Two standard probability distribution functions, Proceedings of AIA 2005, Feb. 2005, pp 453- Gaussian and Weibull, have been tried, and Weibull 464 distribution has shown some superiority in this case. The estimated distributions are used in a process of dynamical non-uniform thresholding, through which candidate pixels are selected. The candidate pixels are further classified into defects and noise, by means of tracking of the candidate pixels as the thresholding level varies. The method described here has been applied on a set of test images collected in an industrial steel mill for hot rolling. The results obtained in this test show clear potential of this method for robust and reliable detection of scale roll-in defects. Two significant improvements of the method presented here are under consideration. One improvement would involve morphological and statistical analysis of pixel clusters. The other improvement would involve estimating multivariate pixel statistics, which would result in a more definite criterion for noise filtering. This method will also be extended to allow detection of other types of hot rolling defects. 5 Acknowledgements The authors are grateful to Mr. H. Nieborak, Mr. R. Kimber, Mr. N. Joveljic, and Mr. P. Bagshaw of the New Zealand Steel, for their kind provision of the sample images, and for their enthusiasm, encouragement and interest in this work. 163