1. INITIATING COVERAGE
June 7, 2010
ILOOKABOUT CORP (TSXV:ILA) Rating: BUY
MAJOR DEPLOYMENT TRANSFORMS COMPANY INTO A “REAL LOOKER” 12-Month Target: $1.40
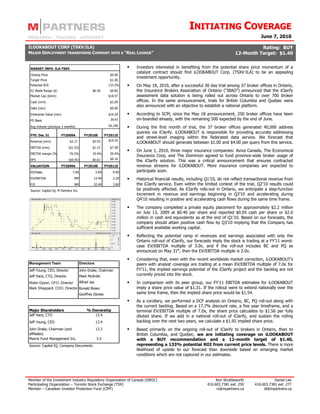
MARKET INFO: ILA-TSXV Investors interested in benefiting from the potential share price momentum of a
catalyst contract should find iLOOKABOUT Corp. (TSXV:ILA) to be an appealing
Closing Price $0.60
investment opportunity.
Target Price $1.40
Potential ROI 133.3% On May 18, 2010, after a successful 30 day trial among 37 broker offices in Ontario,
52 Week Range ($) $0.36 $0.82 the Insurance Brokers Association of Ontario (“IBAO”) announced that the iClarify
Market Cap ($mm) $18.57 assessment data solution is being rolled out across Ontario to over 700 broker
Cash (mm) $2.04 offices. In the same announcement, trials for British Columbia and Quebec were
also announced with an objective to establish a national platform.
Debt (mm) $0.00
Enterprise Value (mm) $16.54 According to SCM, since the May 18 announcement, 250 broker offices have been
FD Basic 39.97 on-boarded already, with the remaining 500 expected by the end of June.
55,190
Avg Volume (previous 3 months) During the first month of trial, the 37 broker offices generated 40,000 address
queries via iClarify. iLOOKABOUT is responsible for providing accurate addressing
FYE: Dec 31 FY2009A FY2010E FY2011E
and street-level imaging within the federated data service. We forecast that
Revenue (mm) $2.17 $5.93 $19.25
iLOOKABOUT should generate between $1.00 and $4.00 per query from this service.
EBITDA (mm) ($1.53) $1.15 $7.58
On June 1, 2010, three major insurance companies: Aviva Canada, The Economical
EBITDA margin (%) -70.5% 19.4% 39.4%
Insurance Corp, and The Dominion agreed to fund province-wide broker usage of
EPS ($0.05) $0.02 $0.16
the iClarify solution. This was a critical announcement that ensures contracted
VALUATION FY2009A FY2010E FY2011E revenue streams for iLOOKABOUT. More insurance companies are expected to
EV/Sales 7.6X 2.8X 0.9X participate soon.
EV/EBITDA NM 14.4X 2.2X Historical financial results, including Q1’10, do not reflect transactional revenue from
P/E NM 32.4X 3.8X the iClarify service. Even within the limited context of the trial, Q2’10 results could
Source: Capital IQ, M Partners Inc. be positively affected. As iClarify rolls-out in Ontario, we anticipate a step-function
increment in revenue and earnings beginning in Q3’10 and accelerating during
Q4’10 resulting in positive and accelerating cash flows during the same time frame.
The company completed a private equity placement for approximately $2.2 million
on July 13, 2009 at $0.40 per share and reported $0.05 cash per share or $2.0
million in cash and equivalents as at the end of Q1’10. Based on our forecasts, the
company should attain positive cash flow by Q3’10 implying that the Company has
sufficient available working capital.
Reflecting the potential ramp in revenues and earnings associated with only the
Ontario roll-out of iClarify, our forecasts imply the stock is trading at a FY’11 worst-
case EV/EBITDA multiple of 3.0x, and if the roll-out includes BC and PQ as
announced on May 31st, then the EV/EBITDA multiple is 2.0x.
Considering that, even with the recent worldwide market correction, iLOOKABOUT’s
Management Team Directors peers with analyst coverage are trading at a mean EV/EBITDA multiple of 7.0x for
Jeff Young, CEO, Director John Drake, Chairman FY’11, the implied earnings potential of the iClarify project and the backlog are not
Jeff Hack, CTO, Director Mark McArdle currently priced into the stock.
Robin Dyson, CFO, Director Alfred Jay In comparison with its peer group, our FY’11 EBITDA estimates for iLOOKABOUT
Mark Sheppard, COO, Director Ronald Breen imply a share price value of $1.31. If the rollout were to extend nationally over the
Geoffrey Davies same time frame, then the implied share price would be $1.54.
As a corollary, we performed a DCF analysis on Ontario, BC, PQ roll-out along with
the current backlog. Based on a 17.7% discount rate, a five year timeframe, and a
Major Shareholders % Ownership terminal EV/EBITDA multiple of 7.0x, the share price calculates to $1.56 per fully
Jeff Hack, CTO 13.4 diluted share. If we add in a national roll-out of iClarify, and sustain the rolling
Jeff Young, CEO 13.4 backlog over the next two years, we calculate a $1.92 implied share price.
John Drake, Chairman (and 13.3 Based primarily on the ongoing roll-out of iClarify to brokers in Ontario, then to
affiliates) British Columbia, and Quebec, we are initiating coverage on iLOOKABOUT
Mavrix Fund Management Inc. 3.5 with a BUY recommendation and a 12-month target of $1.40,
Source: Capital IQ, Company Documents representing a 133% potential ROI from current price levels. There is more
likelihood of upside to our forecast than downside based on emerging market
conditions which are not captured in our estimates.
Member of the Investment Industry Regulatory Organization of Canada (IIROC) Ron Shuttleworth Daniel Lee
Participating Organization – Toronto Stock Exchange (TSX) 416.603.7381 ext. 250 416.603.7381 ext. 277
Member – Canadian Investor Protection Fund (CIPF) rs@mpartners.ca dl@mpartners.ca
2. INITIATING COVERAGE
June 7, 2010
WHAT IS ILOOKABOUT?
iLOOKABOUT Corp (TSXV: ILA) provides enterprise-grade level geo-coded street-level Geographic Information Systems (GIS) imaging. Since
2000, the company has perfected highly sophisticated, proprietary, and patent-pending methods to collect, manipulate and store very
accurate geo-coded panoramic views of urban landscapes. The company owns all of the image data, and has the right to license access to the
data among multiple clients and partners for multiple business applications. An individual parcel of land has the potential to generate
anywhere from $2.50 to $5.00 in revenue per annum.
iLOOKABOUT has developed sophisticated web-based interfaces to the data in order to deliver access to information service “on-demand”.
Open application programming interfaces (APIs) and a services-based architecture allow iLOOKABOUT to federate value-added data services
to create property data solutions for the insurance, real estate, financial, media, education, utilities, and municipal government verticals. To
date, the company has captured images for approximately 80% of twelve million economically viable parcels of land located in Canadian cities.
The company has captured images for economically viable parcels for all communities in Ontario with residential populations of more than
4,000 people. Currently, it generates approximately $0.35 per parcel of land stored in its image database. In addition, it has images for 5% of
140 million parcels of land located in the US. By the end of 2010, it should also own seminal data sets for London, UK as well.
For each of the sectors that it serves, the iLOOKABOUT federated data services decrease administration expenses while also unlocking
revenue potential. Within the insurance industry, the cost of Insurance-to-Value replacement inaccuracy is a problem estimated to cost $11
billion per year to the insurance industry (Source: Insurance Brokers Association of Ontario (“IBAO”)). According to Claims Canada, 70% of
existing policies are underinsured by as much as 33%. The costs associated with infrastructure and taxation management for the top 50
municipalities in North America represents a problem that could be worth approximately $750 million per year. (M Partners, City of Hamilton)
THE COMPETITIVE LANDSCAPE
The industry in which iLOOKABOUT competes can be described as fragmented with numerous smaller privately held vendors. Some of the
more relevant competitors in the space that provide geo-referenced, panoramic, street level imagery include Google (NASDAQ:GOOG), Blue
Dasher, Facet Technology, Yotta DCL (AIM:OMG), Geospan, and Visre. Of these companies, Facet and Yotta DCL are the only companies that
iLOOKABOUT encountered in competitive bidding RFP processes. We believe that iLOOKABOUT’s wins can be attributed to the accuracy of
its geo-coding and its high quality imagery. Many of its competitors utilize video image capture which results in lower quality data. Yotta DCL
offers a Computer Assisted Mass Appraisal (“CAMA”) product that competes with iLOOKABOUT’s channel partners Vision Appraisal, Lexur, ARC,
CLT, and Patriot. Geospan is largely an aerial image capture company embroiled in a patent lawsuit with Pictometry. iLOOKABOUT has not
come across Blue Dasher or Visre in a competitive RFP process.
Although Google can be considered the behemoth in the space through its Street View product, its addressing solutions are only accurate to
within thirty meters. In contrast, iLOOKABOUT’s data collection technology delivers addressing resolutions to within one meter. While not a
significant differentiator for consumer applications, the accuracy of its geo-coding provides iLOOKABOUT with a competitive advantage in
industrial, commercial and government applications where data precision is important. At present, Google is not focused on precision and
accuracy required for enterprise solutions. That said, we note that it is possible to create a mash-up utilizing Google’s API with a Lat-Long
application to deliver more precise addressing capabilities. A current iClarify competitor iV3, has taken this approach. However, there are still
concerns regarding precision related to their algorithms, and it has not yet gained much traction in the segments for which iClarify delivers
data services.
RECENT CATALYSTS
Date Event Implications
June 1, 2010 iClarify rolled out to Ontario brokers under Aviva Canada, The These three companies represent a significant market
Economical Insurance Group® (TEIG) and The Dominion. share of the estimated 250,000 property quotes per
month in Ontario.
May 25 2010 DMTI Spatial Inc. and iLOOKABOUT sign partnership Extends iLOOKABOUT’s reach into financial market.
agreement which will allow users of DMTI’s industry-leading Introduces StreetScape to telecom vertical.
Location Hub® software solution to access iLOOKABOUT’s
StreetScape imagery database.
May 18 2010 iClarify trial for 37 Ontario brokers declared successful by IBAO Key driver of our near term forecasts. Trials showed an
and roll outs to begin across Ontario to all 700 insurance uptake of 40,000 quotes by 37 broker offices during the
broker offices. Trials also announced for BC and QC beginning 30 day pilot at a rate of between $1.00 and $4.00 per
in June 2010. query.
Sept 9 2009 iLOOKABOUT partners with JLR Recherche immobilière to iLOOKABOUT begins to add Quebec images to the
capture Quebec for integration and resale with JLR’s real database, increasing coverage to 80% of all
estate data products. economically viable Canadian properties.
Aug 31 2009 SCM Risk Management Services partners with iLOOKABOUT to Seminal and transformational catalyst for iLOOKABOUT,
provide its complete street-level visual data set of imagery for paving way for iClarify roll out across Canada.
use by insurance brokerage industry in Canada.
Member of the Investment Industry Regulatory Organization of Canada (IIROC) Ron Shuttleworth Daniel Lee
Participating Organization – Toronto Stock Exchange (TSX) 416.603.7381 ext. 250 416.603.7381 ext. 277
Member – Canadian Investor Protection Fund (CIPF) rs@mpartners.ca dl@mpartners.ca
3. INITIATING COVERAGE
June 7, 2010
THE MARKET OPPORTUNITY
On August 31, 2009 SCM Risk Management Services announced a seminal partnership with iLOOKABOUT to provide insurance brokers with a
web-based property repository to evaluate and re-assess insurance policies. The product is designed to federate accurate addresses with high
quality photos, MLS data, construction materials data, and other sources to deliver a comprehensive replacement value for structures on
economically viable land parcels in urban agglomerations. The solution was rolled out during Q2’10 to a trial group of 37 broker offices.
The business model for the service, branded iClarify, is transactional licensing. For every address look-up and data search completed by a
broker, iLOOKABOUT earns between $1.00 and $4.00 per query. We anticipate that a typical broker office could generate between 20 and 30
queries per day. The iClarify workflow replaces field adjustments which generally cost between $150.00 and $200.00 to complete. A key
catalyst for the stock was the announcement of the decision by the IBAO to move the solution into production, representing more than 700
additional broker offices. Concurrently, SCM announced that similar trials will begin during June for both British Colombia and Quebec.
Because iLOOKABOUT owns key elements of the data set, it has the ability to extend its federated data solution to multiple vertical markets.
For the City of Hamilton, it provides infrastructure data, allowing planners and engineers to identify locations where roadwork, sewer work,
and other activities need to occur. With the solution, the City of Hamilton reports that it saves $36,000 per month or approximately $0.5
million per year in data gathering costs. Based on publicly available reports, we calclulate that iLOOKABOUT generates approximately $90,000
per annum from this program. There are approximately 1,600 cities in North America with populations that exceed 30,000 (Source: Company).
The annualized potential revenue per parcel of land that the company can generate from municipal governments, public works, and utilities
ranges from $2.50 to $5.00.
Estimated Annual Revenue Originally, iLOOKABOUT produced 360 degree virtual tour software for the
Municipal Government $ 32,500 real estate industry. Although it has deals with some agencies in Toronto
Local Utility 32,500 along with the MLS, it has never been able to scale this part of its
Local Real Estate Board 14,000 $2.67/parcel* business well. The lack of success associated with this business may be
Pre-Construction Imagery 9,000 attributed to the customer base. The potential client, an individual real
$ 88,000 estate broker, was a pseudo-consumer with similar pricing sensitivity and
*Mid-sized Ontario city with population of 45,000 and 33,000 property parcels
the buying decision was driven by opportunity instead of pain. We see this
Source: Company Presentation
part of the business remaining a small element of revenue and may serve
to enhance iLOOKABOUT’s StreetScape offering.
PRODUCT
Streetscape Architecture: iLOOKABOUT assembles panoramic street level data on behalf of multiple clients in multiple sectors.
Insurance Real Gov’t Verticals:
Estate i … n, etc.
3rd party data services
Indexed local geo-spatial
Local data collection
Proprietary Geospatial Technology Platform
Member of the Investment Industry Regulatory Organization of Canada (IIROC) Ron Shuttleworth Daniel Lee
Participating Organization – Toronto Stock Exchange (TSX) 416.603.7381 ext. 250 416.603.7381 ext. 277
Member – Canadian Investor Protection Fund (CIPF) rs@mpartners.ca dl@mpartners.ca
4. INITIATING COVERAGE
June 7, 2010
Vertical Solutions - Examples
Property and Casualty Insurance Real Estate Sales
iClarify: Developed for the insurance broker market to solve the Teranet’s GeoWarehouse: iLOOKABOUT has a five year licensing
problem of inaccurate property assessments. iClarify functions as a arrangement to provide StreetScape data through Teranet’s online
property information services portal through which insurance brokers GeoWarehouse service. GeoWarehouse provides real estate sales
can log on to obtain instant access to property underwriting services. agents in Ontario with comprehensive reports of information
Inspections, property images, valuation information, claims histories including sales price history and parcel maps of the target property.
and demographic information can be purchased as a complete StreetScape data allows realtors to examine and assess specific
underwriting report or on an a-la-carte basis. Data partners include property features and details, supplementing the data available
CGI/SCM/MPAC. Distribution partner is Compu-Quote. Images and through the land registry files.
addresses are supplied by iLOOKABOUT.
iClarify web-based interface (Source: iLOOKABOUT)
GeoWarehouse web interface (Source: iLOOKABOUT)
FINANCIAL PERFORMANCE AND OUTLOOK
Since going public in 2008, iLOOKABOUT has achieved a sequential average quarterly growth rate of 16.3%. This growth has been driven
primarily by its StreetScape offering which represented 92% of FY’09 revenues. During Q1’10, the company reported revenues of $0.70M
compared to $0.43M in Q1’09 representing a Y/Y increase of 63%. None of iLOOKABOUT’s revenues disclosed to date reflect any
transactional revenue from the iClarify service. Moreover, the company’s backlog of $6.1M as at Q1’10 does not account for any iClarify
revenue contribution. These factors provide the assumptive foundation for our top-line forecasts for FY’10 and beyond.
Key Assumptions:
Our forecast is framed by a total query volume of 250,000 per month Historical Revenue Growth
for iClarify in Ontario starting in Q2’10 and 100,000 queries per
0.80
0.70
month in each of BC and PQ starting in 2011 (source: SCM). It does
0.62
0.70 16.3% CQGR
not include a national roll-out.
0.57
0.55
0.60
0.43
Our actual base-case revenue forecast is based up the presence of 0.50
$MMs
insurance company sponsors that pay for the services. With Aviva, 0.40
0.24
TEIG, and The Dominion committed upfront in Ontario, we are
0.21
0.30
0.19
0.18
estimating that iLOOKABOUT will start generating revenue from 40% 0.20
of the potential volume, moving up to 90% by Q3’11. The pace of 0.10
volume uptake will be affected by the speed by which new insurers 0.00
sign on to sponsor the service. Q1'08 Q2'08 Q3'08 Q4'08 Q1'09 Q2'09 Q3'09 Q4'09 Q1'10
We have generalized our model to measure potential revenue per
land parcel stored. The objective of management would be to
generate average revenues per parcel (“ARP”) of $2.50 to $5.00 Backlog
based on revenue from all sources. Currently, the company FY'08 FY'09 Y/Y Growth
generates $0.35 per annum per parcel. Our forecast estimates $2.17 $1.56 $6.75 334%
ARP exiting FY’11.
Source: Company Reports
We are forecasting the current rolling $6.1 million StreetScape
backlog to be burned off at a pace of $0.8 m per quarter over seven
quarters. Our forecasts could be impacted by changes to the pace of
revenue recognition, and future pipeline conversion.
Member of the Investment Industry Regulatory Organization of Canada (IIROC) Ron Shuttleworth Daniel Lee
Participating Organization – Toronto Stock Exchange (TSX) 416.603.7381 ext. 250 416.603.7381 ext. 277
Member – Canadian Investor Protection Fund (CIPF) rs@mpartners.ca dl@mpartners.ca
5. INITIATING COVERAGE
June 7, 2010
We forecast that the impact of the iClarify trial should be present for Q2’10 results, while a partial impact of the Ontario roll-out should begin
to be reflected for Q3’10 results, and be fully realized by Q3’11. Our forecast implies that the delta in quarterly revenue should be $1.82 for
the Ontario portion of the iClarify deployment, representing a $7.3 million annual run-rate. We estimate that usage will top out at 90%
adoption exiting Q2’11. If a pipeline of insurer sponsors, acknowledged by iLOOKABOUT’s channel partner SCM, signs on at a faster pace than
we are projecting, then it could attain mature run-rate one or even two quarters ahead of expectation. Because both BC and PQ are
conducting broker trials starting in June 2010, we are comfortable to include revenues from these jurisdictions starting in FY’11. Combined, BC
and PQ represent approximately 600,000 additional queries per quarter, and we forecast approximately 50% adoption exiting FY’11. Similarly,
adoption of this solution in each of these jurisdictions could be faster than we are estimating. We project that based on iClarify rolling out to
Ontario, BC and PQ, and with reasonable but modest adoption, the company could exit FY’11 with an annualized revenue run-rate of $10.9
million coming from this single service.
We are assuming that 50% of the current $6.1 m backlog reported for StreetScape should be recognized during FY’10 with the remainder
being recognized during FY’11. This implies approximately $0.8 million per quarter for the remainder of FY’10 and FY’11. We believe this
assumption to be conservative because we are not currently attributing incremental backlog associated with its pipeline. Revenue associated
with the backlog appears to be related to data capture contracts and renewals that it has already negotiated for street level images, with
some revenue attributed to a handful of municipal contracts and the Teranet service.
The data assets owned by iLOOKABOUT can be re-used and extended to multiple enterprise-grade verticals. With 80% of the approximate 5
million economically viable parcels in Ontario already captured, and collection continuing in the rest of the country, the US and the UK, the
company can begin measuring ARP. Management is in negotiations with various constituents to provide image related data solutions within
the utility, insurance, real estate and government sectors. We do not contemplate any revenue from potential future contracts resulting from
these business development activities in our current forecast. Broker feedback from the iClarify trial has resulted in requests for potentially
incremental solutions, which are being evaluated by stakeholders at this point.
To date, it appears that the lifespan of an image dataset is approximately two to three years before it needs to be updated. During FY’09, the
City of Hamilton commissioned iLOOKABOUT to re-capture street level data. Hamilton reported that the new data set increased their cost
savings from $16,000 to $36,000 per month. Management believes that there is a natural cycle of data re-capture requested by clients that
could potentially add to its backlog.
Key Revenue Drivers
Forecasted iClarify Queries Parcels of Land Captured
800,000 11,000,000
700,000 10,500,000
10,000,000
600,000
9,500,000
# of Queries
# of Parcels
500,000
9,000,000
400,000
8,500,000
300,000 8,000,000
200,000 7,500,000
100,000 7,000,000
0 6,500,000
Q2'10E Q3'10E Q4'10E Q1'11E Q2'11E Q3'11E Q4'11E Q1'10A Q2'10E Q3'10E Q4'10E Q1'11E Q2'11E Q3'11E Q4'11E
Quebec BC Ontario Total Parcels Added from Backlog
Source: M Partners Estimates Source: M Partners Estimates
VALUATION
We are valuating shares of iLOOKABOUT based on an EV/EBITDA multiple comparison to peer companies for FY’11 with a Discounted Cash
Flow Analysis providing corollary support to the EV/EBITDA multiple method of valuation.
Comparable Companies
The majority of iLOOKABOUT’s direct competitors are privately-held. We therefore look to companies within the broader geospatial sector
and companies in different lines of business with similar transactional on-demand/SaaS business models to form our comp set.
Company Name Business Description
DigitalGlobe, Inc. (NYSE:DGI) DigitalGlobe is a provider of commercial, high-resolution, world imagery products and services. The
company sources imagery from its satellites and its imagery solutions support a wide variety of uses
from mapping and analysis to navigation technology.
GeoEye, Inc. (NasdaqGS:GEOY) GeoEye is a provider of satellite and aerial imagery, location information products and image
processing services.
Member of the Investment Industry Regulatory Organization of Canada (IIROC) Ron Shuttleworth Daniel Lee
Participating Organization – Toronto Stock Exchange (TSX) 416.603.7381 ext. 250 416.603.7381 ext. 277
Member – Canadian Investor Protection Fund (CIPF) rs@mpartners.ca dl@mpartners.ca
6. INITIATING COVERAGE
June 7, 2010
Intermap Technologies Corp. Intermap is a digital mapping company that creates 3D digital models of the earth’s surface for a
(TSX:IMP) range of applications, including geographical information systems (GIS), engineering, automotive,
GPS maps, oil and gas, wireless communications, and 3D visualization.
OMG plc (AIM:OMG) OMG plc, through its subsidiary Yotta DCL provides 3D mapping services to highway authorities with
a complete visual record of their network linked to a map.
Good comparables in different sectors are companies that federate data streams on-demand through a software-as-a-service model. We
believe our approach is valid since these companies’ transaction based revenue models are similar to iLOOKABOUT’s.
Company Name Business Description
Descartes Systems Group Inc. Descartes provides federated data and logistics technology solutions.
(TSX:DSG)
DealerTrack Holdings, Inc. DealerTrack provides on-demand software and federated data solutions for the automotive industry.
(NasdaqGS:TRAK)
Vocus Inc. (NasdaqGM:VOCS) Vocus provides on-demand software and data solutions for public relations management allowing
customers to access a database of journalists, media outlets, and publicity opportunities.
Mediagrif Interactive Technologies Inc. Mediagrif delivers e-commerce solutions for businesses through dedicated Web platforms within
(TSX:MDF) specific business sectors, enabling trade between corporate buyers and suppliers, as well as helping
them to find, purchase, and sell products to exchange information and to access business
opportunities.
The blended median FY’10 and FY’11 EV/EBITDA multiples of iLOOKABOUT’s comparable companies are 7.8x and 5.8x respectively.
iLOOKABOUT’s corresponding multiples are 9.1x for FY’10 and 2.0x for FY’11. We believe that FY’11 multiples more accurately capture the
impact of the iClarify roll-out. Our FY’11 estimates are conservative because 100% of our revenue estimate is accounted for by the company’s
current backlog and the Ontario roll-out of iClarify along with some 2011 adoption in British Columbia and Quebec. Our forecast does not
include a national roll-out of iClarify or any additional vertical market extensions of iLOOKABOUT’s data assets.
If the mean comparative EV/EBITDA multiple of its peer sets were applied to FY’11 forecasted EBITDA, the implied share price for
iLOOKABOUT calculates to $1.33. This share price captures only the impact of iClarify and the current backlog. Using a Weighted Average
Cost of Capital discount of 17.7%, a term of 6 years, and a terminal EV/EBITDA multiple of 7.0x (which constant with the FY’11 mean) our
Discounted Cash Flow Analysis returns a share price estimate of $1.56. In this case, we are capturing a steady state growth rate of 8% per
annum for four years starting in FY 2012. However, we are applying a premium of 5.5% to the gross cost of equity valued at 12.5% to reflect
uncertainty.
Discounted Cash Flow
Terminal EV/EBITDA Multiple
$ 1.33 5.0x 6.0x 7.0x 6.0x 6.5x
15.7% $ 1.36 $ 1.53 $ 1.71 $ 1.53 $ 1.62
16.7% $ 1.30 $ 1.47 $ 1.63 $ 1.47 $ 1.55
WACC 17.7% $ 1.25 $ 1.41 $ 1.56 $ 1.41 $ 1.48
18.7% $ 1.20 $ 1.35 $ 1.50 $ 1.35 $ 1.42
19.7% $ 1.15 $ 1.29 $ 1.43 $ 1.29 $ 1.36
Source: M Partners
SENSITIVITY ANALYSIS
Worst - Case: Ontario only roll-out of iClarify, $6.1 m rolling backlog, 5% CAGR 2012 onward.
Base - Case: Ontario, BC, PQ roll-out of iClarify, $6.1 m rolling backlog, 8% CAGR 2012 onward.
Best – Case: National roll-out of iClarify, $6.1 m rolling backlog, 8% CAGR 2012 onward
We believe that in all three cases our forecasts are generally conservative.
Scenarios
Worst-Case Mid-Case Best-Case
DCF Valuation $1.08 $1.56 $1.92
Potential ROI 80% 161% 219%
Comp Valuation $0.91 $1.31 $1.54
Source: M Partners Estimates
Member of the Investment Industry Regulatory Organization of Canada (IIROC) Ron Shuttleworth Daniel Lee
Participating Organization – Toronto Stock Exchange (TSX) 416.603.7381 ext. 250 416.603.7381 ext. 277
Member – Canadian Investor Protection Fund (CIPF) rs@mpartners.ca dl@mpartners.ca
7. INITIATING COVERAGE
June 7, 2010
UPCOMING CATALYSTS NOT CAPTURED IN FORECAST SCENARIOS
iClarify product extensions: feedback from brokers in the trial has indicated demand for service extensions that, if implemented, could
increase ARP for iLOOKABOUT
US licensing deals: Currently, iLOOKABOUT has captured image data for approximately 5% of the approximately 142 million land parcels in
the United States. Insurers in the US experience similar Insurance-to-Value replacement inaccuracy problems as Canadian insurers. Although
competition in the US is greater, the company continues to work on iClarify-like opportunities within that country. This is not captured in our
forecast.
Data licensing deals: SaaS data suppliers in real estate, local search, enterprise content management, and logistics are interested in
acquiring access to accurate street level image data and addressing. The Company is in discussions with several vendors regarding licensing
and partnership opportunities similar to the one negotiated with SCM.
Asset and Risk solutions: About 30% of the total market is related to commercial properties. Although iLOOKABOUT has data for 80% of
commercial properties in Canada, our forecast does not include a commercial property solution.
Municipal and utility licensing deals: The Company provides solutions to a few dozen small cities and counties in Canada and the US,
along with Hamilton, and recently, Westminster England. There are likely additional cities in the company’s pipeline that are not contemplated
in our forecasts.
BALANCE SHEET
With $2.0 million in cash, and impending cash flow within two quarters, the company has sufficient cash to operate. However, if the Company
were to acquire data assets, or to invest in joint venture partnerships, it is likely that it would be required to raise capital.
RISKS
Competition: The street-level category should become more crowded as enterprises begin to utilize image data for more applications.
Besides Google, there are several companies worldwide that are at various stages of development in the area of panoramic image data. We
see more competition emerging in the mid-to-long-term. This could impact pricing as more vendors offer alternatives during RFP processes
when current data collection needs to be upgraded in two to three years time. However, in the short-term, investors should focus on valuation
gap created by the potential of the iClarify contract.
Revenue concentration: The partnership with SCM could represent more than 50% of iLOOKABOUT revenue for the next several quarters,
increasing the risk of significant negative impact on our forecasts if the contract is canceled or adoption is impaired.
Liquidity: ILA is a microcap technology stock with limited history and with 55.8%,or 22.3 million shares of float. The average daily volume
over the past three months is 55,000 shares traded, or just over $25,000 per day. We believe that there are sufficient upcoming catalysts to
generate more trading volume.
Pace of deployment and adoption: Forecasts are sensitive to the pace of both deployment and adoption of the iClarify solution by brokers.
To date, deployment has proceeded quickly, and SCM expects the province to be deployed by the end of June. The adoption rate is less
understood. However, we believe that our forecast and sensitivity analysis are sufficiently conservative to minimize the impact of adoption
that diverges from forecasts.
Privacy concerns: Recent controversy regarding Google’s capture of Streetview images in European cities has re-ignited lingering privacy
concerns regarding the gathering of the street level data. The privacy complaint regarding Streetview is not related to the gathering of images,
but to the collection of data from residential wireless networks. Although iLOOKABOUT has, in the past, received privacy complaints regarding
image gathering, its methodologies exclude it from gathering local wireless data. With respect to image gathering, the software has built in
algorithms that blur out personal identifiers such as license plates, and faces.
Intellectual property protection: The company has several patents pending related to the methodologies by which it captures,
manipulates, and stores image data. There is a significant amount of activity in the sector, so there may be prior art risk on patents pending.
Member of the Investment Industry Regulatory Organization of Canada (IIROC) Ron Shuttleworth Daniel Lee
Participating Organization – Toronto Stock Exchange (TSX) 416.603.7381 ext. 250 416.603.7381 ext. 277
Member – Canadian Investor Protection Fund (CIPF) rs@mpartners.ca dl@mpartners.ca
8. Appendix A - Comparable Companies
Valuation Multiples
LTM LTM LTM 3-Year
Market Cap Ent. Value Cash & FY'10 TEV/ FY'11 TEV / TEV/LTM TEV/ LTM
Revenues EBITDA EBITDA LTM EPS Growth
(mm) (mm) Equiv. (mm) EBITDA EBITDA EBITDA Revenues
(mm) (mm) Margin (%) Rate (%)
Geospatial Imaging
DigitalGlobe, Inc. (NYSE:DGI) 1,277.2 1,479.0 291.8 142.3 164.5 56.4 0.84 0.0 7.8x 5.7x 9.0x 5.1x
GeoEye, Inc. (NasdaqGS:GEOY) 701.0 854.7 306.3 227.5 162.2 52.9 1.61 24.8 5.3x 5.0x 5.3x 2.8x
Intermap Technologies Corp. (TSX:IMP) 49.8 41.5 28.3 10.8 (11.0) (39.0) (0.58) 2.9 NM NM NM 1.4x
OMG plc (AIM:OMG) £18.44 £14.37 £27.00 £4.08 £2.25 8.3 £0.01 17.6 5.3x 4.4x 6.4x 0.5x
Group Average 6.1x 5.1x 6.9x 2.5x
Group Median 5.3x 5.0x 6.4x 2.1x
Member – Canadian Investor Protection Fund (CIPF)
SaaS Federated Data
Descartes Systems Group Inc. (TSX:DSG) 367.6 266.7 73.8 94.6 16.1 21.8 0.25 12.4 10.2x 8.2x 15.6x 3.4x
Participating Organization – Toronto Stock Exchange (TSX)
DealerTrack Holdings, Inc. (NasdaqGS:TRAK) 646.1 463.7 226.7 183.3 23.0 10.1 (0.03) 6.6 10.5x 8.2x 20.2x 2.0x
Vocus Inc. (NasdaqGM:VOCS) 303.5 200.1 86.4 103.5 3.0 3.5 (0.12) 24.6 12.3x 9.2x 66.1x 2.3x
Mediagrif Interactive Technologies Inc. (TSX:MDF) 116.7 84.4 46.4 32.3 9.6 20.7 (0.25) (1.4) 6.7x 5.8x 8.8x 1.8x
Group Average 9.9x 7.8x 27.6x 2.4x
Group Median 10.4x 8.2x 17.9x 2.2x
Average 8.3x 6.7x 18.7x 2.2x
Member of the Investment Industry Regulatory Organization of Canada (IIROC)
Median 7.8x 5.8x 9.0x 2.2x
iLOOKABOUT Corp. (TSXV:ILA) 18.6 16.2 2.2 2.4 (1.6) (75.8) (0.05) 86.1 9.1x 2.0x 13.7x 7.4x
Souce: Capital IQ; Forward Multiples Based on Consensus Forecasts
Comparable Valuation DCF Implied FY'11 EV/EBITDA
Comp Set FY'11 EV/EBITDA Multiple 6.7x DCF Enterprise Value $56.76
iLOOKABOUT FY'11 EBITDA $8.05 iLOOKABOUT FY'11 EBITDA $8.05
Enterprise value $53.54 Implied Multiple 7.1x
Net Debt ($2.04)
Equity Value $55.58
FD Shares Out 40.2
Share Price $1.38
416.603.7381 ext. 250
rs@mpartners.ca
Ron Shuttleworth
June 7, 2010
Daniel Lee
416.603.7381 ext. 277
dl@mpartners.ca
10. M|PARTNERS Toronto Dominion Centre
Canadian Pacific Tower
100 Wellington Street West
Suite 2201, P.O. BOX 320
Toronto, Ontario M5K 1K2
Main line: 416-603-4343
Fax: 416–603-8608
Contact Information
Research
Alan Breuer ab@mpartners.ca
Scott Chan sc@mpartners.ca
Michael Krestell mk@mpartners.ca
Daniel Lee dl@mpartners.ca
Marc Pais mp@mpartners.ca
Ryan Roebuck rr@mpartners.ca
Ron Shuttleworth rs@mpartners.ca
Tom Varesh tv@mpartners.ca
Trading
Jennifer Burke jb@mpartners.ca
Timothy Dalton td@mpartners.ca
Trumbull Fisher tf@mpartners.ca
Steve Isenberg si@mpartners.ca
Kyle Maister km@mpartners.ca
Jeff Maser jmaser@mpartners.ca
Steve Sandusky ss@mpartners.ca
Jeff Stevens js@mpartners.ca
Jeff Zicherman jz@mpartners.ca
Advisory
Philip Dale pd@mpartners.ca
Christopher Dingle cd@mpartners.ca
Kelly Klatik kk@mpartners.ca
Thomas Kofman tk@mpartners.ca
Jason Matheson jm@mpartners.ca
Paul Reid pr@mpartners.ca
Lawrence Rhee lr@mpartners.ca
Who we are
As a full-service investment bank, M Partners’ first priority lies in the financial satisfaction of its clients. In keeping with the firm’s self-imposed high standards, M Partners’ approach to investment is anything
but standardized. Aiming to create new opportunities and ideas for clients rather than steering them towards typical investment outlets, M Partners has adopted a keen strategy of focused and relevant
research. Such knowledge-driven efforts, coupled with the ample skills of the firm’s management, produces successful services ranging from account management to advisory engagements.
M Partners received Investment Industry Regulatory Organization of Canada (IIROC) approval on April 14th 2005 and trades under broker number 97. The team currently has 23 members of varying degrees
of financial experience, including principals Thomas Kofman and Steve Isenberg, who have a combined 35 years of financial experience and are well known in the field. This backbone of strong leadership will
help chart the firm’s course into the future. In the coming months and years, M Partners will be focusing on a number of verticals, including environmental and infrastructure, real estate, mining,
merchandising and consumer products, and other special situations.
M Partners has strong financial backers who have extensive capital markets experience. The firm is a member of IIROC, a participating member of the Toronto Stock Exchange, The TSX Venture Exchange
and the Canadian Investor Protection Fund (CIPF).
M Partners does not make a market in an equity or equity related security of the subject issuer.
Disclosure
The particulars contained herein were obtained from sources which we believe to be reliable but are not guaranteed by us and may be incomplete. The opinions expressed are based upon our analysis and
interpretation of these particulars and are not to be construed as a solicitation or offer to buy or sell the securities mentioned herein.
In accordance with Policy 3400 of IIROC, M Partners hereby confirms as of the date of this report:
iLOOKABOUT Corp.
Does M Partners or its affiliates collectively beneficially own 1% or more of any class of equity securities of
the company which is the subject of the research report. No
Does the analyst or any associate of the analyst responsible for the report or public comment hold shares
in the company. No
Has M Partners or a director or officer of M Partners or any analyst provided services to the company for
remuneration other than normal investment advisory or trade execution services within the preceeding 12
months, (may seek compensation for investment banking services from the company herein within the
next 3 months). No
Is any director, officer, employee or research analyst an officer, director or employee of the company, or
serves in an advisory capacity to the company. No
Has the analyst has viewed the material operations of the company. We define material operations as an
issuer's corporate head office and its main production facility or a satellite facility that is representitive of
the company's operations. Yes
Did M Partners provide investment banking services for the company during the 12 months preceding the
publication of the research report? No
Has the analyst preparing the report received compensation based upon M Partners investment banking
reveneus for this issuer? No
Dissemination
All final research reports are disseminated to institutional clients of M Partners simultaneously in electronic form. Hard copies will be disseminated to any client that has requested to be on the distribution list
of M Partners. All research reports are also posted on the website of M Partners Inc., at www.mpartners.ca. Reproduction of this report in whole or in part without permission is prohibited.
Research Analysts
The Research Analyst(s) who prepare this report certify that their respective report accurately reflects his/her personal opinion and that no part of his/her compensation was, is, or will be directly or indirectly
related to the specific recommendations or views as to the securities or companies. M Partners compensates its research analysts from a variety of sources and research analysts may or may not receive
compensation based upon M Partners investment banking revenue.
Rating System
Buy: price expected to rise
Sell: price is inflated and expected to decrease
Hold: properly priced
Speculative Buy: price expected to rise; material risk to the investment exists
Under review: not currently rated
Summary of Recommendations
as of April 30, 2010
Buy 17 71%
M|PARTNERS
Hold 3 13%
Under Review 4 17%
Total 24 100%
Research • Trading • Advisory