Putnam Lifetime Income Survey 2013
•
0 gefällt mir•8,873 views

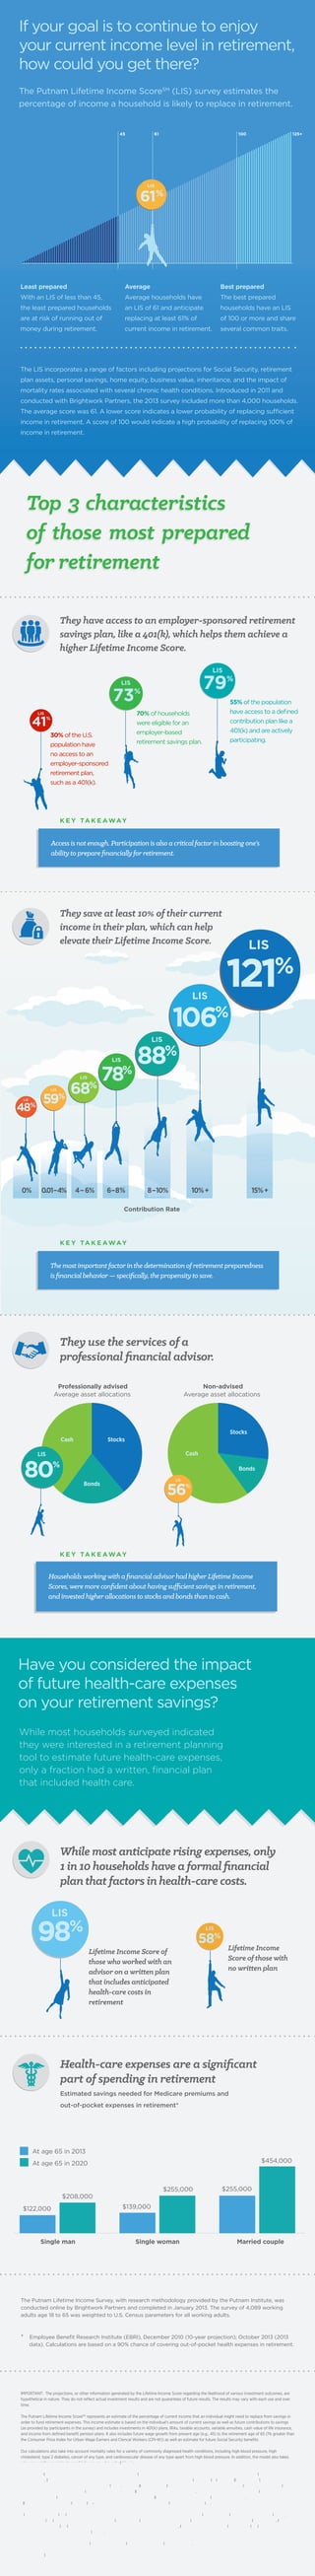
This document discusses factors that determine how prepared households are for retirement. It introduces the Putnam Lifetime Income Score (LIS), which estimates the percentage of pre-retirement income a household is likely to replace during retirement. The document then outlines three key characteristics of households most prepared for retirement according to their LIS: having access to an employer retirement plan, saving at least 10% of income, and working with a financial advisor. It also notes the importance of planning for healthcare costs in retirement.

Empfohlen
Weitere ähnliche Inhalte
Was ist angesagt?
Was ist angesagt? (20)
Andere mochten auch
Ähnlich wie Putnam Lifetime Income Survey 2013
Ähnlich wie Putnam Lifetime Income Survey 2013 (20)
Mehr von Putnam Investments
Mehr von Putnam Investments (20)
Putnam Lifetime Income Survey 2013
- 1. If your goal is to continue to enjoy your current income level in retirement, how could you get there? The Putnam Lifetime Income ScoreSM (LIS) survey estimates the percentage of income a household is likely to replace in retirement. 45 61 100 125+ LIS 61% Least prepared Average Best prepared With an LIS of less than 45, Average households have The best prepared the least prepared households an LIS of 61 and anticipate households have an LIS are at risk of running out of replacing at least 61% of of 100 or more and share money during retirement. current income in retirement. several common traits. The LIS incorporates a range of factors including projections for Social Security, retirement plan assets, personal savings, home equity, business value, inheritance, and the impact of mortality rates associated with several chronic health conditions. Introduced in 2011 and conducted with Brightwork Partners, the 2013 survey included more than 4,000 households. The average score was 61. A lower score indicates a lower probability of replacing sufficient income in retirement. A score of 100 would indicate a high probability of replacing 100% of income in retirement. Top 3 characteristics of those most prepared for retirement They have access to an employer-sponsored retirement savings plan, like a 401(k), which helps them achieve a higher Lifetime Income Score. LIS LIS 79% 73 LIS % 55% of the population have access to a defined contribution plan like a 401(k) and are actively participating. 70% of households were eligible for an employer-based retirement savings plan. 41 % 30% of the U.S. population have no access to an employer-sponsored retirement plan, such as a 401(k). K E Y TA K E A WAY Access is not enough. Participation is also a critical factor in boosting one’s ability to prepare financially for retirement. They save at least 10% of their current income in their plan, which can help elevate their Lifetime Income Score. LIS LIS 121 % 106 LIS LIS LIS LIS LIS 48 % 0% 59 0.01–4% 88 % % 78 % 68 % % 4 – 6% 6–8% 8 –10% 10% + 15% + Contribution Rate K E Y TA K E A WAY The most important factor in the determination of retirement preparedness is financial behavior — specifically, the propensity to save. They use the services of a professional financial advisor. Non-advised Average asset allocations Professionally advised Average asset allocations StocksStocks StocksStocks Cash Cash LIS Cash Cash LIS 80 80 % % Bonds Bonds LIS LIS 5656 Bonds Bonds % % K E Y TA K E A WAY Households working with a financial advisor had higher Lifetime Income Scores, were more confident about having sufficient savings in retirement, and invested higher allocations to stocks and bonds than to cash. Have you considered the impact of future health-care expenses on your retirement savings? While most households surveyed indicated they were interested in a retirement planning tool to estimate future health-care expenses, only a fraction had a written, financial plan that included health care. While most anticipate rising expenses, only 1 in 10 households have a formal financial plan that factors in health-care costs. LIS 98 % LIS Lifetime Income Score of those who worked with an advisor on a written plan that includes anticipated health-care costs in retirement 58% Lifetime Income Score of those with no written plan Health-care expenses are a significant part of spending in retirement Estimated savings needed for Medicare premiums and out-of-pocket expenses in retirement* At age 65 in 2013 $454,000 At age 65 in 2020 $255,000 $208,000 $255,000 $139,000 $122,000 Single man Single woman Married couple The Putnam Lifetime Income Survey, with research methodology provided by the Putnam Institute, was conducted online by Brightwork Partners and completed in January 2013. The survey of 4,089 working adults age 18 to 65 was weighted to U.S. Census parameters for all working adults. * Employee Benefit Research Institute (EBRI), December 2010 (10-year projection); October 2013 (2013 data). Calculations are based on a 90% chance of covering out-of-pocket health expenses in retirement. IMPORTANT: The projections, or other information generated by the Lifetime Income Score regarding the likelihood of various investment outcomes, are hypothetical in nature. They do not reflect actual investment results and are not guarantees of future results. The results may vary with each use and over time. The Putnam Lifetime Income ScoreSM represents an estimate of the percentage of current income that an individual might need to replace from savings in order to fund retirement expenses. This income estimate is based on the individual’s amount of current savings as well as future contributions to savings (as provided by participants in the survey) and includes investments in 401(k) plans, IRAs, taxable accounts, variable annuities, cash value of life insurance, and income from defined benefit pension plans. It also includes future wage growth from present age (e.g., 45) to the retirement age of 65 (1% greater than the Consumer Price Index for Urban Wage Earners and Clerical Workers (CPI-W)) as well an estimate for future Social Security benefits. Our calculations also take into account mortality rates for a variety of commonly diagnosed health conditions, including high blood pressure, high cholesterol, type 2 diabetes, cancer of any type, and cardiovascular disease of any type apart from high blood pressure. In addition, the model also takes into account the consistent use of tobacco on a household basis. The Lifetime Income Score estimate is derived from the present value discounting of the future cash flows associated with an individual’s retirement savings and expenses. It incorporates the uncertainty around investment returns (consistent with historical return volatility) as well as the mortality uncertainty that creates a retirement horizon of indeterminate length. Specifically, the Lifetime Income Score procedure begins with the selection of a present value discount rate based on the individual’s current retirement asset allocation (stocks, bonds, and cash). A rate is determined from historical returns such that 90% of the empirical observations of the returns associated with the asset allocation are greater than the selected discount rate. This rate is then used for all discounting of the survival probability-weighted cash flows to derive a present value of a retirement plan. Alternative spending levels in retirement are examined in conjunction with our discounting process until the present value of cash flows is exactly zero. The spending level that generates a zero retirement plan present value is the income estimate selected as the basis for the Lifetime Income Score. In other words, it is an income level that is consistent with a 90% confidence in funding retirement. It is viewed as a “sustainable” spending level and one that is an appropriate benchmark for retirement planning. The survey is not a prediction, and results may be higher or lower based on actual market returns. Putnam Retail Management 282576 11/13